Business Intelligence
11 Looker Alternatives That Don't Need LookML (2026)
Compare 11 Looker alternatives that run live on your warehouse, balancing governed metrics, ad hoc analysis, and fast time-to-value.

If you want to leave LookML behind, the short answer is this: the best options in 2026 are tools that query your warehouse live, keep metric logic under control, and let both analysts and business teams answer questions without a long setup.
I’d group the 11 tools into three buckets:
- Governed self-serve: Querio, Omni, ThoughtSpot
- Analyst-led workflows: Hex, Mode, Evidence, Lightdash
- Business-user BI: Sigma, Tableau, Power BI, Metabase
The article compares each tool on 4 points:
- Metrics and semantic modeling - how metrics are defined and reused
- Ad hoc analysis - how easy it is to ask new questions
- Governance - how well the tool keeps numbers and access under control
- Time-to-value - how fast a team can get useful answers on live warehouse data
A few facts stand out right away:
- Looker-style modeling can take weeks or months
- Querio starts at $500/month
- Metabase Cloud starts at $85/month
- Metabase Enterprise starts at $15,000/year
- Querio Core is $1,999/month or $1,699/month billed annually
- Power BI Copilot needs Microsoft Fabric F64 or higher
So if I were cutting the list fast, I’d think about it this way:
- Pick Querio if you want governed self-serve with live warehouse access and editable logic in Git
- Pick Sigma if your team wants spreadsheet-style work on top of Snowflake, BigQuery, Databricks, or Redshift
- Pick Omni if you want a shared metrics layer without LookML
- Pick Hex if your team works in notebooks with SQL and Python
- Pick Mode if your analysts mostly live in SQL
- Pick Tableau or Power BI if you already have admin support and a larger BI setup
- Pick Metabase if low cost matters more than tight metric control
- Pick Evidence if you want Git-based reporting instead of self-serve BI
- Pick Lightdash if your team is deep in dbt
- Pick ThoughtSpot if search-first BI is the main goal
::: @figure 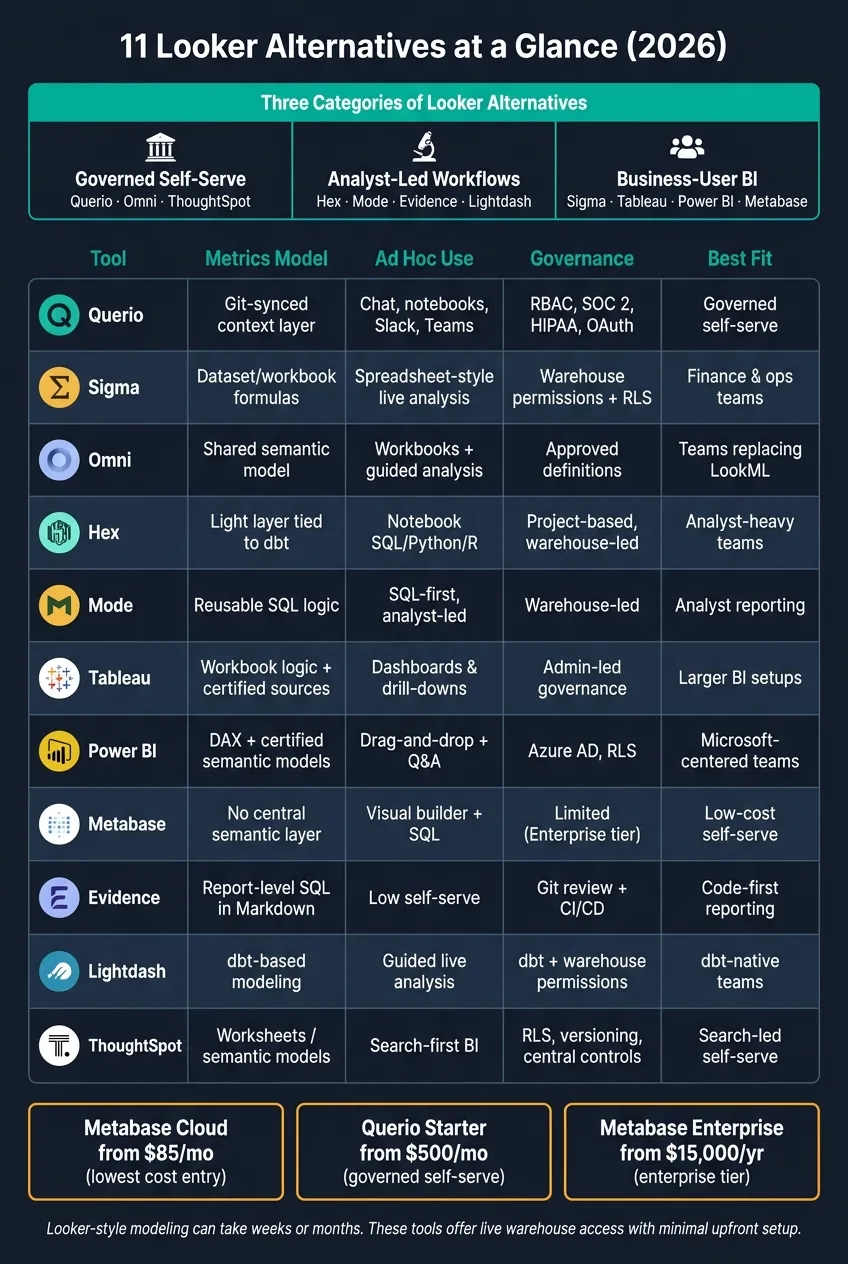 {11 Looker Alternatives Compared: Metrics, Governance & Best Fit (2026)}
:::
{11 Looker Alternatives Compared: Metrics, Governance & Best Fit (2026)}
:::
Tableau Vs Looker - Which Dashboard Tool Is Best? -Modern Data Infrastructure
::: @iframe https://www.youtube.com/embed/W6RajWhWSa0 :::
sbb-itb-284a532
Quick Comparison
| Tool | Metrics model | Ad hoc use | Governance | Best fit |
|---|---|---|---|---|
| Querio | Git-synced context layer | Chat, notebooks, Slack, Teams | RBAC, trust tags, OAuth, SOC 2, HIPAA support | Governed self-serve |
| Sigma | Dataset/workbook formulas | Spreadsheet-style live analysis | Warehouse permissions, user-attribute RLS | Finance, ops, business teams |
| Omni | Shared semantic model | Workbooks + guided analysis | Approved definitions and controlled access | Teams replacing LookML |
| Hex | Light layer tied to dbt | Notebook-first SQL/Python/R | Project-based, warehouse-led | Analyst-heavy teams |
| Mode | Reusable SQL logic | SQL-first, analyst-led | Warehouse-led | Reporting by analysts |
| Tableau | Workbook logic + certified sources | Dashboards and drill-downs | Admin-led governance | Larger BI setups |
| Power BI | DAX + certified semantic models | Drag-and-drop + Q&A | Azure AD, RLS, certified models | Microsoft-centered teams |
| Metabase | No central semantic layer | Visual builder + SQL | Limited unless on Enterprise | Low-cost self-serve BI |
| Evidence | Report-level SQL in Markdown | Low self-serve | Git review and CI/CD | Code-first reporting |
| Lightdash | dbt-based modeling | Guided live analysis | dbt + warehouse permissions | dbt-native teams |
| ThoughtSpot | Worksheets / semantic models | Search-first BI | RLS, versioning, central controls | Search-led self-serve |
Bottom line: if your team cares most about metric control, focus on Querio, Omni, and ThoughtSpot. If your team cares most about analyst freedom, look at Hex, Mode, and Evidence. If you want broad BI access with less setup, start with Sigma, Power BI, Tableau, or Metabase.
That framing gives you the full picture before you get into the tool-by-tool breakdown.
1. Querio
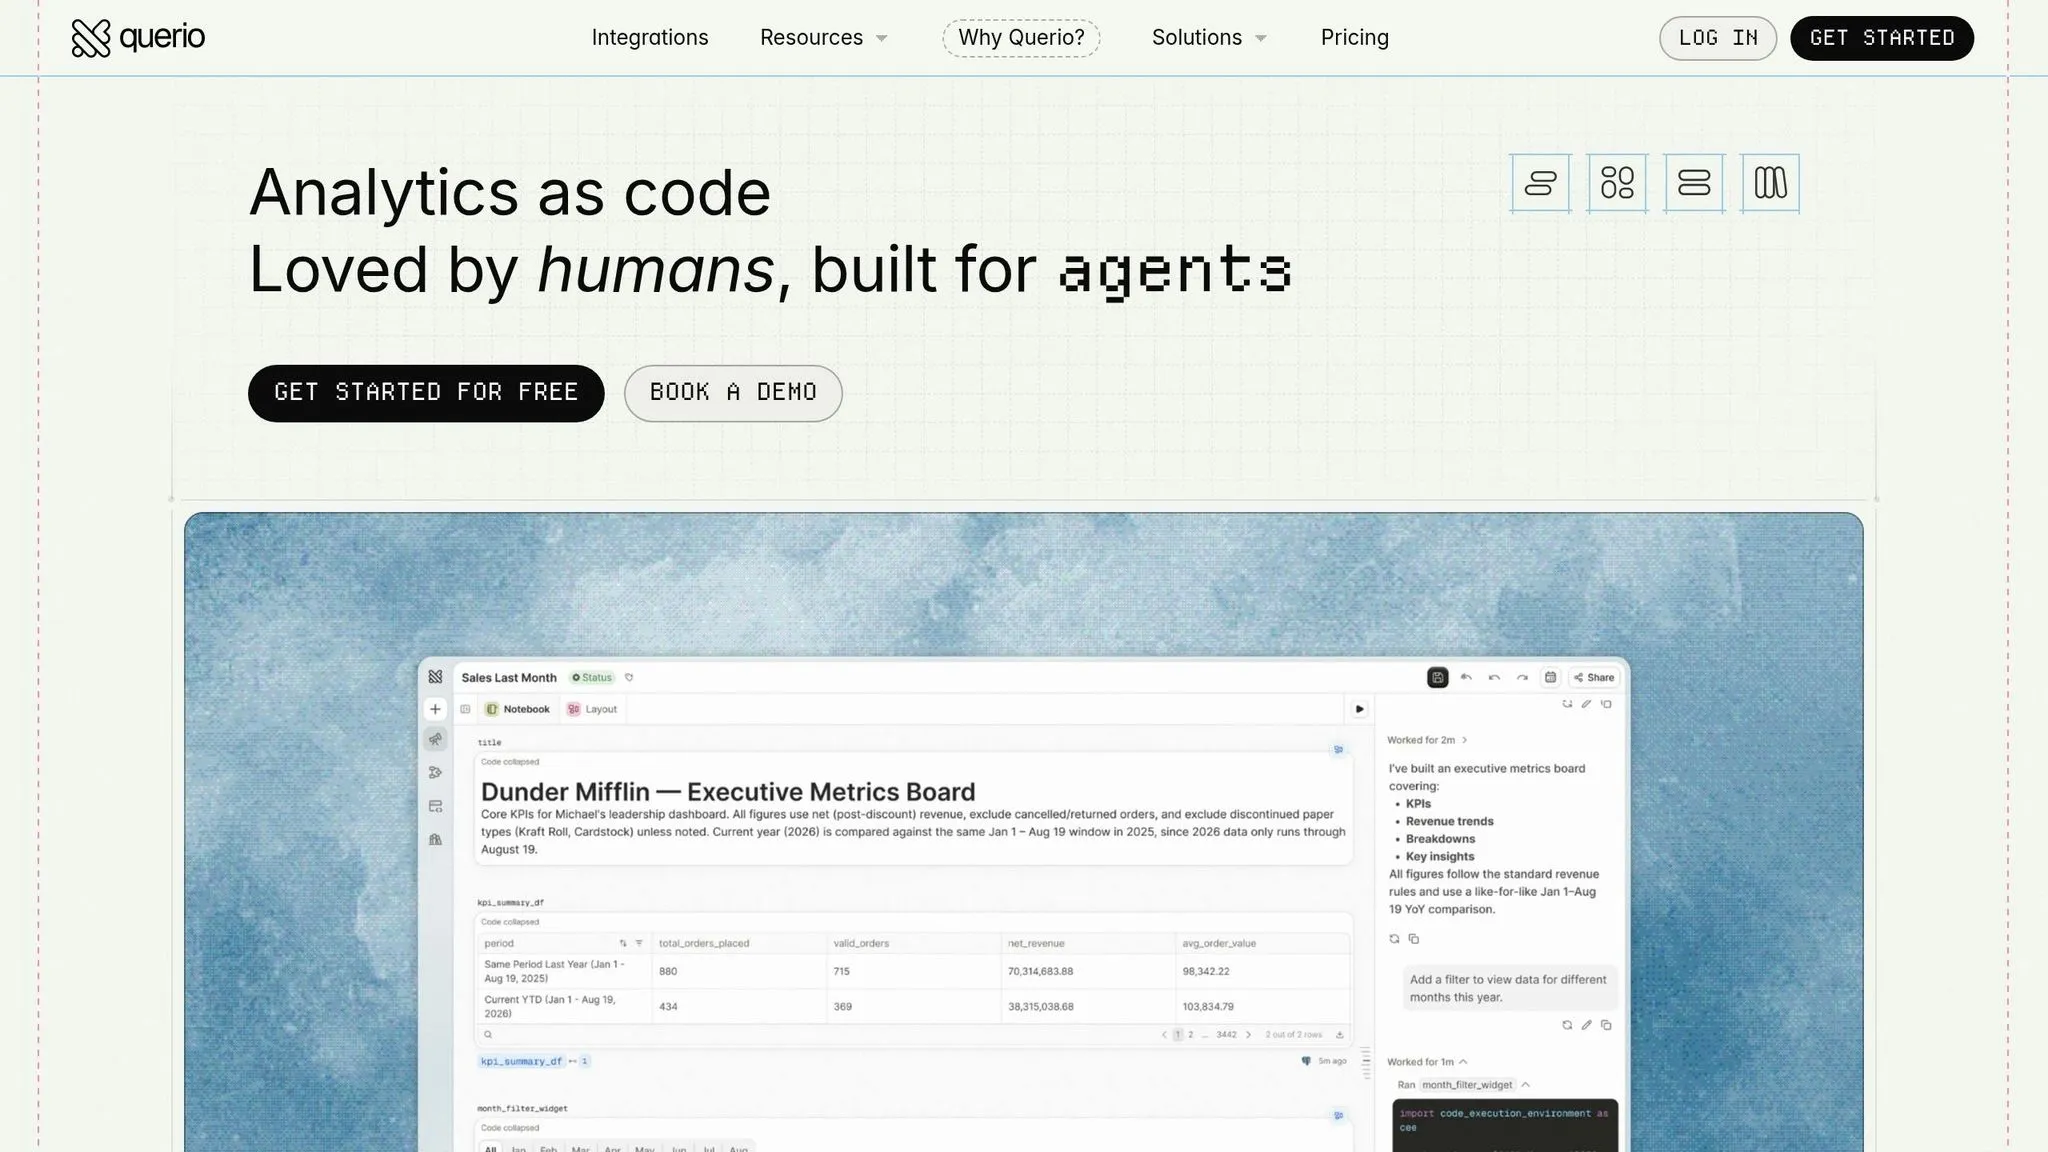
Querio connects to Snowflake, BigQuery, Redshift, and Postgres through read-only live connections. So teams can query warehouse data without extracts or duplicate datasets. For teams that want governed self-serve analytics, that’s a big deal. You get access to live data without signing up for a long modeling project.
Semantic layer
Querio uses a GitHub-synced context layer for metrics, joins, and trusted queries. Definitions live as SQL, Markdown, and Python right alongside your dbt project, and humans approve every change.
That means your metrics stay editable in Git instead of getting stuck inside a closed, proprietary layer.
Ad hoc workflow
Analysts work in reactive notebooks that rerun charts when SQL or Python changes. It’s a simple setup, but it helps a lot when you’re iterating fast.
Business users can ask questions in plain English in Querio, Slack, or Microsoft Teams. And when someone asks through Slack, the request creates a notebook-backed audit trail. So there’s a clear record of what was asked and how the answer was built.
Governance
Querio is SOC 2 Type II certified and supports HIPAA compliance with signed BAAs. It also includes role-based access control, and MCP access uses OAuth, so agent queries follow each user’s existing permissions.
Dashboards include trust-level tags like trusted, experimental, and team-only. Conversations are private by default. In plain terms, teams get self-serve access without losing control.
AI + deployment
Querio delivers answers through Slack, Microsoft Teams, and MCP-compatible clients like Claude.
Pricing starts at $500/month for the Starter plan, which covers up to 10 users. The Core plan costs $1,999/month, or $1,699/month when billed annually. It includes unlimited users, 3 data connections, guided onboarding, no per-question charges, and a hard billing cap to stop surprise overages.
2. Sigma
Sigma stands out when teams want spreadsheet-style analysis right on top of the warehouse without dealing with a code-first modeling layer. It uses a familiar spreadsheet interface to run live queries across Snowflake, BigQuery, Databricks, and Redshift. That setup shapes how Sigma handles metrics, governance, and self-serve analysis.
Metrics model
Sigma defines metrics inside datasets and workbooks with spreadsheet formulas. There’s no centralized semantic layer. That makes it easier to learn, especially for teams that don’t want to pick up a new modeling language.
The tradeoff is pretty simple: metric consistency across teams depends a lot on how clean the upstream data is. Sigma works well on top of dbt, but teams that don’t have that base in place can run into metric drift.
Ad hoc workflow
Business users can slice, filter, and pivot live data without writing SQL. When analysts need more control, they can still drop into SQL.
Sigma also supports native writeback through input tables. Users can adjust forecasts or fix entries inside a dashboard, then sync those changes back to the warehouse. That’s a big deal for finance and operations teams that need live analysis, but also need controlled writeback instead of one-way reporting.
Governance
Sigma inherits warehouse permissions and uses user-attribute RLS. So governance stays simple, though it’s less insulated from raw data.
AI + deployment
Sigma AI supports natural-language querying and automated insights against live warehouse data. It’s a strong fit for finance, ops, and analyst teams that want live warehouse access without the overhead of a proprietary modeling language.
3. Omni
Omni is built for teams that want governed semantic modeling without LookML. It gives analysts and business users one shared layer to define and reuse metrics and relationships, while keeping the workflow centered on the warehouse.
Metrics model
Omni’s semantic model lets teams define metrics and relationships once, then use them again across analysis. It works well for teams on Snowflake, BigQuery, Redshift, or Postgres that want to add structure bit by bit instead of modeling everything at the start.
That makes Omni a good match for teams that want governed self-serve analytics without asking analysts to maintain a LookML layer.
The shared layer also helps keep metrics consistent as teams move from modeling into analysis.
Ad hoc workflow
For ad hoc analysis, Omni keeps workbook analysis and guided business-user analysis tied to the same metric logic. In plain English, whether someone is digging into a workbook or using a guided interface, they’re working from the same definitions.
That goes a long way toward keeping teams aligned.
Governance
Omni’s governance approach is built around reusable definitions, approved metrics, and access tied to shared metric definitions. So instead of giving people unrestricted raw-table access, teams can put guardrails around how data gets used.
For teams that want warehouse-native BI with control built in, that setup makes sense.
With that governed layer in place, AI-assisted querying vs traditional BI can stay tied to trusted definitions.
AI + deployment
Omni includes AI that lets users ask questions in natural language while working through the governed semantic layer. It also supports live warehouse connections without a proprietary modeling language.
That can make rollout faster and cut down on upfront modeling work. Omni is a strong choice for teams that want warehouse-native analytics, AI-assisted querying, and controlled self-serve.
4. Hex
Hex is the notebook-first option on this list. Analysts work in shared notebooks with SQL, Python, and R, then turn that work into apps other people can click through and use.
Metrics model
Hex uses a lighter semantic layer connected to dbt models for shared metrics and versioned transformations, but metric consistency still comes down to dbt discipline. Because of that, Hex is a better fit for analysis-led workflows than centrally managed business reporting.
Ad hoc workflow
Hex is built for analysts who want to dig into data, test hypotheses, and run multi-step analysis in one place. Once the work is done, they can publish it as an interactive app so non-technical stakeholders can explore the results without touching the code.
That’s the appeal. You get the freedom of a notebook, then a cleaner way to share the output. The trade-off is pretty simple: this setup works best when the audience is at least somewhat comfortable with notebook-style work.
Governance
Access is project-based and mostly inherited from the warehouse, which keeps setup simple. But shared metrics still need discipline. That lighter governance can work well for technical teams, though it’s less suited to broad business-user self-serve.
AI + deployment
Hex includes a notebook agent that helps generate SQL and Python cells right inside the notebook workflow. It runs live queries in Snowflake, BigQuery, Redshift, and Postgres, so compute stays in the warehouse.
Hex fits technical teams that want SQL/Python analysis and published apps, not broad no-code self-serve.
5. Mode
For teams that want analyst-led reporting without a proprietary modeling layer, Mode keeps things simple. It’s a strong fit for SQL-first analyst teams. The flow is straightforward: query warehouse data, turn it into reports, and share them without having to learn a separate modeling system.
Metrics model
Mode stores reusable logic in SQL, so metric consistency depends more on team habits than on a central semantic layer. That can work well for analyst-led teams, but it doesn’t enforce a single metric definition across reports. In practice, Mode swaps LookML for SQL-managed logic, which keeps modeling light for teams that prefer to work close to the data.
Ad hoc workflow
Mode connects directly to Snowflake, BigQuery, Redshift, and Postgres. Business users can read published reports with little trouble, but for deeper analysis, they’ll usually need help from an analyst.
Governance
Mode inherits access policies and security controls that are already set in the warehouse. That makes rollout easier for teams that want to move fast without adding another modeling layer.
Deployment
Mode’s main upside is fast deployment for analyst-led reporting. Teams can publish reports quickly because they stay inside their warehouse and skip a separate modeling layer, which cuts down on modeling overhead.
6. Tableau
Tableau is a good fit for teams that want modern BI features without LookML. It tends to work best for enterprise data teams that already have dedicated admins. That trade-off is easiest to see in the way Tableau handles metrics.
Metrics model
Tableau keeps metric logic at the workbook level with calculated fields and LOD expressions. It uses Certified Data Sources and Tableau Catalog to control which data is approved. In practice, metric consistency depends on admins manually approving and tagging the datasets business users can query.
If a team wants tighter central control over metrics, Tableau often isn't enough on its own. That's why many teams pair it with dbt or Cube.
Ad hoc workflow
For ad hoc analysis, Tableau feels fast at first and a bit slower once you get into deeper work. Basic charting is easy to pick up. But more advanced analysis usually means getting comfortable with LOD expressions and more advanced calculated fields.
Tableau connects to:
- Snowflake
- BigQuery
- Redshift
- Postgres
- Databricks
Its live connections can help teams get to usable analysis faster, especially when they need fresher data and want to avoid extract overhead.
Governance
Tableau governance is admin-led. Tableau Catalog tracks data lineage and usage, while Certified Data Sources show which datasets are approved for self-serve analysis.
Gartner recognized Salesforce (Tableau) as a Leader in the 2025 Magic Quadrant for Analytics and BI Platforms [2].
AI + deployment
That same admin-led setup also shapes how Tableau handles AI. Tableau Pulse sends proactive metric digests and AI-generated insights through Slack and email. Einstein Copilot adds natural-language querying.
Tableau+ includes Tableau Agent and more advanced Pulse features. Pricing requires a sales quote [1].
7. Power BI
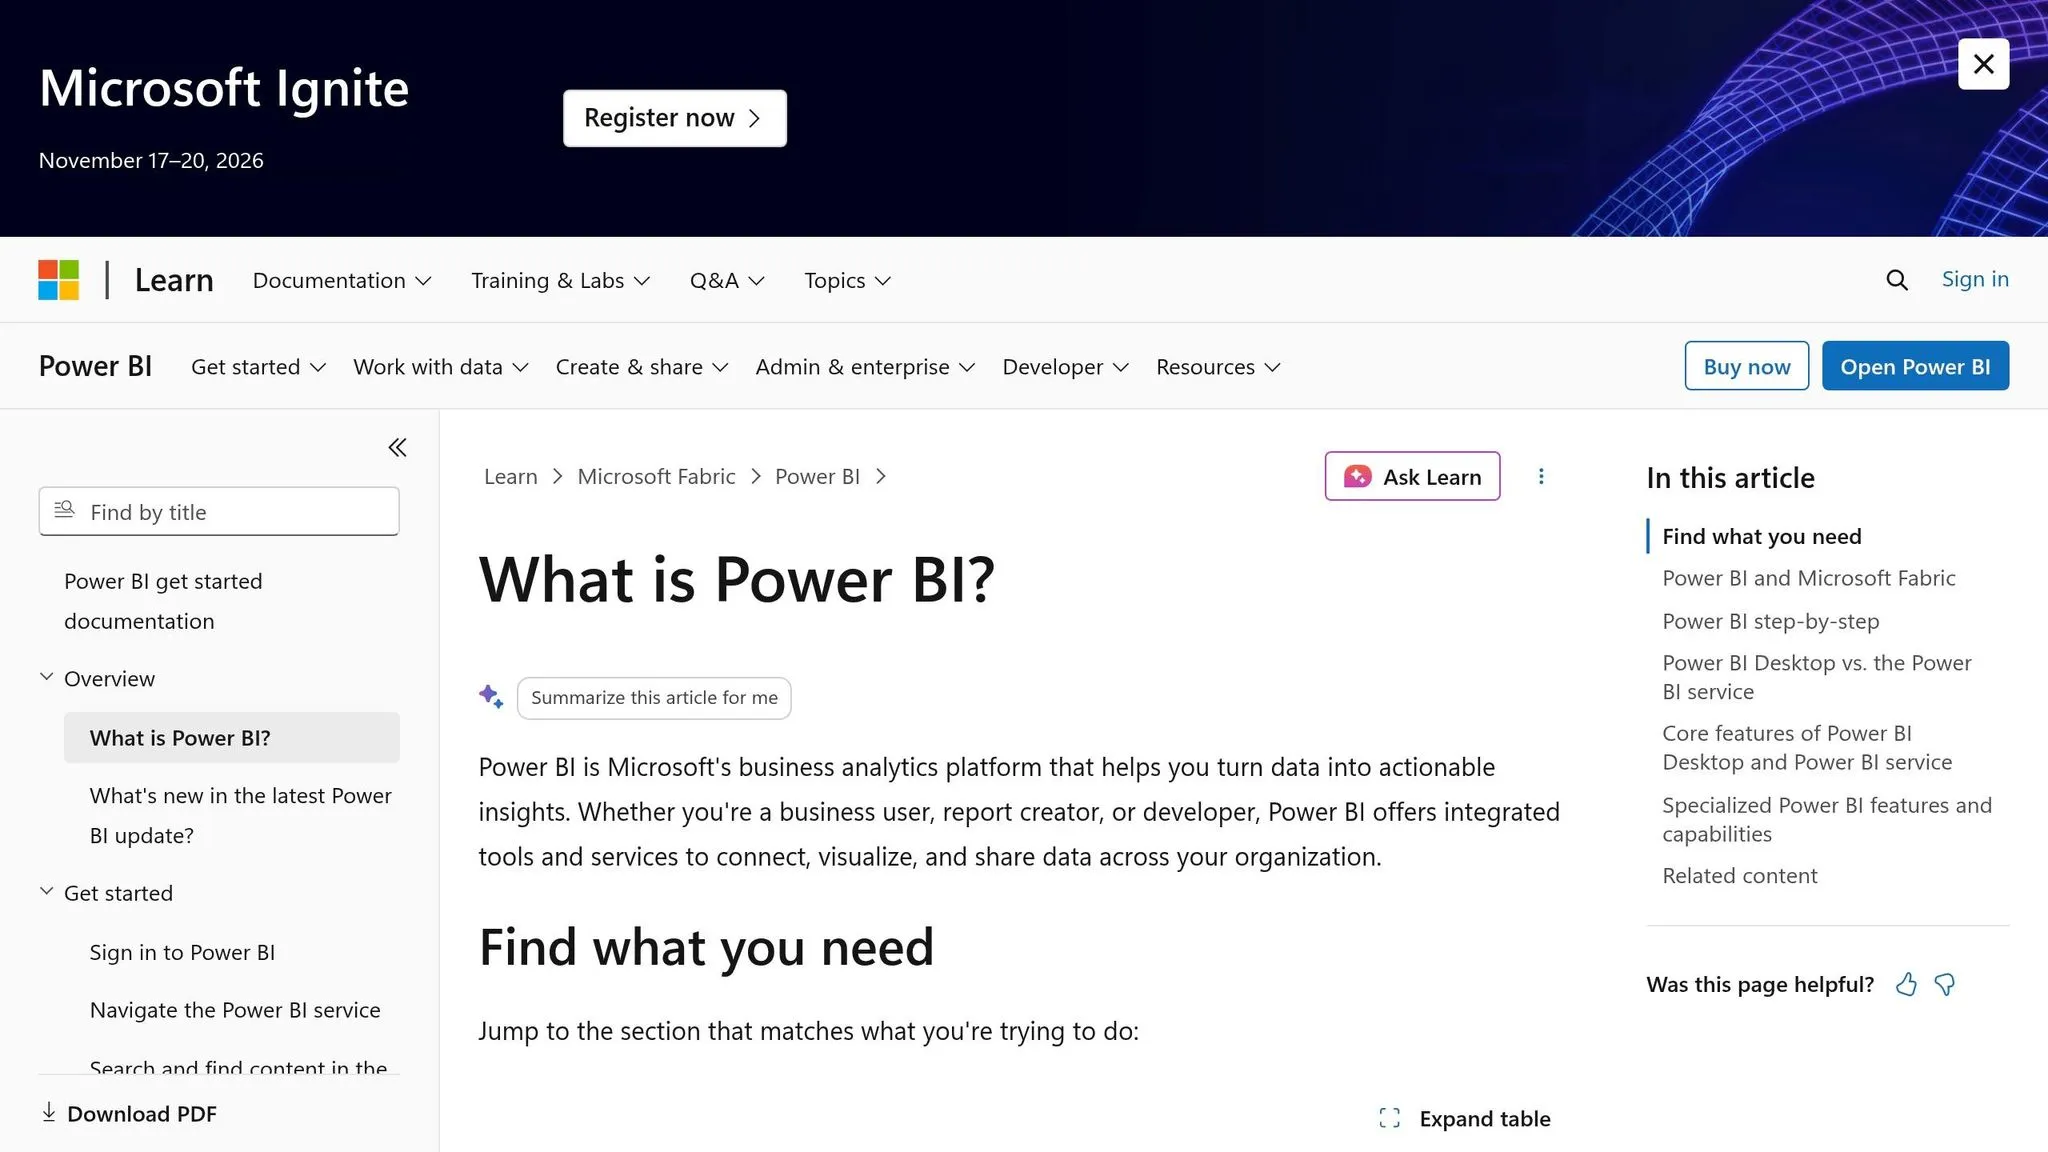
Power BI is a solid fit for teams that already run on Microsoft. If your stack leans on Teams, Excel, Azure, and Fabric, Power BI feels like a natural extension of that setup. It also gives you a way to model data without LookML, using Power Query for data prep, DAX for metric logic, and DirectQuery for live access to warehouse data.
Metrics model
Power BI handles metric logic with DAX and data prep with Power Query. For shared use, it relies on certified semantic models, which are governed datasets teams can reuse across reports while applying row-level security. That means one model can power many dashboards without each team building its own version from scratch.
With DirectQuery, Power BI can query Snowflake, BigQuery, Redshift, Databricks, and Postgres live, so teams don’t need to rely on data extracts.
Ad hoc workflow
Once the model is set up, business users can dig into the data with drag-and-drop analysis or use the built-in Q&A feature to ask questions in plain language. It’s a simple setup for self-serve work, especially for people who don’t want to write SQL every time they need an answer.
One catch: Power BI Desktop is Windows-only. So if your team uses Macs, editing happens in Power BI Service instead.
Governance
The same model used for analysis also supports access control. Power BI manages governance through Azure AD policies, row-level security logic, and certified semantic models. In short, teams can give people room to explore data without opening every door.
Microsoft was recognized as a Leader in the 2025 Gartner Magic Quadrant for Analytics and BI Platforms [2].
AI + deployment
Power BI’s AI layer is Copilot, which supports natural-language questions. It requires a Microsoft Fabric F64 capacity or higher. For Microsoft-centered teams, that tight link with Teams, Excel, Azure, and Fabric is the big draw. If you need live warehouse data plus governed self-serve analysis, Power BI checks those boxes without adding a custom semantic language layer.
8. Metabase
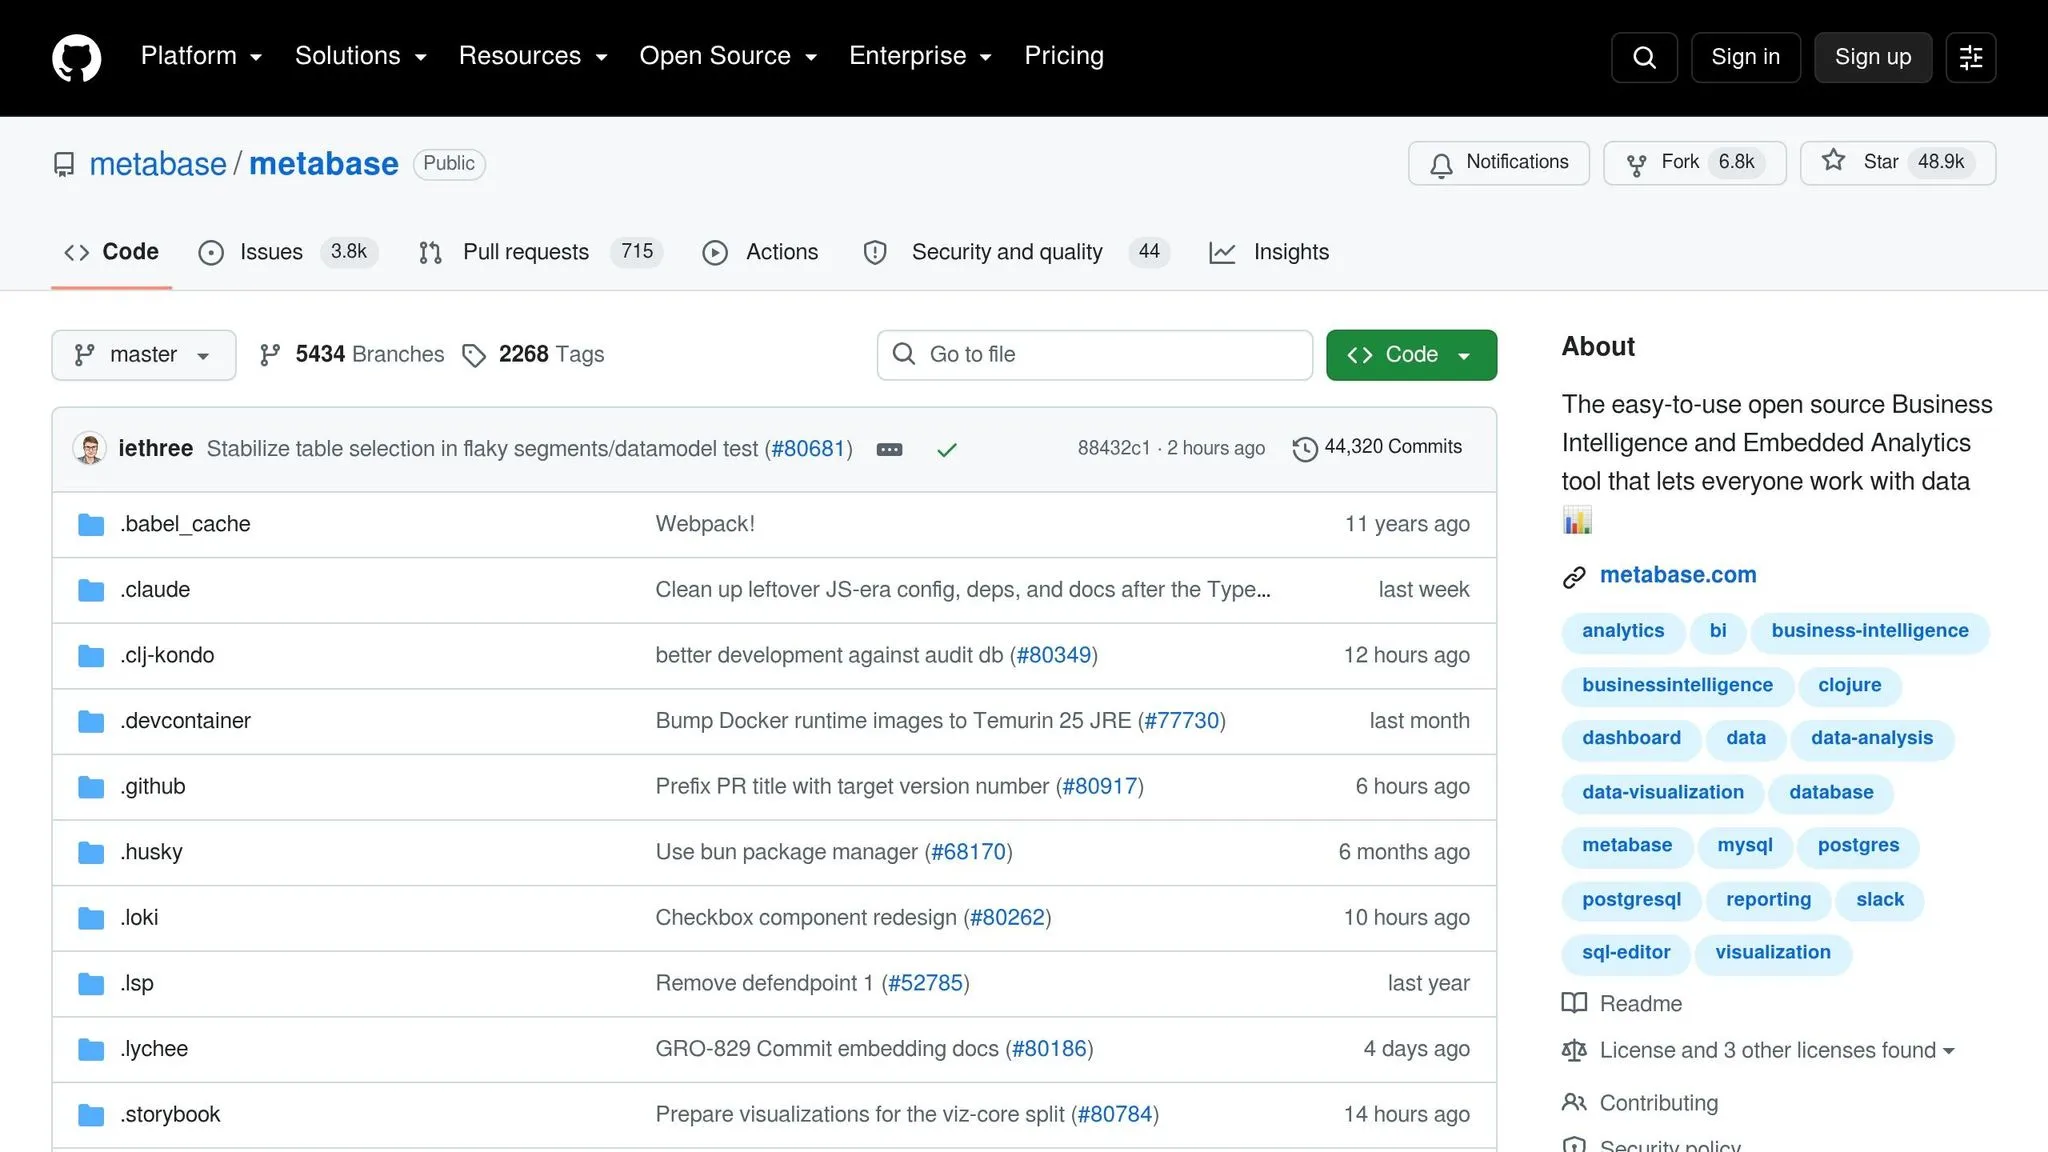
Metabase is a lightweight BI tool built for teams that want fast dashboards on live warehouse data. Compared with analyst-led tools, it leans toward speed and simplicity instead of tight central control. That makes it a good fit for teams that want self-serve BI fast, without signing up for a heavy modeling layer.
Cloud plans start at $85/month, and there’s also a free self-hosted open-source version.
Metrics model
Metabase doesn’t have a centralized semantic layer. Instead, it gives business users a visual Question Builder and gives analysts SQL. So if you want metric consistency, that work usually has to happen upstream in dbt or in the warehouse itself, whether that’s Snowflake, BigQuery, Redshift, or Postgres.
Ad hoc workflow
Business users can build charts with a point-and-click interface, so they don’t need to write SQL for every question. Analysts can jump into the SQL editor when they need more involved queries. Both routes connect live to your warehouse, which makes Metabase handy for fast answers when the data is already clean.
Governance
This is where Metabase starts to show its limits. Without a centralized model, teams can end up with duplicate metrics, overlapping dashboards, and general sprawl. Audit logs and advanced access controls are only available in the Enterprise tier, which starts at $15,000/year. So governance is the main trade-off here.
AI + deployment
Metabase includes Metabot, a natural-language query assistant. It turns plain-English questions into queries, which can save time for basic analysis. But there’s a catch: it can’t fix messy upstream definitions.
For teams that need tighter governance and more consistent metrics, the next option starts to address those gaps.
9. Evidence
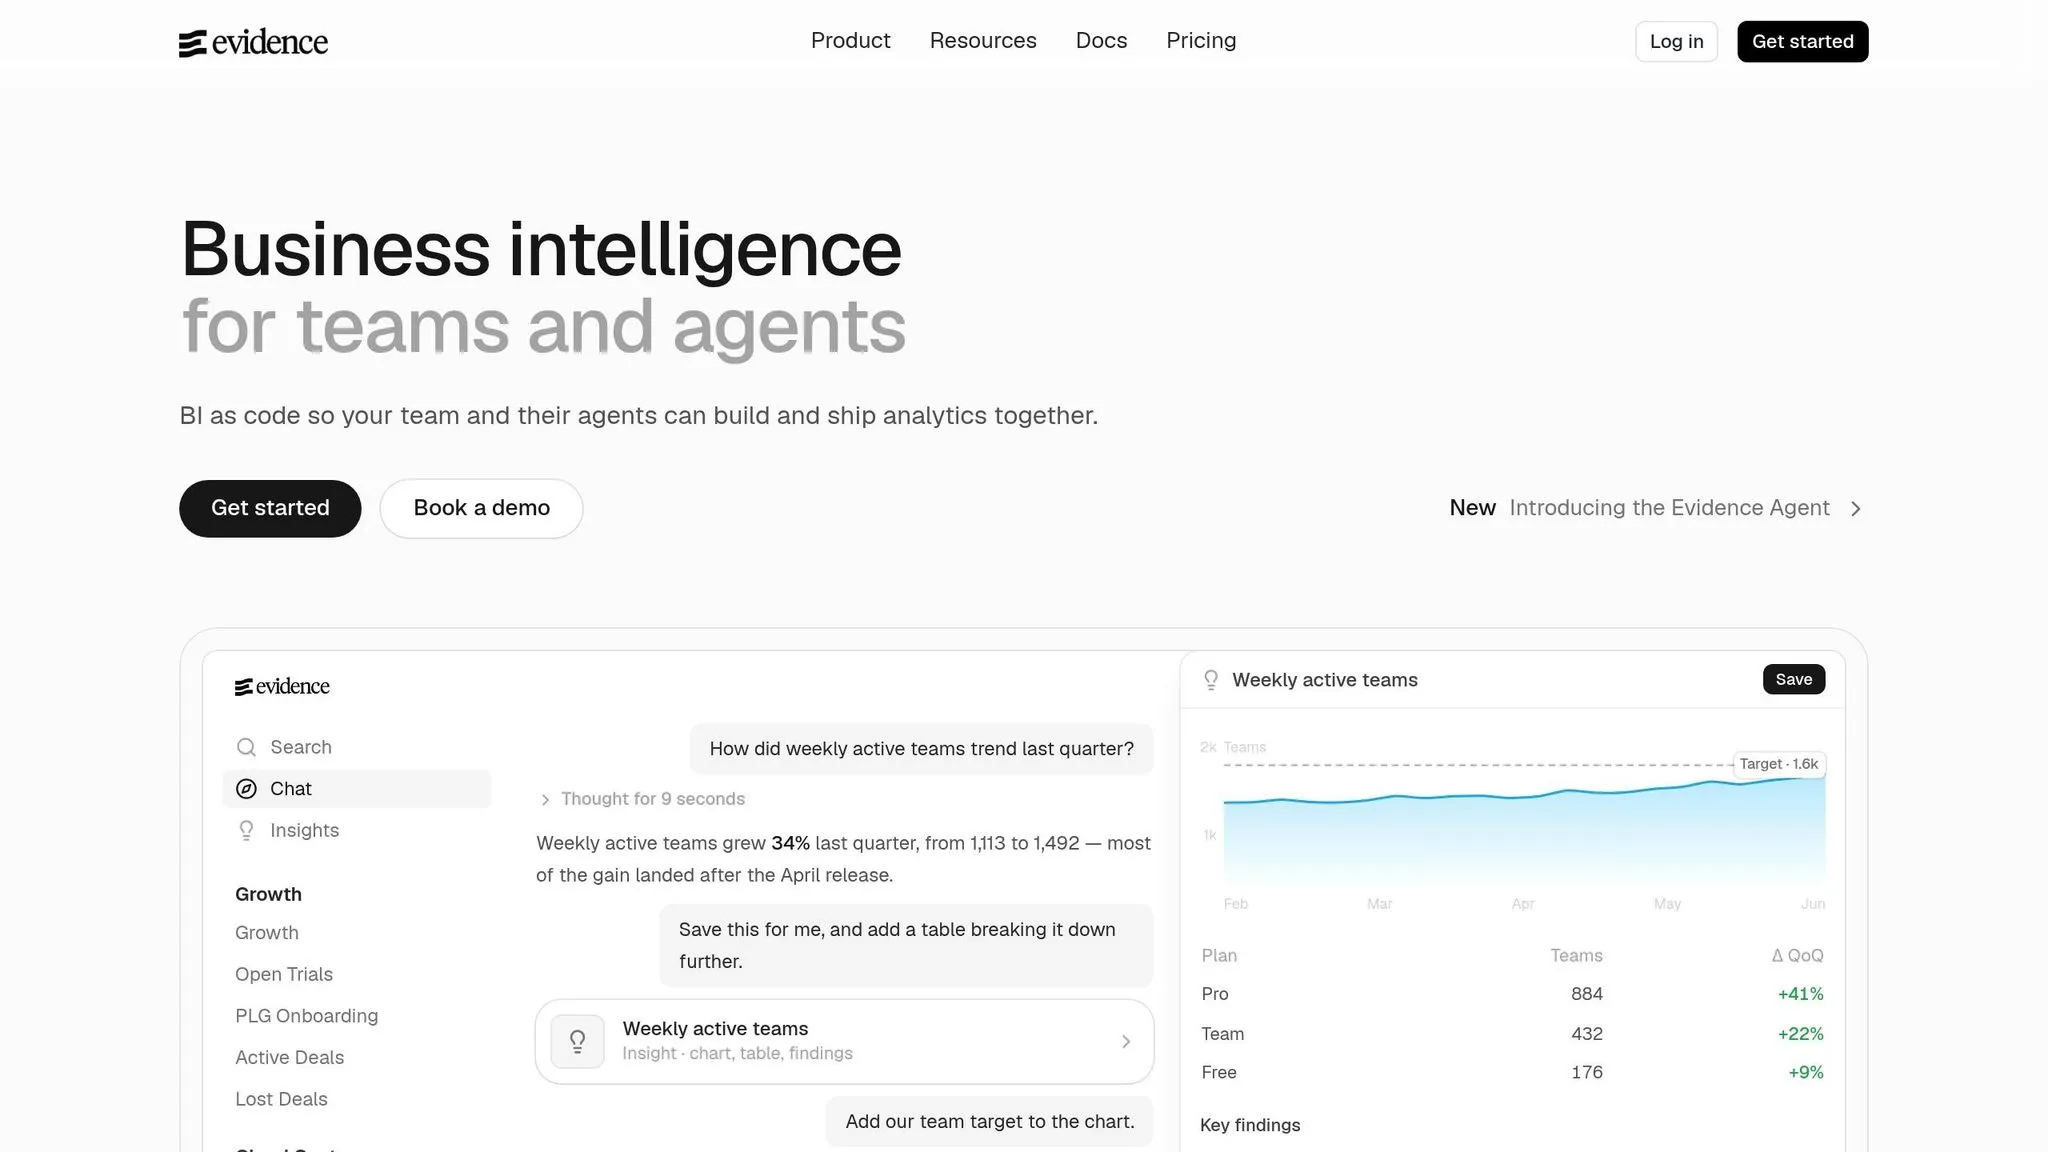
Evidence changes the workflow from interactive BI to versioned, code-reviewed reporting. It’s a code-first reporting tool built for SQL-first reporting, not self-service BI. You write SQL queries, place them inside Markdown files, and publish the output as a static site. Because reports live in Git, every change is versioned and easy to review.
Metrics model
Evidence does not use a proprietary modeling layer. Instead of LookML, it relies on report-level SQL, not a shared semantic layer. If you want shared metrics, they need to come from upstream dbt models or warehouse models.
Ad hoc workflow
Evidence fits scheduled, repeatable reporting. It works for scheduled reporting, not business-user exploration. It is not built for business-user self-serve, which makes it a good fit for controlled reporting rather than broad business-user analytics.
Governance
Every report is a file. That means Git, pull requests, code review, and CI/CD fit right into the workflow. The flip side is simple: non-technical users may find it less friendly. At the same time, that code-first setup makes deployment straightforward.
AI + deployment
Evidence does not include a built-in AI querying layer. There is no native natural-language query layer. You can deploy the output as a static site anywhere.
10. Lightdash
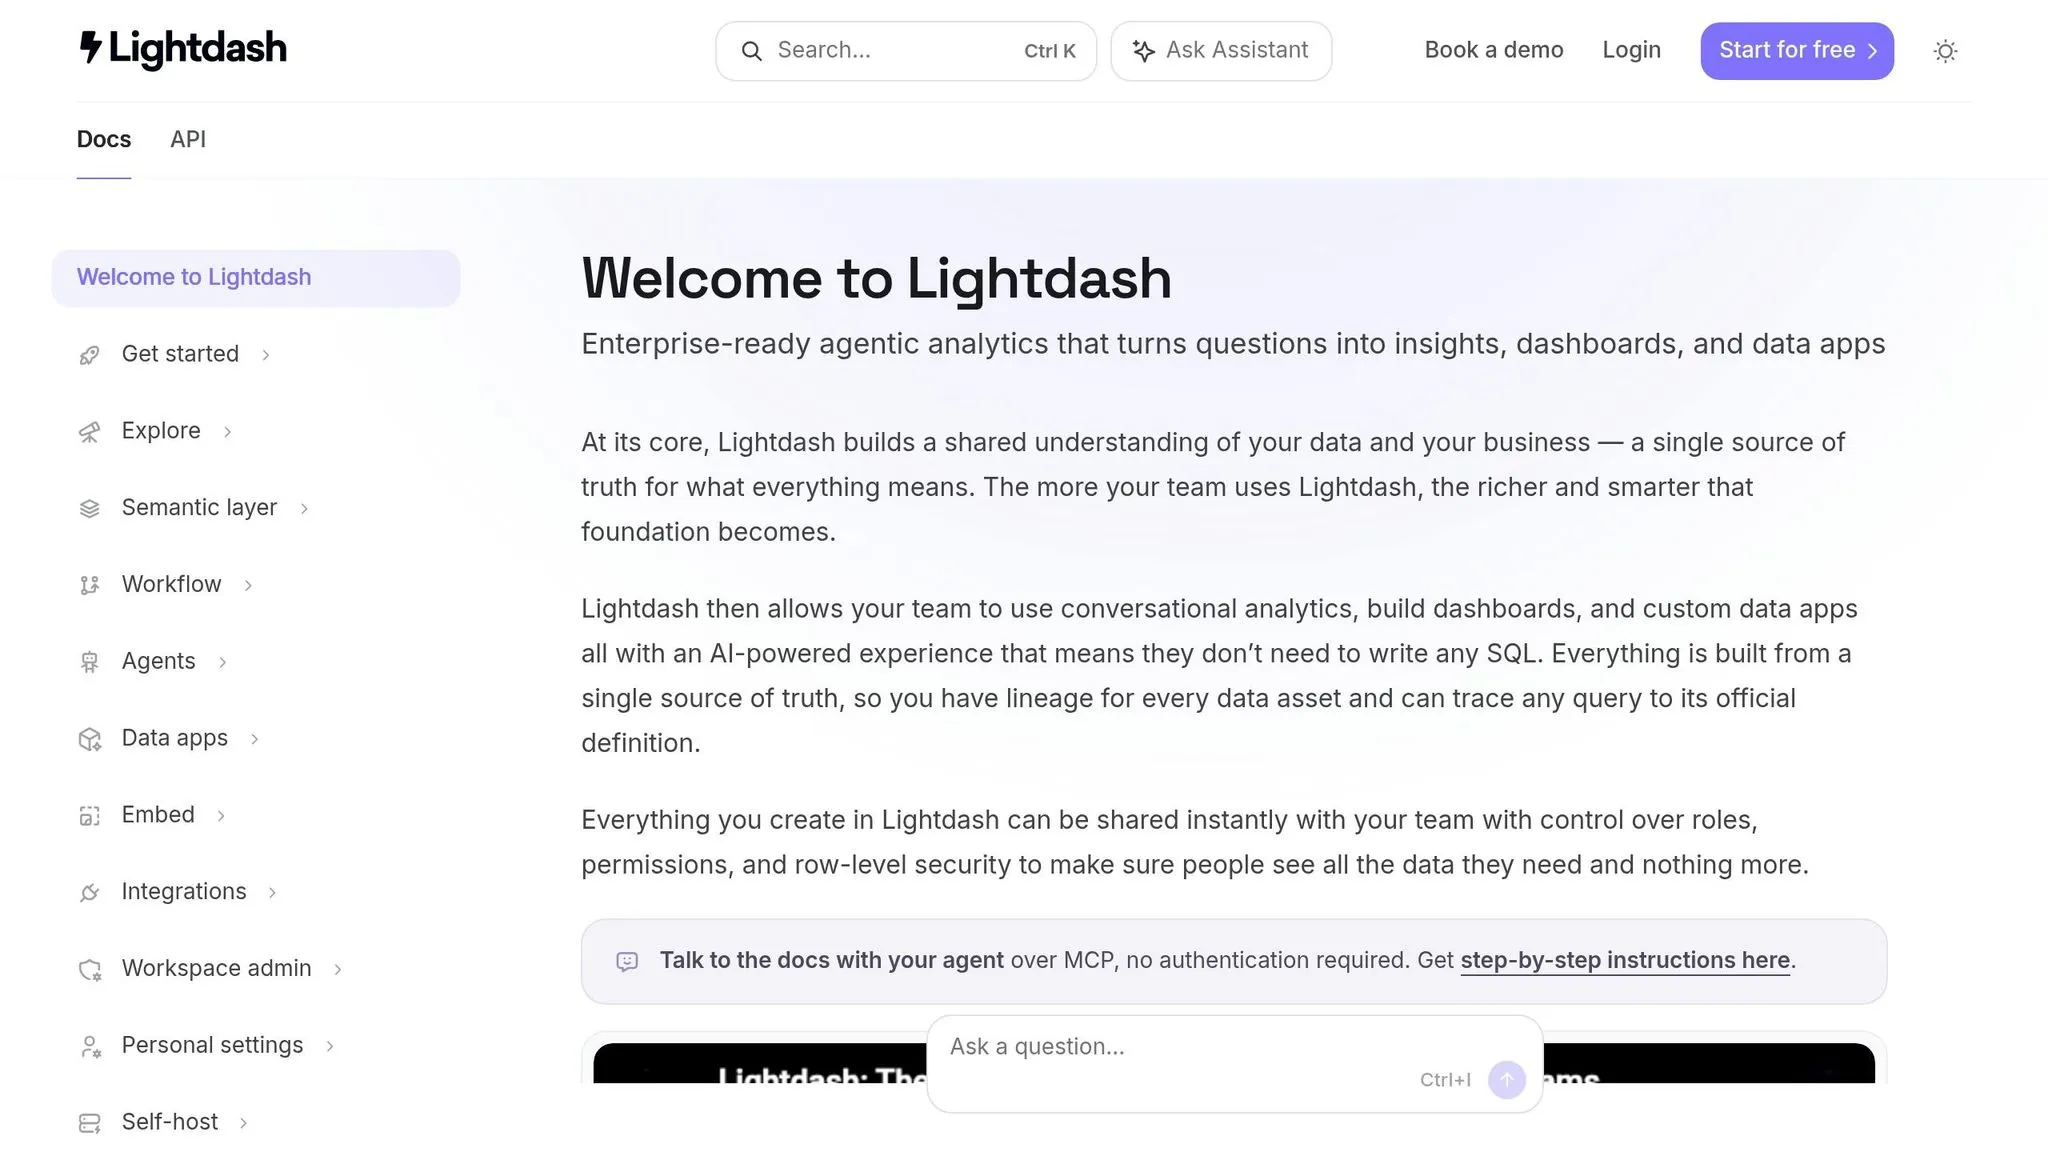
For dbt-native teams that want a LookML replacement, Lightdash is built for that exact use case. It reuses dbt models and metrics, so you can replace LookML without adding a separate semantic layer.
Metrics model
Modeling happens in dbt, which keeps definitions close to the workflow your team already knows. That’s a big plus if your team already lives in dbt day to day.
The trade-off is simple: the experience depends on how complete and well-structured the dbt project is. If the project is clean, Lightdash tends to feel smooth. If it’s messy, that shows up here too.
Ad hoc workflow
Lightdash queries the warehouse live, so users can work with current data without relying on extracts. That makes it a good fit for teams that want direct access to what’s in the warehouse right now.
Access still follows warehouse permissions, so Lightdash doesn’t sidestep the controls you already have in place.
Governance
Governance comes from dbt definitions and warehouse permissions, not from a separate semantic layer. In practice, that means your rules and metric logic stay tied to the systems your team already manages.
AI + deployment
Lightdash is built for guided exploration, not chat-style querying. So if your team wants generative BI embedded natural language question answer, you’ll need another layer on top.
If your team wants AI-first search instead of dbt-first exploration, the next section covers that.
11. ThoughtSpot
ThoughtSpot uses a search-first setup instead of LookML. People ask questions in plain English, and the platform turns those questions into SQL, then returns charts and Liveboards. That makes it a strong pick for teams that want search-driven BI tools without LookML, while still keeping clear model rules in place.
Metrics model
ThoughtSpot swaps LookML for Worksheets or semantic models that define metrics, dimensions, and joins, so teams work from the same business logic. If your team already uses dbt, you can connect the dbt Semantic Layer, which keeps metric definitions version-controlled and native to the warehouse. The trade-off is pretty simple: you still need solid setup work at the start. If the semantic layer is weak, business users can end up seeing mixed results.
Ad hoc workflow
When the semantic layer is in good shape, non-technical users can get answers on their own instead of filing a ticket or waiting for an analyst. They type a question, get a Liveboard, and drill down from there. For teams that want executives and business users to answer questions without SQL, that’s a big plus.
Governance
ThoughtSpot includes enterprise-grade governance, with row-level security, versioning, and centralized access controls. Because Spotter 3 and SpotIQ are tied to the semantic model, AI outputs stay linked to approved definitions.
AI + deployment
ThoughtSpot runs live against Snowflake, BigQuery, Redshift, and Databricks. AI quality depends on the semantic model, so search works best when that model is already trusted. That model-first trade-off is the main thing to weigh against the other options in this comparison.
Strengths and Trade-Offs Across All 11 Tools
No single tool wins in every area. The best choice comes down to what your team needs most: faster deployment, less modeling work, tighter governance, or easier access for business users.
Here’s the short version of the trade-offs that matter most when LookML isn’t in play.
| Trade-off | What it means |
|---|---|
| Semantic consistency vs. flexibility | Tools with a governed semantic layer keep metric logic consistent across BI and AI workflows. Tools without one give you more setup speed, but you may give up consistency. Looker, Querio, and ThoughtSpot lean toward the semantic-layer-first side [1][2]. |
| Live querying vs. extract performance | Warehouse-native tools avoid extract lag, but they can put more compute load on your warehouse. |
| AI add-on costs vs. base license costs | Some tools bill separately for AI features or for higher-capacity tiers. |
Use these trade-offs to cut down your shortlist based on governance, warehouse fit, and how much modeling work your team can handle.
How to Choose the Right Tool for Your Team
Pick a tool based on four things: deployment speed, modeling effort, governance, and how much self-serve freedom business users need. With those trade-offs in mind, these criteria can help you cut down your shortlist.
| Need | What to prioritize | Why |
|---|---|---|
| Fastest time-to-value | Live warehouse connections and minimal upfront modeling | It avoids a long upfront modeling phase. |
| Governed self-serve for business users | A governed semantic layer | Keeps joins, metrics, and definitions consistent across teams and surfaces |
| SQL-first analyst workflows | Inspectable SQL/Python and reactive notebooks | Analysts can stay in a familiar workflow and review the logic directly |
| Embedded analytics in your product | API/iframe delivery, row-level security, and white-label options | Lets you ship governed analytics in customer-facing apps without moving data out of the warehouse |
| AI-assisted querying with inspectable results | Answers grounded in governed metrics and editable logic | Answers should stay tied to governed metrics and editable logic. |
| Lowest modeling overhead | A warehouse-native tool with minimal upfront modeling | Smaller teams can avoid the maintenance burden of building everything upfront |
Querio is a good fit for governed self-serve. It offers live warehouse access on Snowflake, BigQuery, Redshift, or Postgres, plus editable logic and low modeling overhead.
Before you lock in a shortlist, focus on the part that matters most. Get the semantic layer right before you choose a tool. As Valiotti Data puts it:
"Accuracy lives in your semantic layer and your evaluation set, and the tool sits on top of that." [1]
If your metric definitions aren't governed, AI features won't stop teams from ending up with different numbers.
Use these criteria to pressure-test each shortlist candidate before the final FAQ.
FAQs
::: faq
How much modeling do we still need without LookML?
You can work without LookML, but there’s still some setup at the start. It’s just less work.
With Looker, analysts often need to build and maintain LookML semantic definitions before people can self-serve with confidence. If that layer isn’t in place, things can get messy fast.
Schema-first tools like Querio take a lighter path. They can begin with warehouse metadata and layer in simpler metric definitions over time. That said, once more people start using the data, teams still need a shared metric and terms layer to keep everyone aligned. :::
::: faq
Which option is best for governed self-serve analytics?
Querio is the top pick for governed self-serve analytics because it brings together a governed semantic/context layer, live read-only warehouse connections, and AI-generated, inspectable SQL/Python.
Here’s why that matters: business users can ask plain-English questions and get answers based on the same trusted definitions used across dashboards, notebooks, and ad hoc analysis. At the same time, data teams keep the controls they need, with outputs they can audit and edit. :::
::: faq
How do live warehouse queries affect cost and performance?
Live warehouse queries connect straight to the source, so you get real-time access without the extra work of extracts or copied data. That helps keep a single source of truth. The tradeoff is simple: the warehouse does more of the compute.
So cost and speed come down to query efficiency. As queries get more complex, or as more people use the data at once, frequent filtering, drilling, and grouping can push warehouse compute costs up. With large datasets, though, live queries can still beat imported data - if the warehouse is set up well for concurrency and scale. :::