Business Intelligence
15 essential features of modern business intelligence tools
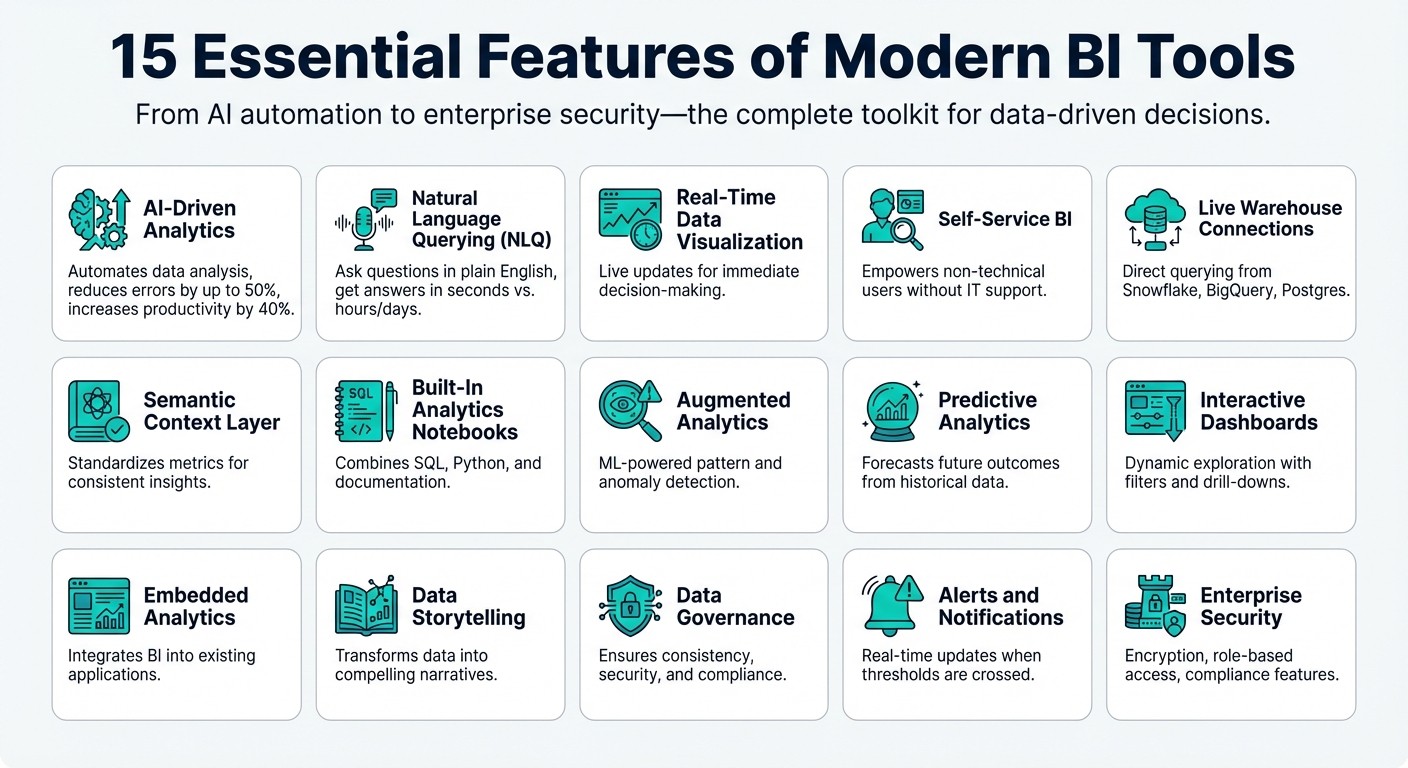
Practical rundown of 15 essential BI tool features — AI analytics, natural‑language queries, live visualizations, governance, security, notebooks, and alerts.
Modern business intelligence (BI) tools are designed to turn raw data into actionable insights, helping businesses make faster and more informed decisions. Here’s a quick overview of the key features these tools offer:
AI-Driven Analytics: Automates data analysis, reduces errors, and provides reliable insights.
Natural Language Querying (NLQ): Lets users ask questions in plain English and get instant answers.
Real-Time Data Visualization: Delivers live updates for immediate decision-making.
Self-Service BI: Empowers non-technical users to access and analyze data without IT support.
Live Warehouse Connections: Ensures data is always up-to-date by directly querying cloud platforms.
Semantic Context Layer: Standardizes metrics and terminology for consistent insights.
Built-In Agentic Notebooks: Combines SQL, Python, and documentation for deeper analysis.
Augmented Analytics: Uses machine learning to detect patterns, anomalies, and trends.
Predictive Analytics: Forecasts future outcomes based on historical data.
Interactive Dashboards: Allows users to explore data dynamically and apply filters.
Embedded Analytics: Integrates BI tools into existing applications for seamless access.
Data Storytelling: Transforms data into narratives for better communication and decision-making.
Data Governance: Establishes rules to ensure data consistency, security, and compliance.
Alerts and Notifications: Sends updates when metrics cross thresholds or anomalies are detected.
Enterprise Security and Compliance: Protects sensitive data with encryption, role-based access, and compliance features.
These features help organizations eliminate data silos, empower teams, and make confident, data-driven decisions. BI tools are no longer just for analysts - they’re for everyone in the business.
15 Essential Features of Modern Business Intelligence Tools
The features every BI tool MUST have
1. AI-Driven Analytics
AI-driven analytics is transforming how we handle data by automating tasks that used to eat up a huge chunk - 60% to 80% - of an analyst's time. Imagine asking a simple question like, "What was our customer acquisition cost last quarter?" and instantly receiving accurate SQL code and visualizations. This kind of speed and automation lays the groundwork for even more advanced features.
The benefits go beyond convenience. AI-powered forecasting can cut errors by up to 50%, and 57% of CFOs report fewer mistakes in sales forecasts after adopting AI tools. Real-world examples back this up: Johns Hopkins achieved a 20% reduction in patient mortality using AI alerts, and FedEx uses AI to predict shipment volumes and adjust operations on the fly.
Boosts Efficiency and Scales Workflows
AI doesn't just save time - it multiplies productivity. Integrating AI can increase labor productivity by up to 40%. Platforms like Wellthy, for instance, use real-time visualizations and natural language searches to streamline operations, saving both time and money - over $200,000 in operational costs.
"AI can effectively automate both data preparation and data analysis, enabling business users in self-service BI environments to focus on strategic tasks that require their experience and business knowledge." - Donald Farmer, TreeHive Strategy
As data continues to grow, AI scales effortlessly without adding more headcount. Teams across departments can dive into live data simultaneously - marketing can analyze campaign results, finance can review budget variances, and operations can track inventory - all without bottlenecks. This seamless collaboration ensures consistent, reliable insights.
Provides Reliable and Consistent Insights
Accuracy isn't just about speed - it’s also about consistency. A semantic context layer ensures that metrics are standardized across the board, so everyone is working with the same definitions for key values. This eliminates the all-too-common issue of conflicting numbers being presented in meetings because of different formulas or data sources.
"AI is no substitute for human judgment – it's a tool that enhances our capabilities." - Dr. Fei-Fei Li, Co-Director, Stanford Institute of Human-Centered AI
AI-generated outputs should be seen as starting points - drafts that become truly powerful when combined with human expertise. This collaboration between AI and human judgment ensures the best possible outcomes.
2. Natural Language Querying
Natural Language Querying (NLQ) allows users to ask questions in plain English - no need for SQL skills or waiting on IT - and get immediate, accurate answers. This approach transforms who can access data insights and how quickly decisions can be made. By building on AI-powered automation, NLQ enables anyone to pull insights directly from live data sources.
The results speak for themselves: 91% of business intelligence users report that these tools significantly improve decision-making [7]. For instance, marketing managers can instantly check campaign performance, and sales directors can retrieve regional sales figures without filing IT tickets. This agility helps organizations act faster and seize opportunities in real time.
Increases Efficiency and Scales Workflows
Traditional business intelligence (BI) systems often create bottlenecks. Data teams spend countless hours writing custom queries for stakeholders, but by the time the results are delivered, the business landscape may have shifted. NLQ eliminates these delays by enabling self-service querying, allowing teams across departments to explore data simultaneously and independently.
Here’s how NLQ compares to traditional querying methods:
Feature | Traditional Querying | Natural Language Querying (NLQ) |
|---|---|---|
User Requirement | Technical skills (SQL, Python) | Plain English |
Speed to Insight | Hours to days (IT dependent) | Seconds to minutes |
Accuracy Basis | Manual code/joins | Semantic layer/Business logic |
Accessibility | Limited to data experts | Open to all business users |
This shift doesn’t compromise quality for speed. Modern NLQ tools connect directly to live data platforms like Snowflake or BigQuery, ensuring results are based on up-to-date information rather than outdated exports. A semantic layer ensures consistent metrics, so whether it’s a marketer or a financial analyst asking the question, the answers remain reliable and uniform.
Delivers Accurate and Reliable Insights
NLQ’s intelligent design ensures that every query pulls from standardized definitions and current data. For example, when someone asks about revenue, the system knows which fields to reference, which transactions to include, and how to account for refunds. This eliminates the inconsistencies that arise when departments interpret metrics differently.
Advanced platforms also integrate feedback loops for continuous improvement. Users can refine AI-generated results, and these refinements are stored in a business-specific glossary, enhancing the system’s accuracy over time. Tools like guided prompts and intelligent query completion further help users frame complex questions correctly. This ensures clarity while maintaining the conversational ease that makes NLQ so effective. By giving users direct access to reliable insights, NLQ accelerates decision-making and strengthens the strategic value of modern BI tools.
3. Real-Time Data Visualization
Real-time data visualization brings live updates to the forefront, allowing teams to respond to shifting conditions as they happen. Whether it's monitoring sudden surges in website traffic, managing inventory levels, or tracking sales performance across multiple regions, this capability changes the game. Dashboards that refresh instantly enable decision-makers to act on current data rather than yesterday's numbers. This immediacy creates opportunities for swift, informed action.
Enhances Decision-Making with Live Insights
Live visualizations provide the context needed to make sense of complex data while offering interactive drill-down features to uncover deeper insights [1]. For instance, if revenue unexpectedly dips in a particular region, users can explore details like product categories, customer demographics, or specific time frames to identify the issue - no need to wait for a custom report.
"A powerful visualization isn't just for show - it's instant understanding. It communicates insights across teams and leadership easily." - Zoho Analytics [1]
This kind of real-time insight becomes even more critical in fast-changing scenarios. With mobile access, executives can track key metrics on the go and receive instant alerts when thresholds are breached [4], ensuring everyone is aligned and informed.
Boosts Efficiency and Streamlines Operations
Following business intelligence best practices with modern tools takes efficiency to the next level by simplifying real-time data analysis. These tools often incorporate AI to speed up root cause analysis, automatically scanning thousands of metrics to identify issues in seconds rather than weeks. This drastically reduces the Mean Time to Detect (MTTD) for problems [8]. As organizations grow, teams can rely on shared live visualizations instead of duplicating reports or waiting for data exports, allowing analysts to focus on delivering strategic insights.
4. Self-Service BI Capabilities
Self-service BI removes the delays caused by IT bottlenecks, giving business users instant access to the data they need. Instead of waiting days - or even weeks - for analysts to generate reports, teams can now explore data on their own without needing to write a single line of code. This shift changes the game for organizations, allowing insights to flow directly to the people who need them most. With self-service BI, data becomes an immediate and integrated resource for every department.
Improves Decision-Making with Data
Traditional BI systems often create frustrating delays. For example, marketing teams might submit requests for reports, only to join a long IT queue, losing precious time as opportunities pass by. Self-service BI changes this dynamic by enabling users to query data directly using plain English. With natural language querying, even non-technical users can quickly uncover the insights they need to make smarter decisions.
Modern platforms take it a step further with a semantic context layer, which translates complex database jargon into everyday business terms. On top of that, AI-powered discovery tools automatically highlight patterns and anomalies that might be missed during manual reviews. This means teams can identify emerging risks or opportunities early - before they escalate into bigger issues.
Increases Efficiency and Scales Workflows
Self-service BI doesn’t just improve access to data; it also makes workflows more efficient. By eliminating repetitive report requests, these tools allow teams to focus on what matters. Governed libraries of curated datasets and pre-defined metrics ensure everyone works from a shared, trusted source of information. Role-based access controls maintain data security, while guardrails help users explore data confidently without introducing errors or inconsistencies.
As organizations grow, the efficiency benefits multiply. Teams can avoid duplicating reports across departments, and analysts are freed from handling routine data requests. Instead, they can dedicate their time to deeper, strategic analysis. With real-time data at their fingertips, business users can base decisions on what’s happening now - not outdated numbers from yesterday.
5. Live Warehouse Connections
Live warehouse connections allow BI tools to query data directly from cloud platforms like Snowflake, BigQuery, and Postgres without needing to create physical copies. This setup ensures teams always work with up-to-date and accurate data, eliminating delays or inconsistencies. By keeping data in its original location, organizations reduce security risks and simplify management since there's no need to transfer information between systems. These direct connections pave the way for precise insights and smoother operations.
Delivers Accurate and Reliable Insights
One of the biggest advantages of live connections is the accuracy they bring to decision-making. By removing the risk of data downtime - often caused by broken ETL pipelines or manual processes - dashboards can pull data directly from the warehouse, ensuring it stays fresh and unaltered during transfer [8]. A centralized KPI library further strengthens this approach by acting as a "single source of truth", avoiding conflicting reports across departments. This way, finance, marketing, and operations teams all rely on the same consistent data when making critical decisions [8].
Boosts Efficiency and Scales Workflows
Live connections save teams from the tedious task of manual data copying and reconciling mismatched metrics. Since dashboards update automatically as new data flows in, teams can monitor key metrics like sales performance or inventory levels in real time. The use of read-only access enhances security, while direct querying leverages the cloud warehouse’s processing power to maintain high performance, even as data volumes grow.
Modern BI platforms also use distributed computing to handle growing workloads. This ensures that as organizations expand, everyone - from analysts to executives - has access to consistent, up-to-date information at the same time. The warehouse processes the data, while the BI tool transforms it into actionable insights, keeping operations efficient and scalable.
6. Semantic Context Layer
A semantic context layer plays a key role in ensuring that real-time insights and streamlined workflows are consistently understood across an organization.
This layer translates intricate database structures into straightforward, familiar business terms that anyone can grasp. Instead of requiring users to understand complex table relationships or write SQL queries, which is a key advantage of semantic layers vs. traditional data models, it establishes consistent relationships, metrics, and terminology across all reports and dashboards. This builds on the real-time data and self-service capabilities discussed earlier, making data more accessible and actionable.
Makes Data-Driven Decisions Easier
When business users work with terms like "monthly recurring revenue" or "customer lifetime value" rather than obscure table names, they can make decisions faster and with greater confidence. The semantic layer ensures that metrics are interpreted consistently across teams. This shared understanding means marketing, finance, and operations departments all analyze performance using the same definitions, minimizing costly misunderstandings.
Boosts Efficiency and Simplifies Workflows
By removing the need for SQL expertise, the semantic layer empowers non-technical users to generate insights on their own. Business analysts can explore and analyze data independently, freeing up data teams to focus on more strategic initiatives rather than handling repetitive reporting tasks. Colin Reid, VP of Product Management at Gartner, highlights this benefit:
"An analytics and business intelligence (ABI) platform supports the development and delivery of IT-enabled analytics for nontechnical users, meaning it provides them with self-service access to approved data, analysis, visualization and reporting capabilities that they can easily explain and share" [2].
This self-service model scales effortlessly as organizations grow. Data teams define joins and business logic once within the semantic layer, enabling thousands of users to access the same governed framework without introducing bottlenecks or inconsistencies.
Ensures Accuracy and Trust in Insights
By standardizing metric definitions, the semantic layer creates a single source of truth. When everyone queries data through the same pre-defined relationships and business rules, it eliminates the issue of different departments producing conflicting reports from the same data. Whether someone is building a dashboard, running ad-hoc queries, or scheduling a report, they can rely on consistent and trusted definitions and calculations every time.
7. Built-In Analytics Notebooks
Built-in analytics notebooks are changing the way teams approach data analysis. By combining SQL, Python, and documentation in a single workspace, these notebooks make it easier to dive deep into exploratory analysis and handle complex data transformations - all without the need to jump between different tools. This streamlined setup promotes clarity and consistency, especially when defining metrics.
Delivers Accurate and Reliable Insights
Unlike traditional UI-based tools that can obscure the underlying logic, notebooks provide full visibility into every calculation and transformation. Teams can inspect the code behind metrics, fostering trust and accountability across the organization. This kind of transparency is key to creating a reliable single source of truth. High-performing organizations are even adopting practices where dashboards and metrics are treated like software, complete with version control, reviews, and testing, to ensure they remain maintainable and reproducible [10].
Increases Efficiency and Scales Workflows
With notebooks, teams can prepare data more efficiently by building and sharing complex transformations that ensure consistent logic across workflows [9]. Their flexibility also supports "what-if" analyses, enabling analysts to test scenarios and iterate quickly. By allowing documentation to sit alongside the code, notebooks not only standardize complex processes but also ensure that every step is fully transparent, boosting both productivity and collaboration.
8. Augmented Analytics
Augmented analytics takes data analysis to the next level by integrating machine learning directly into the workflow. Instead of spending hours manually combing through datasets, machine learning algorithms handle the heavy lifting - scanning historical data, spotting anomalies, and highlighting key trends. This automation shifts the focus from tedious data gathering to interpreting results and uncovering strategic insights.
Improves Decision-Making with Data
One of the standout benefits of augmented analytics is its ability to reduce human bias in data analysis. Machine learning identifies the factors that truly drive outcomes, offering an objective perspective [2]. With tools like Natural Language Processing (NLP) and Natural Language Generation (NLG), even non-technical users can interact with data effortlessly. They can pose questions in plain English and receive clear, data-backed answers [11]. As Microsoft explains:
"Augmented analytics doesn't replace but rather augments human intelligence, intuition, and curiosity" [11].
This combination of automated insights and user-friendly interfaces ensures that decision-makers get faster, more accurate information to guide their strategies.
Increases Efficiency and Scales Workflows
Augmented analytics significantly reduces the time spent on data preparation and exploration. AI tools help automate tasks like cleaning and enriching data, allowing analysts to focus on more complex problems. At the same time, these tools empower non-experts to conduct their own analyses [11]. By building on features like live data and self-service analytics, augmented analytics creates a seamless ecosystem for data-driven decision-making. Colin Reid, VP of Product Management at Gartner, highlights this shift:
"Leveraging ML capabilities to make sense of ever-growing datasets is now table stakes within the ABI space" [2].
This approach eliminates bottlenecks, making analytics operations scalable and efficient, even as data volumes grow.
Delivers Accurate and Reliable Insights
Machine learning algorithms process massive datasets with precision, identifying patterns and outliers that human analysts might miss. Real-time anomaly detection monitors data pipelines, flagging unusual patterns before they lead to costly mistakes [12]. By replacing guesswork with objective, data-driven forecasting, businesses can make more confident decisions [5]. However, for these systems to work effectively, organizations must invest in data literacy training and ensure their data quality remains high, as the reliability of insights depends on the accuracy of the underlying data [11].
9. Predictive Analytics
Predictive analytics takes historical data and transforms it into forecasts that help businesses anticipate what lies ahead. By using machine learning models to analyze past patterns, modern BI tools can predict customer behavior, market trends, equipment failures, and revenue outcomes. This approach shifts organizations from reacting to problems as they arise to proactively planning based on data-driven projections. It builds on augmented analytics by extending insights into future possibilities.
Enhancing Decision-Making with Data
With AI and augmented analytics already driving smarter decisions, predictive tools take things further by uncovering patterns that often go unnoticed. Machine learning algorithms analyze complex datasets with multiple variables, revealing relationships that influence business outcomes. For instance, retailers rely on predictive models to anticipate demand surges during holidays or special events, ensuring shelves are stocked appropriately. Similarly, airlines and hotels use dynamic pricing models to adjust rates in real time based on occupancy forecasts and market demand, helping them stay competitive while maximizing revenue.
Boosting Efficiency and Streamlining Workflows
Predictive analytics removes the tedious manual work traditionally tied to forecasting. Automated tools process massive datasets instantly, giving teams more time to focus on big-picture strategies. Anomaly detection features flag unusual patterns early, helping businesses avoid costly disruptions. In manufacturing, predictive maintenance identifies potential equipment failures before they happen, significantly cutting down on downtime and repair expenses.
Providing Accurate and Dependable Insights
This forward-looking capability complements the real-time and self-service analytics discussed earlier. However, the accuracy of predictions hinges on high-quality data and regular updates to models. Clean, standardized data ensures forecasts represent reality rather than noise. That’s why organizations must prioritize strong data modeling and governance before diving into predictive analytics. Poor data quality is a leading cause of AI project failures. Additionally, models need frequent retraining with fresh data to avoid "model drift", where predictions become less accurate as conditions change. By maintaining rigorous data standards and consistently updating algorithms, businesses can trust these insights to guide critical decisions, like resource allocation and long-term planning.
Capability | Function | Business Impact |
|---|---|---|
Pattern Recognition | Identifies recurring trends in historical data | Spots market opportunities early |
Machine Learning Models | Processes complex, multi-variable datasets | Improves forecast accuracy and reliability |
Automated Forecasting | Predicts outcomes without manual effort | Saves time on analysis |
Real-time Adjustments | Updates forecasts instantly with new data | Enables agile, fast-paced decision-making |
10. Interactive Dashboards
Interactive dashboards elevate static reports into dynamic tools for real-time data exploration. Unlike traditional reports that offer fixed snapshots, these dashboards allow users to dig deeper into specifics, apply filters across various dimensions, and understand trends without needing IT intervention. This approach builds on the self-service business intelligence features mentioned earlier, giving teams the flexibility to investigate issues and answer pressing questions on their own. By combining self-service BI with live data integrations, interactive dashboards make it easier for users to uncover insights independently.
Enhances Decision-Making with Data
With modern dashboards, users can drill down into metrics and turn them into actionable insights. Want more detail? Click on a visualization to reveal granular data. Need broader context? Switch tabs or pull in related external data sources. Cross-filtering takes this functionality even further - one click updates all charts on the screen, instantly highlighting relationships across datasets. This multidimensional analysis helps teams move beyond simply identifying "what happened" to uncovering "why it happened", a crucial step for making smarter strategic decisions.
"People understand visuals faster than text. A powerful visualization isn't just for show - it's instant understanding." - Zoho Analytics [1]
Boosts Efficiency and Ensures Reliable Insights
Automated alerts keep teams informed by monitoring KPIs and sending notifications the moment thresholds are exceeded. Saved views let users create and store their own filter settings, reducing the workload on data teams by eliminating the need for constant custom report creation. These features scale effortlessly, allowing a single dashboard to track thousands of metrics while still delivering a personalized experience for each user.
Consistency is key to accuracy. Live data connections ensure dashboards are always up-to-date, refreshing automatically to provide the latest insights. This eliminates errors from manual data entry or outdated exports while maintaining secure, tailored access for users.
11. Embedded Analytics
Embedded analytics integrates business intelligence (BI) tools directly into the applications your team already relies on - whether it's a CRM system, customer portal, internal tool, or product interface. Instead of switching to separate dashboards, users can access data and insights right where they make decisions. This streamlined approach removes unnecessary steps, making analytics a natural extension of everyday workflows.
Boosts Efficiency and Simplifies Workflows
Traditional BI often forces users to leave their primary workspace, disrupting focus and wasting time. Embedded analytics eliminates this hassle by placing insights directly within the tools teams already use. For example, sales reps can see customer data right in their CRM, while product managers can track usage metrics within their project management software. This integration reduces context-switching, allowing teams to stay focused on their main tasks.
On top of that, flexible pricing models - like usage-based or flat fees - make it easier and more affordable to scale analytics across growing teams.
Provides Consistent and Trustworthy Data
With centralized BI updates, embedded analytics ensures that all applications display consistent, up-to-date information. When metrics or business logic are updated, those changes are automatically reflected across all embedded interfaces, reducing the risk of outdated or conflicting data. Built-in security features, such as encryption and access controls, maintain data integrity and compliance, even when analytics are displayed in external tools.
User-friendly interfaces and natural language search further enhance accessibility, empowering non-technical users to confidently explore and utilize insights.
12. Data Storytelling
Data storytelling transforms raw numbers into meaningful narratives by blending accurate data, clear context, and data visuals. It helps explain what happened, why it’s important, and what actions to take next [13]. Modern BI tools incorporate elements of traditional storytelling - like characters, conflict, and resolution - to guide teams from data insights to strategic decisions. This approach creates a bridge between complex data and actionable outcomes.
Improves Decision-Making with Data
Stories have a unique way of engaging our brains, making information easier to remember and act upon. When storytelling activates the hippocampus, it helps convert information into long-term memory, increasing the likelihood of action [13]. Tools with interactive features and AI-driven insights further enhance this process, enabling teams to validate narratives and quickly identify root causes [1].
"It's not enough to just analyze data; you need to know how to communicate the story it tells in a clear, compelling manner - a skill called data storytelling." - Catherine Cote, Marketing Coordinator, Harvard Business School Online [13]
Increases Efficiency and Scales Workflows
With pre-built templates and automated narratives, teams can skip the time-consuming process of creating custom reports by leveraging AI to turn data into insights [1]. Guided analytics allow even non-technical users to craft professional data stories quickly and efficiently [1][12]. Features like real-time commenting and secure sharing make it easier for multiple stakeholders to collaborate on insights, turning individual analysis into team-driven action [1][6]. As businesses increasingly value these skills, research analyst roles requiring data storytelling expertise are expected to grow by 25% between 2020 and 2030 [13].
Fits Organizational Requirements and Goals
Data storytelling also helps organizations break down silos by making insights accessible to diverse audiences. Interactive charts and drill-down capabilities let stakeholders explore the data behind the story, ensuring alignment across teams [4][5]. By tying insights directly to business goals - like profit forecasting or market trend analysis - teams can justify internal product improvements or build persuasive cases for external stakeholders [13]. This ability to connect data to real-world objectives makes storytelling a vital tool for driving collaboration and achieving strategic outcomes.
13. Data Governance
Data governance establishes the rules and processes necessary to ensure your BI tool provides consistent and reliable insights across your organization. Without these guidelines, conflicting metrics can arise, leading to confusion and eroding trust. Modern BI platforms use a well-defined semantic layer to act as a single source of truth, with governance reinforcing this foundation to maintain consistency and build confidence in the insights delivered.
Ensures Reliable Insights
Strong governance eliminates the issue of "multiple versions of the truth" by centralizing metric definitions and tracking data lineage from its source to the final dashboard. When users can trace results back to clearly governed definitions, they no longer feel the need to verify numbers in spreadsheets. Automated tools for data classification secure sensitive information, such as personally identifiable information (PII), significantly reducing the risk of costly data breaches - which average $4.88 million per incident. Role-based access control (RBAC) ensures that only authorized users can access sensitive data, while still maintaining transparency where appropriate.
"Crafting a single source of truth and an ironclad data governance strategy stands as our critical mission."
Pavel Ermakov, Sr. Director, Regional Head of Data Excellence, Daiichi Sankyo Europe GmbH[14]
Increases Efficiency and Scales Workflows
With standardized metrics and live data connections in place, governance simplifies and accelerates workflows. Automated processes replace manual policy enforcement and incident resolution, cutting down on delivery times and reducing operational overhead [14]. Tools for automated incident management can track and resolve issues without human intervention, ensuring insights remain dependable [14]. Metadata management creates a shared understanding of data by documenting its origin, format, and relationships, which lowers risks and improves collaboration across teams [14]. Even when data is shared in different file formats, built-in protections like encryption and access rules ensure security remains intact [3].
Aligns with Organizational Goals
Organizations that implement strong data governance practices are 2.5 times more likely to see improved financial performance [12]. Governance also prepares companies for AI initiatives by ensuring machine learning models are trained on high-quality, compliant data [7][12]. Additionally, businesses with robust collaboration features in their BI tools are 2.3 times more likely to meet their strategic objectives [12]. Clear ownership of metrics and early definitions of role-based access strike a balance between accessibility and security [7]. As OvalEdge puts it, "Real impact comes when that data is governed, well-defined, and trustworthy." [7]
14. Alerts and Notifications
Automated alerts eliminate the hassle of constantly checking dashboards by delivering critical updates straight to your email or mobile device. Instead of manually monitoring for changes, teams are notified only when metrics cross set thresholds or when anomalies are detected. This shift from manual tracking to exception-based reporting helps users focus on taking action rather than hunting for insights [5]. It works hand-in-hand with real-time dashboards, ensuring users get actionable updates as soon as they matter.
Boosts Efficiency and Streamlines Workflows
Modern BI tools let you customize notifications to fit your needs - whether that's every minute or just once a week - keeping everyone on the same page across departments [4]. Real-time alerts for key performance indicators (KPIs) and anomaly detection notify teams immediately about unusual data patterns or sudden shifts that could indicate technical or operational issues. By automating these processes, teams can skip time-consuming manual data checks and focus on resolving critical matters. Many BI users report that this approach significantly improves decision-making, especially in areas like financial planning and business intelligence reporting tools.
Enhances Data-Driven Decisions
Conditional alerts ensure notifications are sent only when data falls outside expected ranges [5]. Predictive alerts take this a step further by flagging potential issues, like inventory shortages or staffing gaps, before they happen. Mobile-friendly push notifications allow field teams or remote staff to make quick, informed decisions, aligning seamlessly with an organization's mobile strategy [3].
Aligns with Organizational Needs
With advanced data visualization and self-service tools, customized alerts empower teams to act quickly and effectively. Tailor notification frequency to match the urgency of the task - send updates every minute for critical operations or monthly for strategic reviews [4]. Role-based security ensures sensitive alerts are shared only with authorized personnel, while system health monitoring keeps your data pipeline reliable [2][4]. Business users can set up their own filters and saved views to receive alerts tailored to their specific needs [4]. When alerts are triggered, built-in collaboration tools allow teams to discuss and annotate directly within the platform, ensuring smooth communication. Even when reports are exported or shared via email, data security remains intact [3]. Alerts and notifications are the final piece of the puzzle, turning insights into immediate, impactful actions.
15. Enterprise Security and Compliance
With data breaches averaging a staggering $4.45 million per incident, enterprise security has become non-negotiable for BI platforms [15]. Modern BI tools are designed to protect sensitive data through advanced encryption, safeguarding information both at rest and during transit. They also incorporate granular access controls, such as role-based permissions and row-level security and semantic layer controls to restrict access to specific database fields. This layered security and compliance strategy ensures a solid foundation for both compliance and reliable insights.
Delivers Accurate and Reliable Insights
Comprehensive audit trails track every interaction with data, providing transparency and accountability while paving the way for swift forensic analysis when needed. To meet regulatory requirements like GDPR and CCPA, these platforms use data anonymization techniques. These methods modify personally identifiable information during analysis, ensuring compliance without sacrificing the value of the data for decision-making.
Fits Organizational Requirements and Goals
In addition to baseline security measures, BI platforms often include compliance features tailored to specific industries. For instance, healthcare organizations require tools that meet HIPAA standards with stringent access controls. Publicly traded companies need SOX-compliant solutions, while organizations handling EU data must adhere to GDPR. As Semarchy aptly puts it:
"Strong data governance provides the structure that makes regulatory compliance a natural result, rather than just a box-ticking exercise" [16].
The choice between cloud-based and on-premises deployment often hinges on data residency requirements. Cloud solutions offer scalability and shared security responsibilities, while on-premises setups provide organizations with complete control over their infrastructure.
Increases Efficiency and Scales Workflows
Enterprise security isn't just about protection - it also builds trust in the insights that modern BI tools deliver. Features like least privilege access ensure users only access the data necessary for their role, minimizing unnecessary exposure. Automated software updates keep encryption protocols up to date and address vulnerabilities without requiring manual intervention. Built-in audit trails allow security teams to regularly review data access logs, catching potential issues early. Additionally, multi-factor authentication and single sign-on protocols enhance security while maintaining ease of access for authorized users. Together, these measures ensure that workflows remain efficient and scalable without compromising security.
Conclusion
These 15 features serve as a practical guide - covering everything from AI-powered analytics that simplify workflows to enterprise-grade security that safeguards critical data - for creating a strong and scalable BI framework.
The benefits are clear. For instance, 91% of BI users report making better decisions, and 93.9% of companies are increasing their investments in data-driven strategies [7][12]. Organizations that embrace modern BI tools are setting themselves up for a competitive edge that lasts.
Simran Singh Arora of Modern Data 101 puts it best:
"The organizations that embrace this shift will stop firefighting data issues and start scaling decision intelligence as a competitive advantage" [17].
This involves focusing on features like self-service BI and natural language querying to make data accessible to everyone, while still ensuring strong governance and compliance for trustworthy insights.
From breaking down data silos to enabling quick, informed decisions, each feature discussed earlier plays a role in creating a seamless analytics experience. Start by identifying your most pressing business needs - whether it’s real-time data access, empowering non-technical teams, or meeting regulatory demands. Use these 15 features as a benchmark and consider testing high-impact use cases, such as an executive dashboard, to build confidence before a full-scale implementation [7]. A good BI tool should grow with your organization’s data capabilities, not limit them.
With the global business intelligence market expected to hit $116.25 billion by 2033 [17], adopting BI tools isn’t just an upgrade - it’s a commitment to faster, smarter decisions that deliver real results.
FAQs
How does AI-driven analytics improve decision-making in modern BI tools?
AI-driven analytics take the heavy lifting out of data analysis, turning massive datasets into clear, actionable insights. By leveraging machine learning and natural language processing, these tools can sift through complex information, spot patterns, and highlight trends that would take humans significant time and effort to uncover. They also simplify the process by summarizing data, detecting anomalies, and even answering plain-language questions, allowing users to focus on understanding the results instead of wrangling the data.
On top of that, features like predictive modeling and scenario simulation let businesses anticipate trends and weigh potential outcomes before making decisions. These tools deliver real-time insights and tailored recommendations, enabling users - regardless of their technical background - to act quickly and confidently on strategic decisions.
How does a semantic context layer help ensure consistent and reliable data across an organization?
A semantic context layer serves as a crucial link between raw data sources and the business intelligence (BI) tools that analysts and teams rely on. Its primary role is to simplify complex data structures by presenting them in a more intuitive, business-friendly format. For instance, instead of dealing with intricate database tables, users can work with straightforward terms like "total revenue" or "customer churn rate." This consistency ensures that everyone in the organization operates with the same definitions, avoiding the confusion of inconsistent or improvised SQL queries.
By centralizing metrics, calculations, and definitions, the semantic layer guarantees uniformity across dashboards, reports, and self-service tools. It also integrates governance features, such as access controls and certification workflows, to maintain both data accuracy and security. This structured approach empowers teams to make confident, data-driven decisions while ensuring that all analyses adhere to established corporate standards.
How do self-service BI tools help non-technical users analyze data?
Self-service BI tools put the power of data analysis directly into the hands of non-technical users. With features like drag-and-drop interfaces, user-friendly dashboards, and plain-language query options, these tools eliminate the need for coding skills or IT support. This means users can quickly turn raw data into insights they can use with confidence.
By breaking down complex data into easy-to-understand formats, self-service BI tools let users dive into data, combine it in meaningful ways, and analyze it independently. They can design custom reports, craft interactive visualizations, and share insights with their teams instantly. The result? Faster decision-making, less dependence on IT, and a workplace where everyone can leverage data to make informed choices.
Related Blog Posts


