Business Intelligence
Natural language data querying tools
Explore top natural language data querying tools that simplify data access and enhance decision-making for teams of all technical levels.

Natural language data querying tools let you ask questions in plain English to access and analyze data - no coding required. They simplify data exploration and decision-making for both technical and non-technical teams. Here's a quick overview of three leading platforms:
- Querio: An AI data analyst that answers plain-English questions with real SQL and Python, from definitions kept in a git repo your team owns.
- Tableau AI: Excels in visualizations, integrates with Salesforce, but has higher costs.
- Looker AI: Highly customizable, integrates with Google Cloud, but comes with complex pricing.
Quick Comparison
| Platform | Key Features | Limitations | Cost |
|---|---|---|---|
| Querio | Natural language queries, notebooks, dashboards, definitions in git, MCP and CLI for AI agents | Limited non-database integrations | Free plan; Core $2,499/month, unlimited users |
| Tableau AI | Advanced visualizations, Salesforce integration, Tableau Pulse insights | High cost, limited customization | $115/user/month |
| Looker AI | Google Cloud integration, semantic layer, multi-cloud support | Complex pricing, setup fees | Starts at $5,000/month |
These tools make data accessible, reduce reliance on technical teams, and speed up decision-making. Choose based on your budget, technical needs, and existing infrastructure.
1. Querio
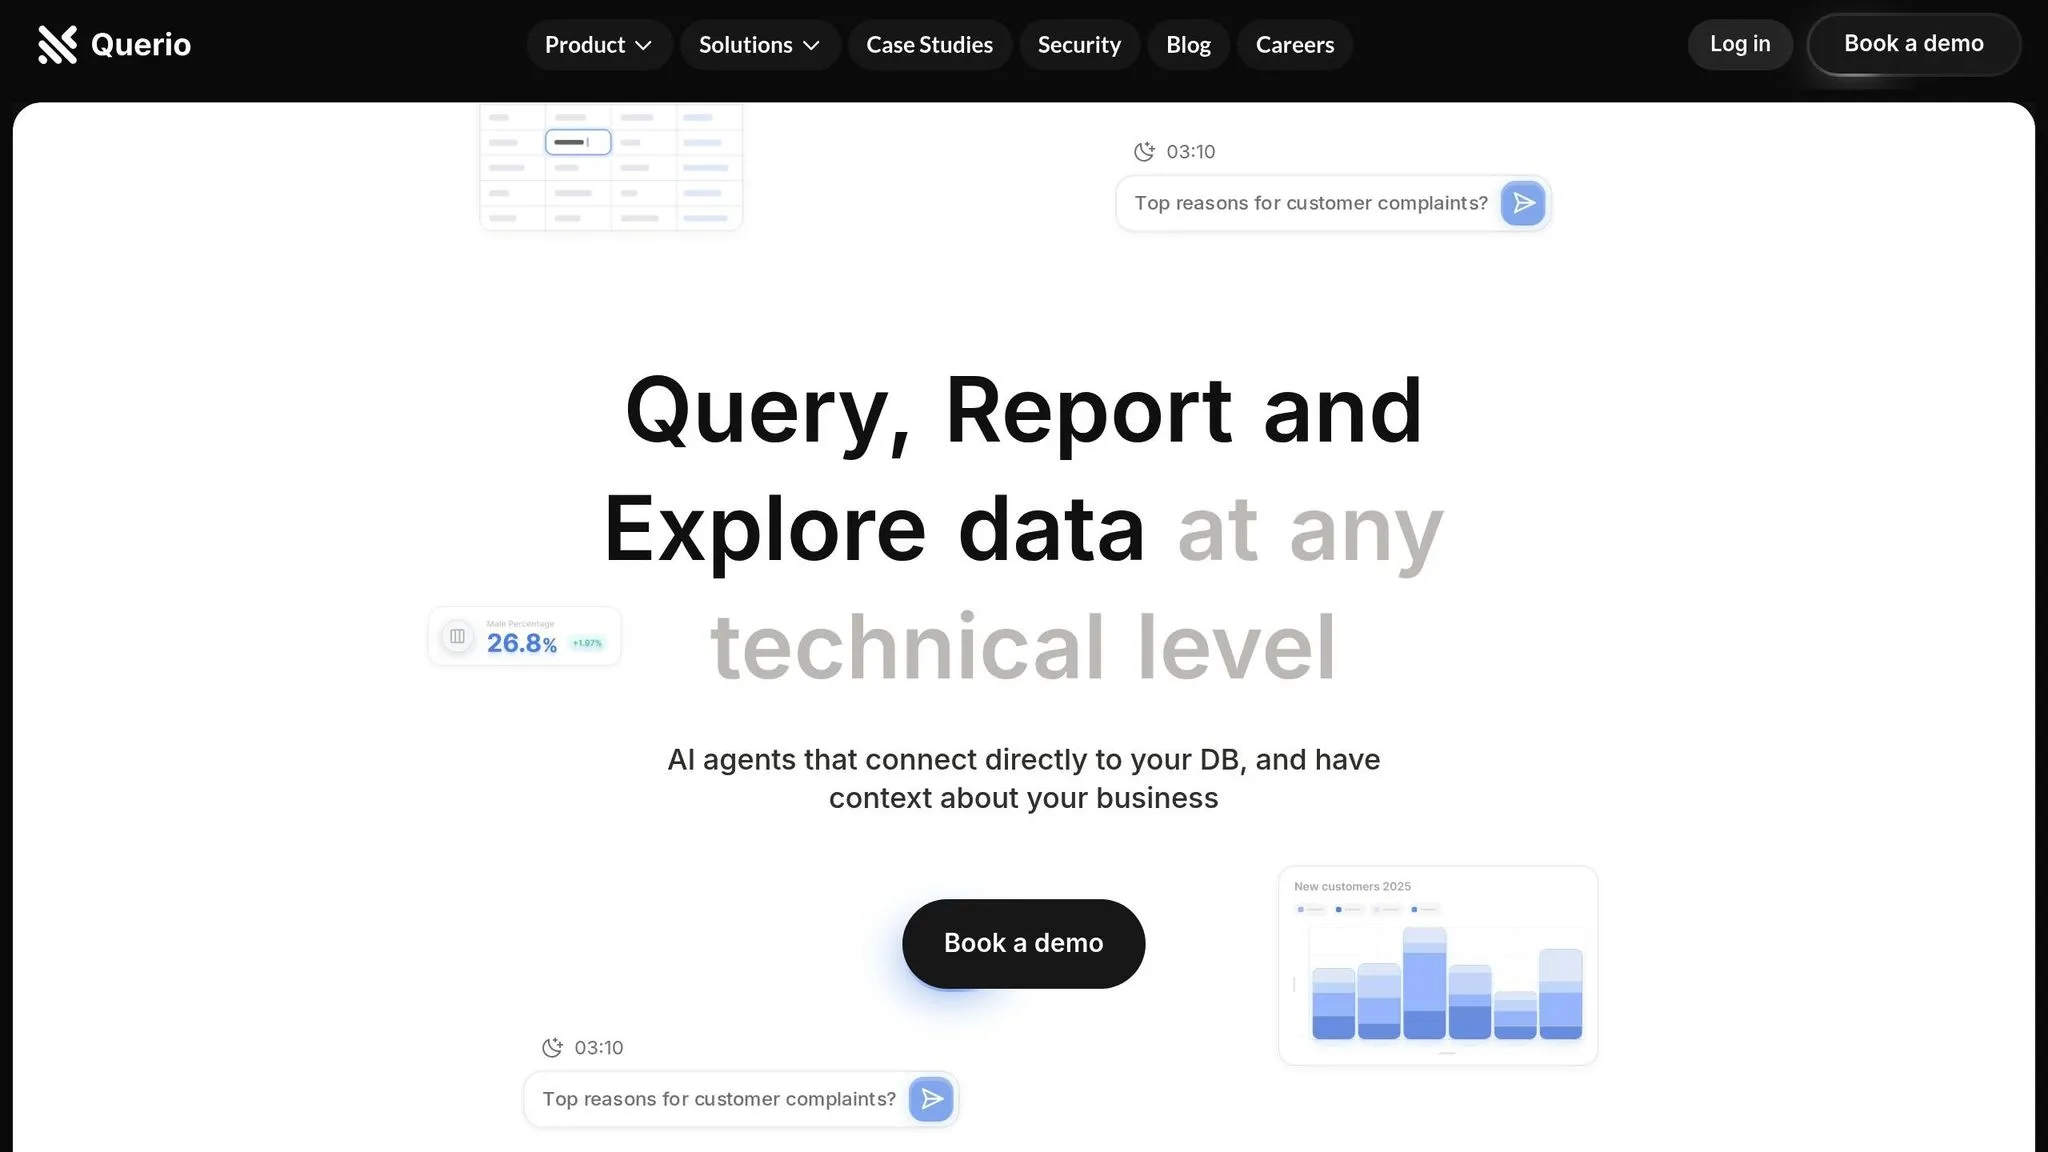
Querio is git-native analytics for data teams and their AI agents. Anyone, whatever their technical skill, can ask a question in plain English and get an answer built from real SQL and Python. Let’s take a closer look at what makes Querio stand out.
Natural Language Processing
Querio’s AI data agent answers questions typed in plain English, in the app or in Slack. It writes SQL and Python in a notebook your analysts can open, check and rerun, so nobody has to trust a black box. Answers fit your business context because the agent reads the table docs, business terms and metric definitions your data team keeps as files in a git repo.
Database Integration
Querio connects directly to major databases and warehouses, including Snowflake, BigQuery, Databricks, Redshift and PostgreSQL. Its direct database connectivity means no middleware and no data migration: queries run on live warehouse data. Data teams and their agents can build the rest of the stack in the same repo, from ETLs to dashboards, and Querio reads dbt metrics instead of keeping a second copy. However, it’s worth noting that integrations with non-database tools might be somewhat limited [2].
Visualization Features
Querio also makes the results easy to read. Any answer can be saved as a tile on a live dashboard, with charts that run on current warehouse data. Dashboards are marked experimental, team or trusted, and promoting one opens a pull request your reviewers approve, so people know which numbers they can rely on.
Collaboration Capabilities
Querio connects technical teams and business users through one set of definitions. Business users ask in plain English, data teams work in reactive notebooks, and AI agents join in too: Claude and ChatGPT through Querio's MCP server, Claude Code and Cursor through its CLI. Every one of them answers from the same definitions and sees only what its user may see, which keeps the whole organization working from the same numbers.
2. Tableau AI
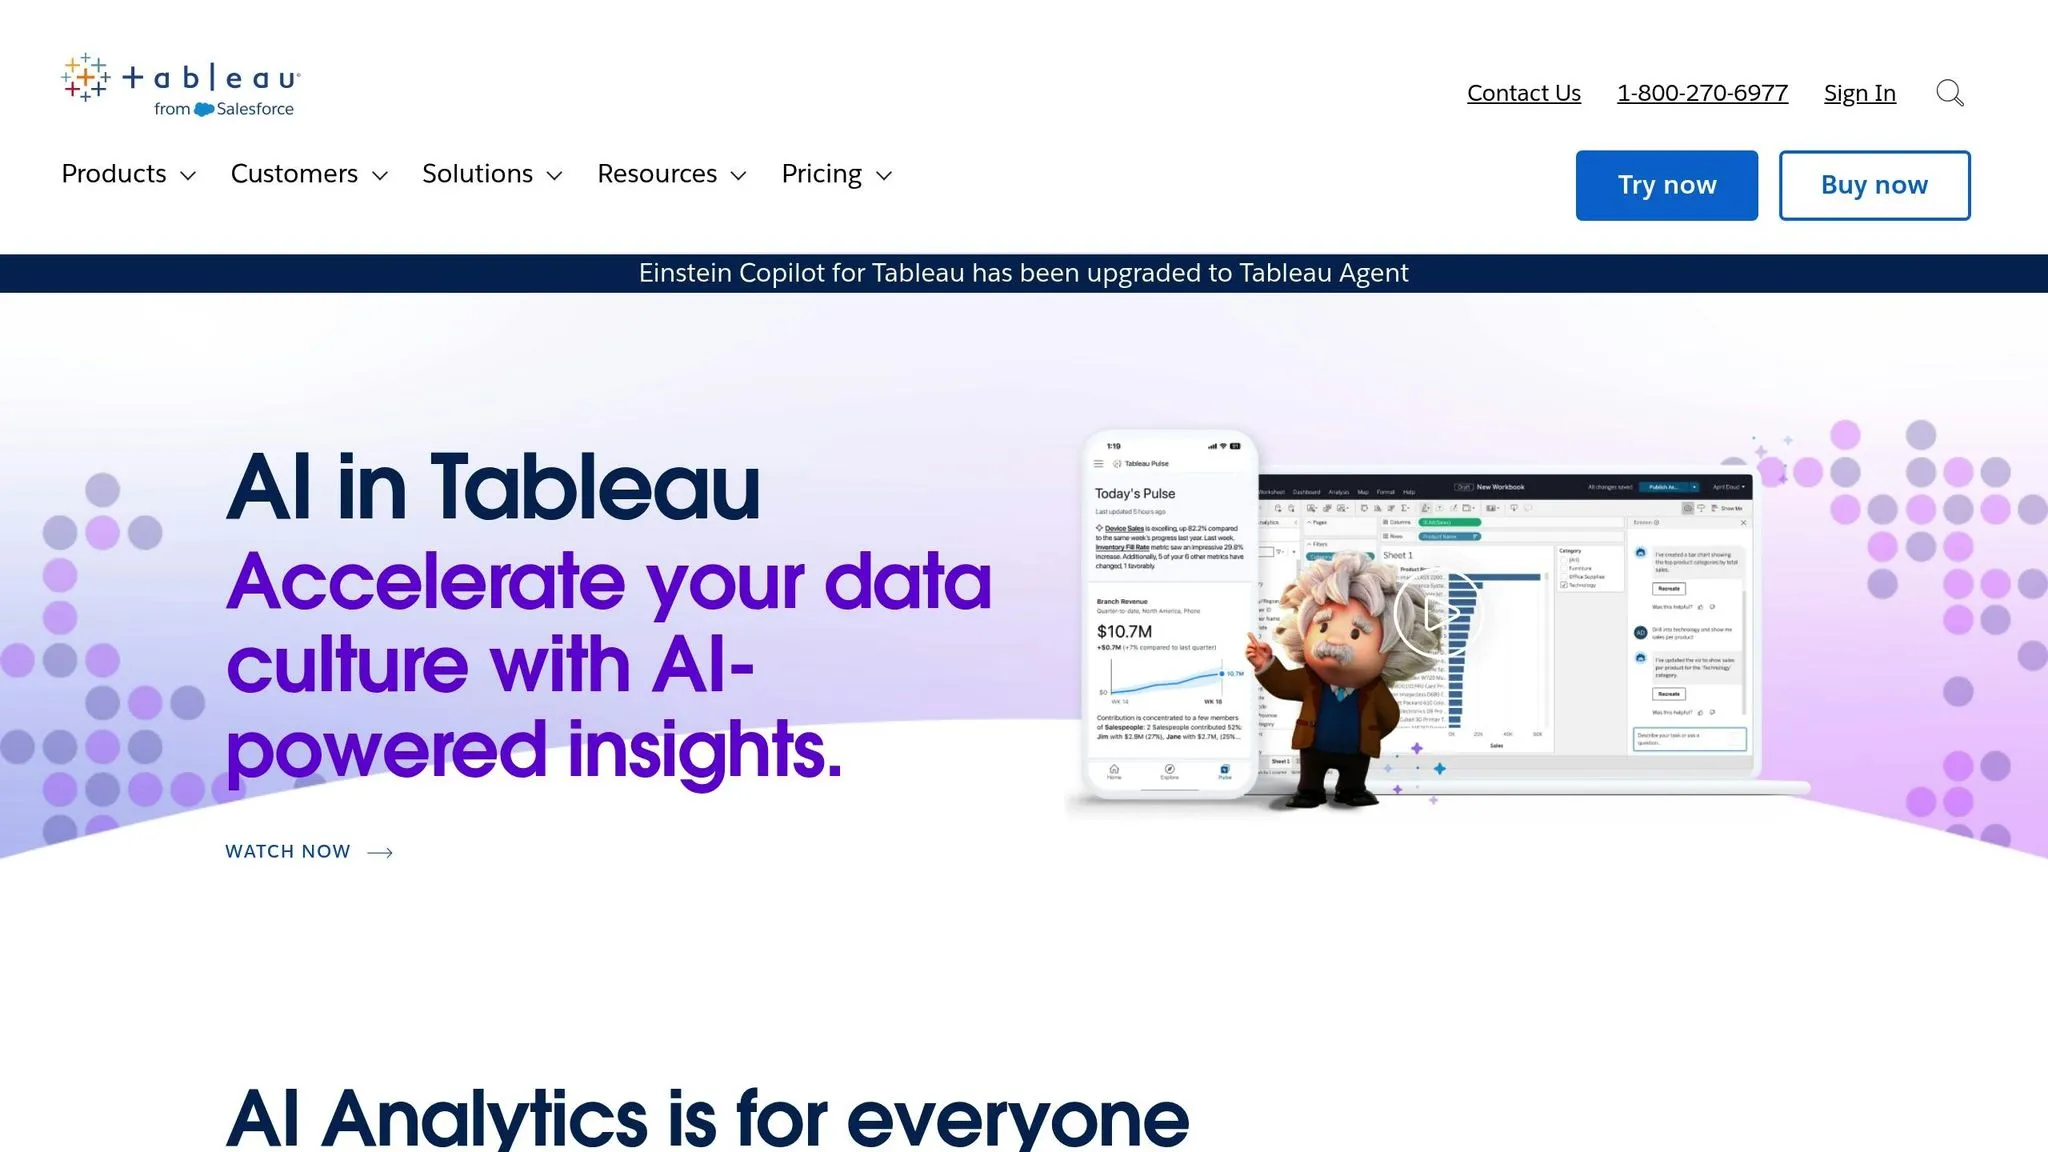
Tableau AI integrates the power of artificial intelligence with data visualization, offering tools that make analyzing data with AI easier for everyone, regardless of their technical expertise. Similar to Querio, Tableau AI translates natural language queries into actionable, data-driven insights.
Natural Language Processing
Tableau AI uses Tableau Pulse Q&A to interpret plain language and turn it into meaningful insights [4]. Its Tableau Agent feature allows users to interact with their data conversationally, making it possible to create visualizations and perform analyses without needing to write complex queries. By simplifying the process for both technical and non-technical users, Tableau AI ensures that working with data becomes more intuitive and accessible.
Database Integration
Tableau AI supports connections to a wide range of databases and file types, offering both live connections and data extracts [5][6]. While it’s versatile, there are some limitations: it doesn’t support cubes, and when blending data, it only works with the primary data source [7]. For technical teams, Tableau Agent provides the flexibility to interact with various data sources, streamlining workflows and enhancing productivity.
Visualization Features
Tableau AI excels at turning natural language queries into visually engaging stories. Its Tableau Pulse feature provides insights alongside clear, easy-to-understand explanations, making even complex data approachable for non-technical users [10]. The Explain Data tool takes this further by offering dynamic visualizations that uncover the "why" behind the numbers. Automated plain-language explanations for dashboards add another layer of clarity [9].
The Tableau Agent also suggests analytical questions based on the data, supports a variety of chart types, and enables users to create calculated fields, explain existing calculations, and filter or sort data - all through natural language input [7]. A real-world example of its impact: in August 2024, Cherry Bekaert assisted a global healthcare company in adopting Tableau Pulse. This shift from spreadsheet-based analytics to visualizations significantly improved both data quality and operational efficiency [8]. Alongside its robust visualization tools, Tableau AI encourages teamwork by making it easy to share insights across teams.
Collaboration Capabilities
Tableau AI strengthens collaboration by ensuring data insights are easy to share and understand at all organizational levels. Its automated explanations empower technical analysts to craft visualizations that business stakeholders can quickly grasp. By bridging the gap between data experts and business users, Tableau AI helps teams work together more effectively on data-driven initiatives.
3. Looker AI
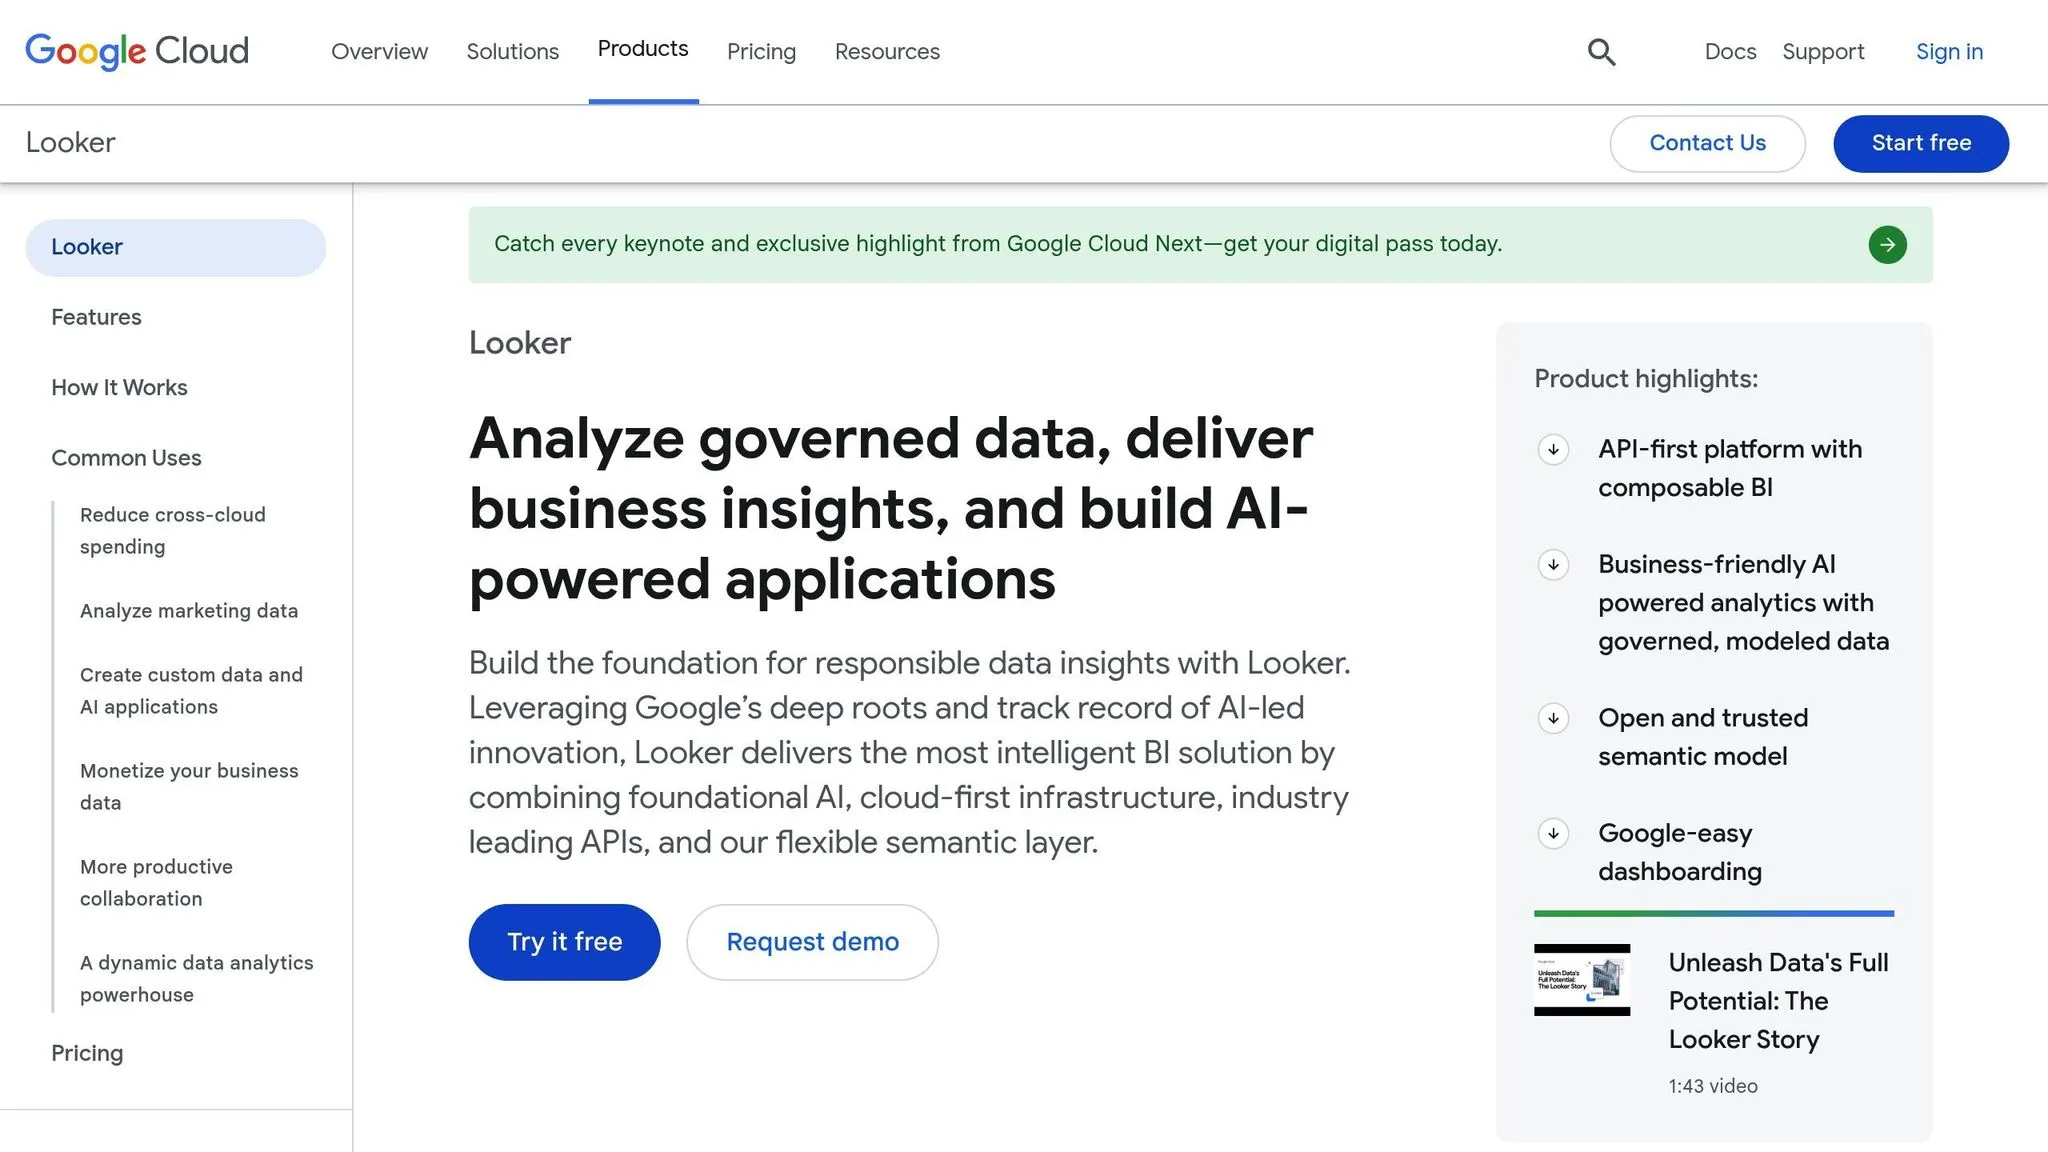
Looker AI, powered by Gemini for Google Cloud, brings advanced analytics within reach of non-technical users by enabling them to ask complex data questions in plain English [11].
Natural Language Processing
Looker AI takes natural language understanding to the next level with its Conversational Analytics feature. This tool uses natural language processing (NLP) to handle intricate, multi-part queries without requiring users to know specific database field names or set exact filter conditions [11]. For example, users can ask about sales performance or website traffic trends without needing technical expertise. The platform’s semantic layer ensures consistent metric definitions, which can reduce errors by up to two-thirds. Additionally, users can customize data agents with domain-specific knowledge, making responses even more accurate [11] [12] [13].
Another standout feature is the Code Interpreter, which translates natural language queries into Python code. This allows for advanced visualizations and calculations, making it easier to generate deeper insights [11] [12]. Administrators can boost accuracy further by setting up synonym mappings. For instance, they can configure the system to treat "revenue" as the "total_sales" field, ensuring queries are interpreted correctly [12].
Database Integration
Looker AI excels in database integration, offering seamless connectivity to a wide range of data sources. It supports transactional databases like Oracle and MySQL, as well as analytical platforms such as BigQuery, Snowflake, and Redshift [16] [17]. Its multi-cloud capabilities let organizations deploy Looker with their choice of underlying cloud databases, all without affecting the user experience [16].
The platform’s API-first design allows for the creation and customization of data applications, ensuring both scalability and performance [15]. Looker also integrates smoothly with existing data tools, enabling businesses to tap into its AI features without disrupting their current workflows. Out-of-the-box analytics, like data exploration and dashboard creation, make it easy to assemble custom segments using first-party data [15] [17].
Visualization Features
To make data insights more accessible, Looker AI offers dynamic dashboards with an easy-to-use drag-and-drop canvas for report creation [15]. The Visualization Assistant lets users create custom visuals through natural language commands, making the process both intuitive and efficient [19].
Looker provides a rich library of visualizations and templates, granular design controls, and real-time collaboration features [19]. It uses Vega-lite to support a wide variety of chart types, allowing users to create detailed and diverse analytical visuals [11]. These interactive visuals help teams uncover patterns and insights quickly [18]. Furthermore, users can design tailored reports and visuals that align with their specific business goals [17]. Looker Studio’s collaborative dashboards add another layer of interactivity, enabling teams to explore and understand business metrics and trends in real time [15].
Collaboration Capabilities
Looker AI fosters teamwork by offering real-time sharing and interactive reporting features. Its semantic layer ensures all team members work with consistent definitions and metrics, minimizing confusion across different departments [12] [14]. Acting like a 24/7 data analyst, the Conversational Analytics feature empowers business users to explore data independently, reducing reliance on technical teams and helping build a data culture without a dedicated data department. Its ability to process complex, natural language queries makes collaboration easier, allowing teams with varied skill levels to make data-driven decisions together.
Platform Comparison: Strengths and Weaknesses
Choosing the right data analytics platform means weighing each option's strengths and limitations. By understanding these differences, you can align your choice with your specific needs, budget, and technical setup. Below is a breakdown of key features and challenges for three leading platforms, followed by an analysis to help guide your decision.
Querio: Accessibility Redefined
Querio shines for its user-friendly design and accessibility, letting anyone, whatever their technical skill, ask questions of their data in plain English. Its AI agent removes the steep learning curve of most analytics tools, and the SQL and Python behind each answer stay open for analysts to check.
Querio's natural language querying and notebooks make it a strong choice for teams that want simplicity and speed. Because definitions, dashboards and notebooks live as files in a git repo the team owns, and changes go through pull requests, the data team keeps control as more people and agents use it. Pricing has no per-seat fees, with unlimited users and connections on every plan.
Tableau AI: Advanced Visualizations and Integration
Tableau AI is a standout for visualization capabilities and seamless integration with the Salesforce ecosystem. For organizations already using Salesforce, Tableau AI enhances workflows with intuitive drag-and-drop tools and the ability to handle large datasets effortlessly. For example, a regional bank reported a 40% increase in self-service analytics, while a consumer goods company reduced report creation time by 87.5% [9].
However, its pricing structure - $115/user/month for the Creator plan - can be a barrier for smaller businesses. Additionally, while Tableau AI offers enterprise-grade features, customization options are somewhat limited, and deploying it across a large organization can involve significant costs.
Looker AI: Customization and Google Cloud Integration
Looker AI stands out for its deep integration with Google Cloud and extensive customization options via LookML. Supporting over 1,000 data sources through pre-built connectors, Looker AI ensures data consistency with its semantic layer, which has improved accuracy by up to 66% [18]. St John Knits, for instance, achieved complete data visibility without expanding its team, with CEO Andy Lew noting:
"The efficiency and insights we've gained are remarkable."
However, Looker AI's pricing model can be complex. The Standard Edition starts at $5,000 per month, with setup costs ranging from $5,000 to $20,000. Basic plans also come with limited support, which could be a drawback for smaller teams.
Comparison Table
| Platform | Key Strengths | Key Limitations |
|---|---|---|
| Querio | • Natural language querying for all skill levels • Direct database connectivity • Reactive notebooks with inspectable SQL and Python • Definitions in your git repo, changed through PRs • MCP server and CLI for AI agents |
None noted |
| Tableau AI | • Sophisticated visualizations with drag-and-drop interface • Seamless Salesforce integration • Efficient large dataset handling • 33% boost in insights-driven decisions |
• High cost at $115/user/month for Creator plan • Limited customization options • Complex enterprise deployment costs |
| Looker AI | • Tight Google Cloud integration • Extensive LookML customization • Strong semantic layer for consistency • Multi-platform compatibility |
• Complex pricing model • $5,000/month Standard Edition cost • Setup fees of $5,000–$20,000 • Limited support for basic plans |
Security and Collaboration Features
Security and collaboration also vary across these platforms. Tableau AI relies on the Einstein Trust Layer to ensure data privacy, while Looker AI uses Google Cloud IAM for secure single sign-on and private networking. Both platforms enhance teamwork, with collaboration tools leading to a 36% productivity boost.
Making the Right Choice
Ultimately, your decision will depend on your organization's priorities. If accessibility, ease of use and AI agents working from reviewed definitions are top priorities, Querio might be the best fit. For teams that need advanced visualizations and enterprise-grade features, Tableau AI is worth considering, despite its higher costs. Meanwhile, organizations that require deep customization and tight Google Cloud integration may find Looker AI more suitable.
When deciding, think about your current infrastructure, your team's technical expertise, and your long-term data goals. Each platform offers unique advantages that can shape how effectively your organization transforms raw data into actionable insights.
Conclusion
Our review of Querio, Tableau AI, and Looker AI highlights how natural language querying tools are breaking down technical barriers. By replacing complex SQL queries with conversational methods, these tools make analytics accessible to everyone, not just technical teams.
The impact on business intelligence workflows is clear. Take Bank of America’s assistant, Erica, for instance - it serves 19.5 million users, processes 100 million requests, reduces call center demand by 30%, and increases mobile engagement by 25% [1]. Similarly, KPMG's Ignite platform slashes document processing time by 60% and enhances audit accuracy by 40% [1].
These examples emphasize the importance of selecting natural language interfaces for data that align closely with your business needs. Choose solutions that integrate smoothly with your existing data systems and understand the unique context of your operations [21].
Security and scalability should remain top priorities. Opt for platforms with robust features like role-based access controls, audit trails, and compliance with data protection standards [21]. Additionally, ensure the system can handle multi-user environments and adapt as your organization grows.
To get started, focus on a specific use case to test the system’s effectiveness. Gradually scale its application while tailoring it to your business language and maintaining feedback loops to encourage adoption [22].
FAQs
How is Querio's natural language processing better than basic keyword searches for data queries?
How Querio Enhances Data Queries with NLP
Querio's natural language processing (NLP) reads both the intent and context of your questions. Traditional keyword searches depend on exact matches and often return irrelevant or confusing results. Querio's agent reads conversational language and checks it against your team's context files: table and column docs, business terms and metric definitions kept in a git repo.
The agent then writes real SQL and Python in a notebook that analysts can open, check and rerun. That makes querying data straightforward for people without a technical background, while the data team can still see exactly how each answer was built. Agents can keep a dataframe and build on the last result, so follow-up questions don't start from scratch.
What challenges might arise when using Querio to integrate with non-database tools, and how could they affect my business?
Using Querio alongside non-database tools can come with a few hurdles that might affect your business operations. One of the most common issues is the development of data silos. When information from various tools isn't connected, it becomes challenging to get a full picture of your data. This can lead to inefficiencies, such as the need for manual data reconciliation, increased operational costs, and slower decision-making processes.
Another challenge lies in achieving real-time analytics. Without seamless integration, gaining timely insights becomes difficult, which can hinder your ability to react swiftly to market changes. This delay in accessing critical information could impact your competitiveness. Overcoming these obstacles is essential to ensure smooth workflows and keep up with the demands of today's fast-moving business landscape.
How does Querio help teams collaborate on data and make better decisions?
Querio lets teams ask questions of their data using plain language queries, in the app or in Slack. You don’t need to be a technical expert to explore insights. Team members from any department can dig into the data themselves, which speeds up decisions and cuts down on requests to the data team.
Querio queries live warehouse data, and every answer uses the same metric definitions, stored as files in a git repo the data team owns. People and AI agents like Claude and ChatGPT work from those same definitions, so everyone sees the same numbers. Changes to them go through pull requests, so the data team stays in charge of what the business relies on.