Business Intelligence
How to Create a Governed Metrics Layer for Your SaaS
Standardize SaaS KPIs by defining metrics, centralizing formulas, enforcing governance, and using a semantic layer for consistent, secure reporting.
In SaaS, inconsistent metrics across teams can lead to disputes and poor decisions. A governed metrics layer solves this by standardizing how key performance indicators (KPIs) like MRR, CAC, and churn are defined, calculated, and used across the organization. This ensures everyone works from the same trusted data, cutting down errors, improving efficiency, and enabling smarter decisions.
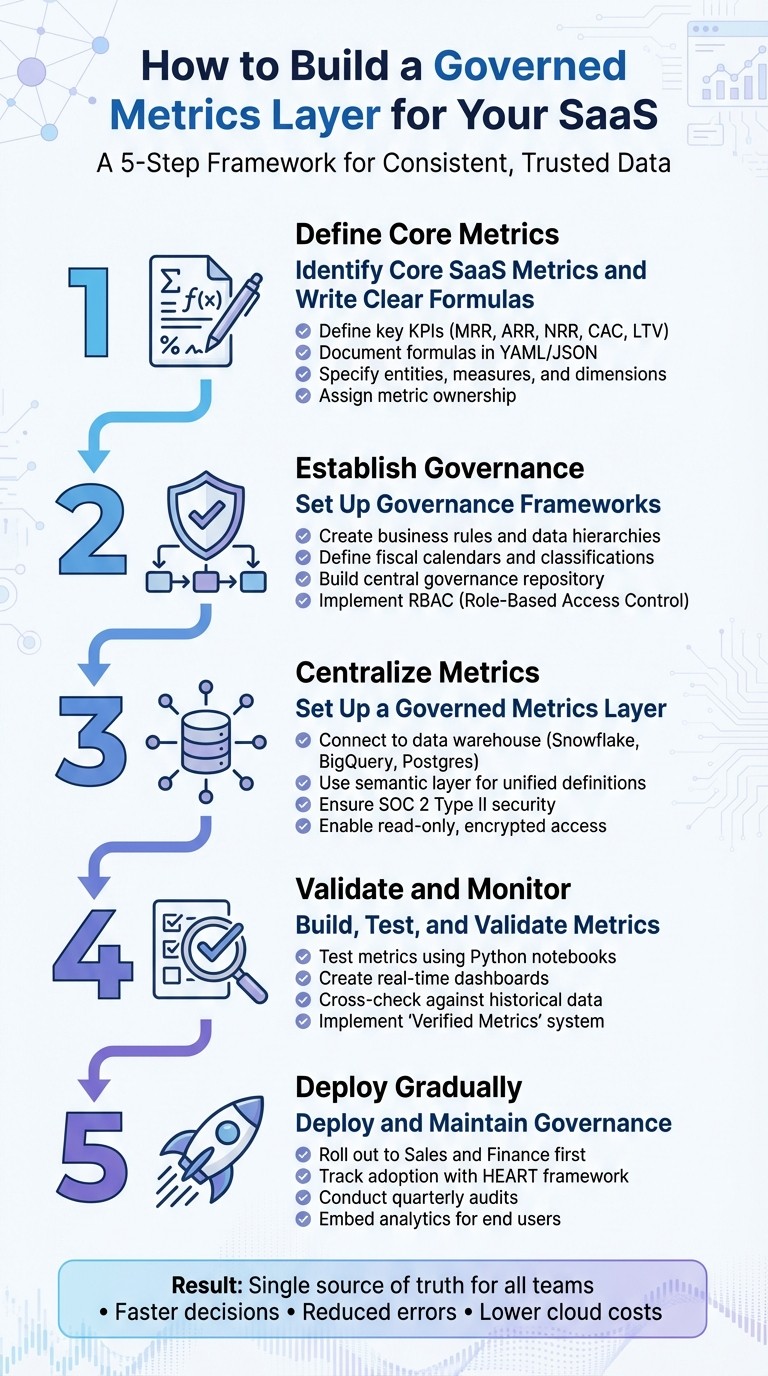
Here’s how to build one:
Define Core Metrics: Identify key SaaS KPIs (e.g., MRR, ARR, NRR) and document their definitions and manage metrics and dimensions clearly.
Establish Governance: Set rules, ownership, and access controls to ensure consistency and prevent errors.
Centralize Metrics: Use tools like dbt or Querio to store metric definitions in a unified layer for SaaS analytics for consistent use across all platforms.
Validate and Monitor: Test metrics, track adoption, and audit regularly to maintain accuracy and relevance.
Deploy Gradually: Roll out to key teams first, then expand organization-wide with proper training and support.
5-Step Process to Build a Governed Metrics Layer for SaaS
Semantic Layer vs. Metric Layer in Business Intelligence [English]
Step 1: Identify Core SaaS Metrics and Write Clear Formulas
Pinpoint the key performance indicators (KPIs) that drive your SaaS business forward, and define them in a way that’s clear and consistent across all teams. The goal? Eliminate confusion by creating straightforward formulas everyone can understand and use.
Core Metrics for SaaS Growth
Start with the metrics that directly impact your growth and financial health. Monthly Recurring Revenue (MRR) and Annual Recurring Revenue (ARR) are your foundational metrics - they reflect stability and growth potential. To calculate ARR, multiply MRR by 12. Define MRR as the payment amount divided by the subscription term, while accounting for annual prepayments or multi-year contracts.
Net Revenue Retention (NRR) is critical for understanding how well you grow revenue from existing customers. Calculate it as:
(Starting MRR + Expansion Revenue – Contraction – Churn) ÷ Starting MRR.
An NRR above 100% indicates growth. Meanwhile, Gross Revenue Retention (GRR) measures retention without factoring in upsells or expansions, giving you a pure retention rate.
Efficiency metrics like the LTV:CAC ratio help you evaluate your unit economics. The benchmark? A ratio of 3:1 - your customer lifetime value (LTV) should be three times your customer acquisition cost (CAC). Another key metric is the CAC Payback Period, which shows how long it takes to recover acquisition costs. To calculate, divide total sales and marketing spend by new MRR generated.
For engagement, track DAU/MAU ratios - daily active users divided by monthly active users - to gauge product stickiness. But be specific about what "active" means. Does a simple login count, or does the user need to complete a core action?
Once you’ve identified these metrics, document them in a uniform way to avoid misinterpretation and ensure consistency across teams.
How to Document Metric Definitions
Use a version-controlled format like YAML or JSON to document your core metrics. This ensures changes are tracked and definitions remain accessible. You can even ask data questions in Slack to retrieve these metrics instantly.
Each metric should include:
A unique name (e.g.,
customerRetentionRatein camelCase).A clear description.
A dashboard label.
A type (simple, ratio, or derived).
Specify granularity (e.g., daily, weekly, monthly) and units (e.g., dollars, count, percentage) to eliminate ambiguity. As Natalie Fedorenko from PROANALYTICS.TEAM explains:
"SaaS is always about nuances... The formulas are usually simple, but defining their components often requires extensive discussion, alignment, and communication within the team."
Break down each metric into three components:
Entities: The nouns, like customers, subscriptions, or transactions.
Measures: The verbs, such as sum, count, or average.
Dimensions: The adjectives, like region, plan type, or cohort.
Define aggregation rules clearly. Indicate whether the metric is a direct measure, a ratio, or a derived calculation. For time-based metrics, use "dunders" (double underscores) to specify time buckets, such as metric_time__month.
Assign ownership for each metric to someone responsible for maintaining and updating its definition as business rules evolve. Implement a review process for adding new metrics to your central library - this avoids duplicates and keeps definitions consistent. Even small differences in how metrics are defined can lead to major reporting gaps, so it’s worth investing the time upfront to get this right.
Step 2: Set Up Governance Frameworks
Once you've documented your core metrics, the next step is to establish rules and structures that keep everyone on the same page. A governance framework outlines how data should be organized, who is responsible for it, and what standards apply across your organization.
Creating Business Rules and Data Hierarchies
To start, focus on building consistent dimensions and hierarchies across your tools and teams. For instance, geographic hierarchies - like organizing locations from Country → State → City - ensure reports are consistent whether someone is viewing a dashboard or pulling data for analysis. The same logic applies to product categories, organizational structures, and customer segments.
For SaaS companies, fiscal calendars are a critical piece of the puzzle. If your fiscal year doesn’t align with the calendar year, define this upfront. Specify when your fiscal year begins (e.g., February 1st), how quarters are calculated, and how this affects time-based metrics like ARR growth or quarterly retention. Aligning on fiscal calendars early avoids confusion and ensures accurate reporting.
It’s also essential to define criteria for classifying data. For example, what qualifies as active, churned, trial, or beta? Similarly, document when revenue is officially recognized - whether it’s at contract signing, upon payment, or when the service is delivered. These decisions ensure consistency in calculations. A real-world example: in 2025, Kiwi.com revamped its governance by consolidating thousands of assets into just 58 discoverable data products using Atlan. This shift reduced their central engineering workload by 53% and boosted data-user satisfaction by 20% [Atlan Case Studies, 2025].
Once your business rules are standardized, the next step is centralizing these definitions for consistent use across the organization.
Creating a Central Governance Repository
Standardized rules and hierarchies are the backbone of a central repository, where all metric definitions and business rules come together. Centralizing these definitions helps eliminate discrepancies caused by tool-specific calculations. When metric definitions are scattered across individual BI tools, teams often end up with slightly different versions of the same calculation. By moving these definitions into a central modeling layer - like a dbt project or semantic layer - you ensure that any updates automatically flow through all downstream applications. This approach creates a unified metrics layer vs. semantic layer where everyone speaks the same data language.
Centralize not just formulas, but also business definitions, logical rules, and data lineage. This way, users can understand what each metric represents, why it’s calculated a certain way, and where the data originates. Assign ownership for each metric to maintain accuracy, and implement RBAC (Role-Based Access Control) to limit who can make changes, reducing errors and safeguarding sensitive data.
"Moving metric definitions out of the BI layer and into the modeling layer allows data teams to feel confident that different business units are working from the same metric definitions, regardless of their tool of choice." - dbt Labs
Organize metrics into intuitive hierarchies based on business units or teams instead of listing them in a flat structure. Group dimensions by their source entity - such as user__country or product__category - so non-technical users can easily navigate the data model. This makes it simpler for teams to find the metrics they need without constantly relying on the data team for clarification. For example, Austin Capital Bank used this strategy with Snowflake, enabling faster product launches while maintaining security through advanced masking policies for sensitive data.
Step 3: Set Up a Governed Metrics Layer in Querio
Once you've established a governance framework, the next step is to use Querio to enforce and operationalize your metric definitions effectively.
Connecting Querio to Your Data Warehouse
Querio integrates seamlessly with platforms like Snowflake, BigQuery, and Postgres, offering encrypted, read-only access to your data. This ensures that your data stays secure within your warehouse while being queried in real time. With Querio, there's no need for ETL processes, data duplication, or additional infrastructure. During setup, the platform automatically maps your database, establishing it as the single source of truth for your organization from day one.
The read-only access is a key feature for maintaining security. Querio can query your data but cannot alter or delete anything within your warehouse. For instance, in 2024, Lumen adopted Querio and cut their sales summary process from 4 hours to just 15 minutes - a time savings of 93.75% - all while retaining complete control over their data.
Using Querio's Semantic Layer for Governance
Querio's semantic layer brings your governance framework to life by serving as a centralized hub where data teams can define business logic once and apply it universally. This layer allows you to map table relationships, document metric formulas (like Active User or MRR), and create a shared glossary of terms. Whether someone is asking a question in plain English or building a dashboard, Querio uses this governed context to ensure calculations are consistent and accurate.
This approach eliminates the issue of inconsistent metrics across tools. For example, if you define Churn Rate in the semantic layer, it will be calculated the same way whether a product manager is querying the AI or the CFO is analyzing a dashboard.
Next, you'll focus on ensuring your governed metrics layer remains secure and compliant as it becomes fully operational.
Security and Compliance with Querio
Querio is SOC 2 Type II certified, meaning it has undergone rigorous external audits to meet high standards for data security and privacy. It also includes enterprise-grade protections, such as a strict AI privacy policy that guarantees your data and queries will never be used to train large language models.
The platform provides granular access controls, enabling features like row-level security to restrict data visibility based on user permissions, and column masking to protect sensitive information like email addresses or payment details. Additionally, audit logs track every query and data access event, offering full transparency for compliance monitoring. These safeguards not only protect your business but also help you meet regulatory requirements like CCPA, ensuring that your governed metrics layer remains secure and reliable for SaaS decision-making.
With Querio in place, you’re ready to build, test, and validate the metrics your teams need to make informed decisions.
Step 4: Build, Test, and Validate Metrics
Before rolling out your metrics across teams, it's crucial to define and validate them. This step ensures the metrics from your governed layer provide accurate, real-time insights that everyone can rely on.
Defining and Testing Metrics in Querio
Querio's semantic layer simplifies metric management by allowing you to define each metric once with a unique name, clear description, type, and formula. For example, when you define "Churn Rate" in this layer, it ensures that every dashboard, AI query, and analytics view calculates it consistently.
To build and test metrics, leverage Python notebooks. These tools let you write SQL or Python code to validate calculations, compare results over different timeframes, and review the underlying logic. This step ensures your metrics are not only accurate but also aligned with your business rules.
Querio's natural-language interface adds another layer of validation. You can ask questions about your metrics to confirm the AI interprets your governance rules correctly. Additionally, inspecting the auto-generated SQL helps ensure the calculation logic matches your documented formulas, providing transparency throughout the process.
Once testing is complete and metrics are validated, you can use dashboards to monitor their performance in real-time.
Monitoring Metrics and Dashboards
After defining your metrics, create dashboards in Querio to track key performance indicators (KPIs) such as MRR growth, customer acquisition costs, or active users. These dashboards pull live data directly from your warehouse, giving stakeholders access to the most up-to-date figures.
To maintain accuracy, schedule automated reports and cross-check new metrics against historical data. Introduce a "Verified Metrics" system to highlight critical KPIs with a verification icon, signaling their reliability. Regularly audit your metrics library to remove outdated definitions and ensure your governance layer reflects current business goals. This ongoing maintenance keeps your metrics relevant and trustworthy for decision-making.
Step 5: Deploy and Maintain Governance
Rolling out a governed metrics layer across your organization is just the beginning. To ensure it continues to deliver value, you’ll need a solid deployment strategy and ongoing maintenance. A phased approach works best, as it minimizes disruptions and helps teams transition more smoothly.
Rolling Out Across Teams
Start with core teams like Sales and Finance - departments that depend heavily on standardized metrics and stand to benefit the most from consistency. Assign key roles, such as a project manager and an enterprise architect, to oversee the rollout. Their job is to coordinate efforts, align metrics with business goals, and troubleshoot any hiccups in a controlled setting before expanding to other teams like Marketing, Product, and Customer Success.
To keep things organized, form a cross-functional governance committee. This group should include representatives from IT, Finance, and department leaders. Their role is to set priorities, allocate resources, and ensure that every team understands how to access and use the governed metrics. As the system gains traction, automate provisioning workflows to streamline access. For example, new employees can automatically gain access during onboarding, while departing staff lose access during offboarding - keeping everything secure and efficient.
Once teams are up and running, the next step is to monitor how well the governance framework is working.
Tracking Metrics Adoption and Governance Performance
Use the HEART framework to track adoption and performance. This includes:
Happiness: Measure user satisfaction.
Engagement: Look at how often metrics are queried.
Adoption: Track activation rates.
Retention: Monitor repeat usage.
Task Success: Evaluate how quickly users gain insights.
In addition, monitor system health by tracking uptime, support requests, and cost per user. These metrics will help you identify whether the governance system is adding value or creating unnecessary friction.
Set up automated alerts to catch potential issues early. For example, spikes in usage, unusual query patterns, or threshold breaches could signal technical errors or unauthorized access. Conduct quarterly audits to identify and address inactive or outdated metrics, ensuring the system stays relevant and efficient.
The final step? Make it easier for end users to access customer-facing analytics.
Embedding Governed Analytics for End Users
Querio’s embedded analytics tools allow you to bring governed metrics directly to your users - whether they’re customers or internal stakeholders - without requiring them to log into a separate BI tool. By building on the standardized metric definitions you’ve already established, this approach ensures consistency across all platforms. Whether users are exploring dashboards in your SaaS app or asking natural-language questions, they’ll always get insights based on the same trusted data.
Use Role-Based Access Control (RBAC) to manage who can modify metric definitions. This prevents accidental changes that could lead to confusion or disruptions. Additionally, maintain an audit trail to track configuration changes and their impact. This transparency not only helps troubleshoot problems but also makes it easier to roll back any problematic updates.
Conclusion: Building Better SaaS Decisions with Governed Metrics
When it comes to making smarter decisions in the SaaS world, a governed metrics layer can be a game-changer. By centralizing metric definitions, documenting formulas, implementing governance frameworks, and using tools like Querio, you create a single, reliable source of truth. This eliminates the confusion and conflicting reports that often plague SaaS organizations.
The advantages become evident over time. With standardized metrics, decisions across departments - whether in Finance, Product, or Customer Success - become quicker and more aligned. Non-technical team members can access accurate data without needing to write SQL or constantly lean on data teams. Plus, by optimizing queries, you can reduce cloud costs and avoid redundant analysis, ensuring everyone works from the same playbook when it comes to business performance.
This approach strikes a balance between accuracy and flexibility, allowing your organization to confidently explore consistent metrics. Considering that over 61% of organizations rely on four or more top business intelligence tools, having consistent metric definitions is essential to keeping teams aligned across platforms. But the real benefit isn’t just about cutting costs - it’s about enabling faster, more confident decision-making by ensuring your teams trust the data in front of them.
The key is to start small, improve as you go, and actively maintain your governance framework. The governed metrics layer you establish today will serve as the backbone for every important decision you make in the future, helping your organization stay agile and ready to adapt to market changes.
FAQs
How does a governed metrics layer help SaaS teams make better decisions?
A governed metrics layer helps ensure that every team in a SaaS organization operates with consistent, accurate, and dependable data by establishing a single source of truth for metric definitions. This eliminates the chaos caused by conflicting reports and allows teams to access trusted metrics instantly.
When metrics are standardized, decisions can be made more quickly and with greater confidence, as everyone is relying on the same reliable data. This not only streamlines collaboration but also raises the quality of decision-making throughout the organization.
What are the best tools for managing and standardizing SaaS metrics?
To keep SaaS metrics consistent and manageable, organizations can rely on tools that centralize metric definitions and align teams on shared logic. One standout choice is the dbt Semantic Layer, which lets data teams define metrics in version-controlled YAML files. This ensures everyone - from finance to product - bases decisions on the same calculations for metrics like revenue or churn rate. Plus, these definitions integrate smoothly into BI tools and dashboards, making workflows more efficient.
Other tools worth considering include CastorDoc, which serves as a centralized hub for KPI definitions with built-in governance features, and AtScale’s Enterprise Metrics Store, designed to standardize calculations across both BI and machine learning platforms. For SaaS teams focused on product experimentation, Statsig provides a metrics library tailored for feature-flag analytics and testing. Meanwhile, Datadog supports custom-metrics governance across infrastructure and business layers, and Kyligence combines AI-driven modeling with a centralized KPI catalog, integrating seamlessly with Snowflake.
With these tools, SaaS teams can work from consistent and auditable metrics, whether they're tracking $12,345.67 in revenue or monitoring a 2.3% monthly churn rate.
How can I secure and ensure compliance for a governed metrics layer?
To create a secure and compliant metrics layer, start by working closely with both business and IT teams to establish clear security and regulatory policies. These might include frameworks like GDPR, CCPA, or SOC 2. The business team identifies the compliance requirements, while the IT or data engineering team translates them into actionable controls, such as role-based access, encryption, and audit mechanisms.
Centralizing metrics within a semantic layer and connecting them to a metadata catalog boosts traceability and compliance. Assigning each metric an owner, glossary term, and lineage graph ensures transparency, tracking the journey from raw data to final KPIs. Tools like sensitive data scanners and automated validation rules can flag protected fields and ensure consistent metric definitions. This approach creates a secure and auditable system, allowing SaaS teams to confidently share metrics while safeguarding sensitive data.
Related Blog Posts