Business Intelligence
Metrics Layer vs Semantic Layer: What’s the Difference?
Compare metrics and semantic layers: when to use each, how they handle data, and why combining them delivers faster reports and consistent governance.
Metrics layers and semantic layers solve a common problem: inconsistent data definitions across teams. They help ensure everyone in your organization is working with the same numbers, but they serve different purposes:
Metrics Layer: Focuses on defining and storing KPIs (like revenue or churn rate). It pre-calculates and stores results for fast access, making it ideal for historical tracking and time-series analysis.
Semantic Layer: Acts as a translator between raw data and business-friendly terms. It dynamically generates queries on-demand, ensuring consistent definitions and simplifying data access without storing results.
Key Difference: Metrics layers store pre-calculated data for speed, while semantic layers translate queries in real-time for flexibility. Many organizations use both for a balanced approach to data governance and accessibility.
Quick Comparison
Aspect | Metrics Layer | Semantic Layer |
|---|---|---|
Focus | KPIs and calculations | Translating data into business-friendly terms |
Data Handling | Stores pre-calculated metrics | Virtual, no data storage |
Primary Use | Historical tracking, speed | Consistent, on-demand queries |
Best For | business intelligence reporting tools, multiple data sources | Centralized data governance |
Choosing the right layer - or a hybrid approach - depends on your organization's data structure and goals.
Metrics Layer vs Semantic Layer: Key Differences Comparison Chart
What is a Metrics Layer?
Metrics Layer Definition
A metrics layer serves as the backbone for consistent and reliable analytics by centralizing KPI definitions. It essentially translates business metrics into SQL queries that run on a data warehouse, ensuring everyone gets the same results. For instance, if you're calculating "monthly recurring revenue", the outcome will remain consistent no matter which department or tool accesses it.
Here’s the key difference: while a semantic layer focuses on bridging business terms with database structures, a metrics layer goes a step further. It stores the calculation logic, which speeds up time-series analysis and ensures consistency over time. This is especially useful for tracking historical trends, where maintaining consistent snapshots is crucial - even when the raw data changes. The metrics layer’s effectiveness hinges on well-defined components that keep everything running smoothly.
Core Components of the Metrics Layer
A metrics layer is built on three main elements:
Metric definitions: These outline the exact formulas and data sources for each KPI. For example, defining "Customer Retention Rate" would involve specifying the time frame and customer segments to include in the calculation.
Dimensions: These are the categories you use to break down metrics, such as regions, product lines, customer segments, or time periods. Dimensions let users drill into the data without writing custom queries.
Transformation rules: These handle the calculations and aggregations that turn raw data into meaningful insights. Whether it’s summing up transaction amounts, calculating averages, or running more advanced statistical operations, these rules ensure the metrics are accurate.
One standout feature of a metrics layer is that it works across different tools. With over 61% of organizations using four or more BI tools - and 25% using 10 or more - this tool-agnostic approach is critical. Without it, each tool would have its own metric definitions, creating inconsistencies. A centralized metrics layer ensures that whether your finance team uses Excel, your marketing team prefers Tableau, or your executives rely on PowerBI, everyone is working with the same governed metrics.
Metrics Layer Use Cases
These core elements make metrics layers incredibly versatile across departments. A great example comes from Bilt Rewards in 2025. They centralized their metric definitions to create personalized embedded analytics tools for their B2B partners. By consolidating previously scattered entity relationships and metrics, they slashed analytics costs by 80% and significantly improved data reliability and trust.
"By centralizing our entity relationships in the dbt Semantic Layer, where all of our data transformations already live, we could easily create visualizations in our B2B product. We delivered an improved data experience for our B2B partners by eliminating a step in our process, decreasing our data costs by 80%, and increasing reliability and trust." - Ben Kramer, Senior Director of Analytics, Bilt Rewards
Metrics layers are especially valuable for RevOps and Finance teams, which depend on precise calculations for metrics like customer acquisition cost, lifetime value, churn rate, and revenue recognition. A 2022 study revealed that 97% of employees in large manufacturing and CPG companies aren’t “data practitioners” but still need to make decisions based on data. By providing access to verified KPIs, a metrics layer makes it easier for non-technical users to work with accurate data - no need to understand the complexities of SQL or data transformations.
What is a Semantic Layer?
Semantic Layer Definition
A semantic layer bridges the gap between raw data and business understanding by translating technical terms into familiar business language. For instance, it converts database fields like "customer_id" and "order_total_amt" into more intuitive terms such as "Customer" and "Revenue."
Its primary goal is to provide a single source of truth for accessing data. This ensures that when someone requests metrics like "Active Users", they get the same answer - whether it's through a dashboard, a report, or an AI assistant. This consistency eliminates discrepancies in metric calculations across different tools.
"The semantic layer (or Metrics layer) is not just a concept, it is an entire paradigm shift in how people think and reason about analytical data in the business context." - Huy Nguyen, CTO at Holistics.io
Core Components of the Semantic Layer
The semantic layer relies on several essential components to simplify and standardize data access:
Metadata repository: Maps technical database elements to user-friendly business terms.
Business logic definitions: Centralizes calculation rules, ensuring all tools use the same formulas.
Entity relationships: Manages complex table joins, making data connections seamless.
Caching mechanism: Stores frequently used data aggregates, speeding up queries and cutting data warehouse costs.
These components work together to support a variety of modern business intelligence features and applications.
Semantic Layer Use Cases
By serving as a single source of truth, the semantic layer proves valuable across different business functions. For instance, product managers and marketing analysts can independently explore data without needing IT assistance. A product manager might analyze user engagement by simply selecting "Active Users" and breaking it down by "Feature Name" and "Date" - no SQL required.
Finance teams also benefit from semantic layers by maintaining consistent and accurate reporting. Centralized definitions for metrics like revenue recognition and cost allocation ensure that quarterly reports, board presentations, and dashboards all align with regulatory standards.
Additionally, the semantic layer plays a crucial role in AI-powered analytics for better business strategy. It provides structured, governed data that AI systems can safely query.
"The semantic layer enforces guardrails, ensuring the AI system queries only approved, governed, and contextualized metrics." - dbt Labs
This ensures AI assistants avoid errors, such as combining incompatible data sources or relying on outdated definitions.
Semantic Layer vs. Metric Layer in Business Intelligence [English]
Key Differences Between Metrics Layer and Semantic Layer
The semantic layer and the metrics layer often get lumped together, but they serve very different purposes. Think of the semantic layer as a translator - it takes the technical database structures and turns them into business-friendly terms. It maps out dimensions, measures, and relationships across your entire data model. On the other hand, the metrics layer zeroes in on defining and calculating KPIs, often working as a specific part of the larger semantic framework.
One key distinction lies in how they handle data. The semantic layer is typically virtual, meaning it translates queries on the fly without actually storing data. In contrast, the metrics layer often includes a storage component, which allows it to save calculated metrics for historical analysis.
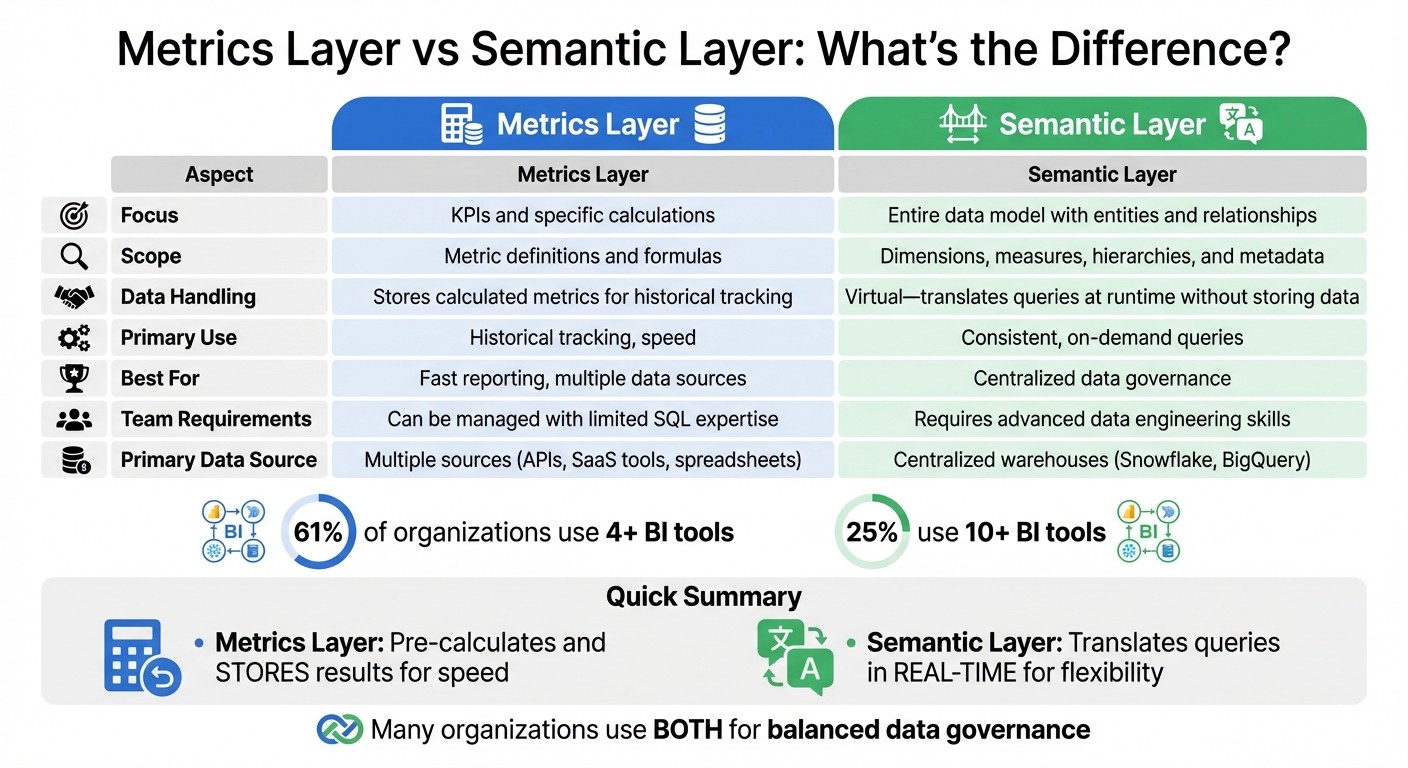
Comparison Table: Metrics Layer vs Semantic Layer
Aspect | Metrics Layer | Semantic Layer |
|---|---|---|
Focus | KPIs and specific calculations | Entire data model with entities and relationships |
Scope | Metric definitions and formulas | Dimensions, measures, hierarchies, and metadata |
Data Handling | Stores calculated metrics for historical tracking | Virtual - translates queries at runtime without storing data |
Team Requirements | Can be managed with limited SQL expertise | Requires advanced data engineering skills for complex modeling |
Primary Data Source | Multiple sources (e.g., APIs, SaaS tools, spreadsheets) | Centralized warehouses (e.g., Snowflake, BigQuery) |
This breakdown shows how each layer addresses different needs within a data ecosystem.
When to Use Each Layer
Now that the differences are clear, how do you decide which one to use?
Go with building a semantic layer if your organization has a centralized, modern analytics stack and needs to handle complex joins. For example, companies with centralized warehouses have reported cutting analytics costs by up to 80% by using a semantic layer to streamline their visualization processes and avoid redundant steps.
On the flip side, a metrics layer is ideal when speed and simplicity are priorities. It’s perfect for businesses that rely on multiple data sources - like APIs or SaaS tools - and want to avoid heavy technical overhead. Many companies find success with a hybrid approach: they use a semantic layer for centralized warehouse governance and a metrics layer for departmental data that needs quick access and historical tracking.
How Querio Uses the Semantic Layer for AI-Driven BI
Querio's semantic layer acts as a bridge between your data warehouse - whether that's Snowflake, BigQuery, or Postgres - and its AI-powered query interface. This layer transforms natural language queries like "Who are our active users?" into optimized SQL, tapping into predefined tables, joins, and business logic. Users don’t need to navigate complex schemas or write code; the semantic layer does the heavy lifting, making data interactions smooth and intuitive.
Querio's Semantic Layer Features
Querio simplifies metadata by translating technical terms into user-friendly labels - turning something like "tbl_rev_sum" into "Revenue." It also enforces consistent business definitions for metrics such as "churn rate" or "monthly recurring revenue" across all dashboards, queries, and reports. This eliminates discrepancies caused by varying metric calculations.
Another key feature? Tackling a common AI issue: hallucinations. By grounding AI responses in a single source of truth, Querio ensures the AI won't invent numbers or rely on outdated formulas.
"The semantic layer is one possible solution to establish a single source of truth for a business. Through this source of truth, the reliability and consistency of downstream applications, such as chatbots, can be improved."
Benefits for Data Teams and Business Users
These features bring clear advantages to both data teams and business users.
For data teams, centralizing governance means defining joins, hierarchies, and glossaries just once. This ensures every query - from a finance analyst’s report to the CEO’s dashboard - follows the same rules. It also reduces repetitive tasks and minimizes back-and-forth clarifications when business users need help understanding data.
Business users, on the other hand, enjoy true self-service analytics. They can ask questions in plain English and get accurate, real-time charts almost instantly. The semantic layer handles the technical complexity, so non-technical teams don’t need SQL expertise or constant support from data engineers. This speeds up decision-making while lightening the data team’s workload.
Combining Metrics and Semantic Layers in Querio
Querio brings together the strengths of both metrics and semantic layers into a single, cohesive system. Instead of forcing a choice between the two, it seamlessly integrates them. This means your data team can manage warehouse data through the semantic layer vs traditional data models while simultaneously handling departmental data from APIs. Everything flows through one unified platform, eliminating the need to juggle multiple tools.
Unified Approach for Data Governance
The combination of these layers shines when it comes to data governance. Querio's metrics catalog acts as a centralized hub where data teams can certify "verified" metrics for official use. For example, when you define key metrics like "monthly recurring revenue" or "churn rate" in the catalog, those definitions automatically apply across all dashboards, AI queries, and reports. This "define once, use everywhere" approach aligns with the DRY (Don't Repeat Yourself) principle, keeping your data infrastructure clean and efficient. Data engineers only need to set up joins, hierarchies, and business logic one time, and those rules are universally applied - whether it's for dashboards, reports, or AI-driven queries.
Enabling Self-Service Analytics at Scale
This unified system doesn’t just simplify governance - it also empowers users to explore and innovate independently. Querio’s hybrid model strikes a balance between control and flexibility. While data teams maintain strict oversight of core business definitions in the semantic layer to ensure accuracy and consistency, business users can create "calculated metrics" without needing to write SQL or rely on engineering support. This prevents issues like conflicting metric definitions, where teams might create duplicate or inconsistent versions due to unclear ownership. With clear details, descriptions, and certification statuses for every metric in the catalog, organizations can scale self-service analytics confidently - delivering both quality and efficiency without overloading data teams with repetitive requests.
Conclusion: Choosing the Right Layers for Your Organization
Matching your data layers to your organization's needs can bring clarity and improve efficiency. Consider starting with a modern data layer if you have a centralized data warehouse like Snowflake or BigQuery, a team of analytics engineers, and a need to manage metrics across multiple BI tools. On the other hand, a metrics layer might be the better choice if your data is spread across various SaaS tools and APIs, you need to work quickly, or you don’t have a dedicated data engineering team.
For larger organizations, a hybrid approach often works best. This method ensures strict governance over key financial and business KPIs through the semantic layer, while also giving departments like Marketing or Sales the freedom to define and manage their own specific metrics. This balance helps unify analytics across the organization. According to a 2021 Forrester survey, over 61% of organizations use four or more modern business intelligence tools, and 25% use 10 or more. With so many tools in play, a unified strategy is critical to avoid metric inconsistencies.
Shifting from a table-centric approach to a metrics-centric mindset helps align analytics with your business logic.
To make this transition smoother, document metric definitions - such as timeframes, filters, and logic - in a shared glossary. This prevents "metric bloat" and encourages adoption. Keep things straightforward: build layers that fit seamlessly into daily workflows and focus on onboarding users effectively. Choosing the right layers ensures every team has access to consistent, actionable insights.
FAQs
How can I choose between a metrics layer and a semantic layer?
Choosing between a metrics layer and a semantic layer boils down to what your organization needs from its data.
A metrics layer focuses on defining and centralizing key business metrics like revenue or churn rate. It ensures these calculations remain consistent across dashboards and reports, making it the go-to choice when you need a single, reliable source of truth for critical metrics.
In contrast, a semantic layer offers a broader abstraction of your data. It simplifies complex data models into terms that non-technical users can easily understand - think "customers" or "products." This layer allows for flexible data exploration while still maintaining consistent definitions, making it more approachable for business users.
Your choice should align with factors like your existing data infrastructure, organizational complexity, and user needs. For instance, technical analysts might lean toward the precision of a metrics layer, while business users would appreciate the intuitive nature of a semantic layer. If your organization has diverse requirements, a hybrid approach can deliver both flexibility and strong governance.
How does a semantic layer enhance AI-driven analytics?
A semantic layer plays a key role in improving AI-driven analytics by offering a centralized system to manage consistent and well-defined metrics. This ensures that AI tools and models access reliable and accurate data, minimizing errors and speeding up decision-making processes.
By standardizing how metrics are defined and shared across teams, the semantic layer promotes scalable insights and encourages smoother collaboration. It also simplifies governance efforts, helping maintain transparency and trust throughout analytics workflows.
What advantages do businesses gain by combining metrics and semantic layers?
Combining metrics layers and semantic layers creates a streamlined and consistent method for data analysis. This ensures that all teams work with the same reliable calculations for key metrics such as revenue, active users, or profit margins. By doing so, it eliminates duplicate coding efforts and guarantees that every tool - whether it’s dashboards, data notebooks, or embedded apps - operates with consistent, well-governed definitions.
The metrics layer handles high-performance, pre-aggregated calculations tailored for large-scale analytics. Meanwhile, the semantic layer converts these definitions into accessible formats like SQL or REST, enabling teams across the organization to use them effortlessly. Together, these layers improve decision-making speed, minimize inconsistencies, and strengthen data governance - all while allowing the flexibility needed for ad-hoc queries and deeper exploration.
Related Blog Posts


