What is a semantic layer? A Clear Guide to Data Insights
Discover what is a semantic layer and how it translates complex data into clear business insights to drive smarter decisions.
https://www.youtube.com/watch?v=GoDNc274RG4
published
Outrank AI
what is a semantic layer, business intelligence, data analytics, modern data stack, data governance
a20a45f2-08d3-41eb-a766-5132c07f69d8

A semantic layer is, at its core, a business-friendly map of your company's data. Think of it as a universal translator that sits between the complex, technical world of databases and the people who need to use that data to make decisions. It takes cryptic table names and jargon-filled columns and turns them into a shared, understandable language for everyone.
This translation layer is crucial because it guarantees that when different teams ask the same question—say, "What was our customer growth last quarter?"—they get the same, trustworthy answer.
Your Bridge from Raw Data to Real Business Insights

Ever tried to find your way through a foreign city where every map and street sign is written in a different, unfamiliar language? That’s what data analysis feels like for most business teams. They're dropped into a chaotic landscape of databases, tables, and obscure column names, making it nearly impossible to find a straight path to a reliable answer.
This is exactly the problem a semantic layer is built to solve. It’s not just another piece of technology; it's the antidote to data chaos. By creating a single, governed source of truth, it translates raw, messy data into concepts the business already understands.
Taming Data Complexity
Without a semantic layer, you get data anarchy. The marketing team’s “New Customer” count doesn’t match the finance team’s definition, which is different from sales. This breeds confusion, erodes trust in the data, and forces data teams into a reactive cycle of endless ad-hoc requests just to clarify which number is "correct."
A semantic layer fixes this by centralizing all the business logic. Key metrics are defined once, in one place, for everyone to use. No more debate, no more duplicate work.
A semantic layer ensures that terms like "Quarterly Sales Growth," "Customer Lifetime Value," or "Active Users" have one undisputed definition. This consistency is the bedrock of any real data-driven culture.
By creating this unified view, organizations empower everyone—from product managers to the C-suite—to make confident decisions without needing a data science degree. It shifts data from a source of friction into a genuine strategic asset.
To make this concrete, here’s a quick look at the kind of problems a semantic layer is designed to eliminate.
Core Problems Solved by a Semantic Layer
Problem Without a Semantic Layer | Solution With a Semantic Layer |
|---|---|
Teams report different numbers for the same metric (e.g., "revenue"). | A single, governed definition for every key metric ensures consistency. |
Business users depend entirely on the data team for every report. | Users can self-serve and explore data using familiar business terms. |
Complex SQL queries are required to get simple answers. | Logic for joins and calculations is pre-built, hiding the complexity. |
Inconsistent metric calculations lead to poor business decisions. | Calculations are standardized and reliable, building trust in the data. |
Data access is either too restrictive or too open, creating security risks. | Granular, role-based security is managed centrally and consistently. |
This shift from chaos to clarity is what allows a business to truly scale its analytics and decision-making capabilities.
The Foundation of Self-Service Analytics
Ultimately, the goal is to get to a place where business users can explore data and answer their own questions on the fly. The semantic layer is what makes this a reality, providing a safe and intuitive environment for data exploration.
It gets this done by:
Mapping technical fields like
cust_ord_tbl.order_valueto clear business terms like Revenue.Pre-defining relationships between different data sets, so users don’t have to figure out complex SQL joins on their own.
Centralizing access controls, making sure people only see the data they are actually authorized to view.
This structure systematically removes the technical hurdles that once stood between users and their data. Instead of waiting weeks for a report, a marketing manager can instantly pull a trusted analysis of campaign performance. That’s the kind of agility that helps businesses react faster to market changes and uncover opportunities that would otherwise stay buried in complexity.
The Journey from a Patented Idea to a Modern Data Staple
The idea of a semantic layer wasn't cooked up in a recent cloud-era brainstorming session. It’s a concept that’s been around for decades, born from a problem that still feels very familiar: making data accessible to people who aren’t database experts.
Let's rewind to the early 1990s. If you were a business leader back then, getting answers from company data was a huge headache. You had to go through a technical specialist who could navigate the maze of relational databases. This technical bottleneck was frustrating for everyone and slowed decision-making to a crawl.
This very problem led to a breakthrough. On May 29, 1992, a company named Business Objects patented a new way to represent data. Their invention let non-technical users ask questions using everyday business terms—like "total sales last quarter"—instead of writing complicated SQL. This patent was the blueprint for what we now call the semantic layer, an idea that would completely reshape the business intelligence world. You can actually explore more about this foundational patent and see how it opened the door for data to become more accessible.
This innovation kicked off the first wave of BI tools. For a long time, the semantic layer wasn't something you could buy on its own; it was just a feature baked into large, all-in-one BI platforms.
The Era of Bundled BI and OLAP Cubes
Throughout the late 90s and 2000s, the semantic layer was the hidden engine inside traditional BI tools from companies like Cognos, MicroStrategy, and, of course, Business Objects. These platforms often relied on Online Analytical Processing (OLAP) cubes, which were essentially pre-calculated, multi-dimensional views of the data designed for very fast reporting and analysis.
The semantic layer was responsible for defining the business logic and hierarchies within these cubes, making it possible for managers to slice and dice the data. It worked, but this approach had some serious limitations:
It was inflexible. All the business logic was stuck inside a single BI tool. If you wanted to switch vendors, you had to start from scratch.
It was slow to change. Need to update how "active users" is calculated? That often meant a painful, time-consuming process of rebuilding the entire cube.
It was siloed. The definitions created in one tool couldn't be shared with any other system, so different departments often ended up with different answers to the same question.
The traditional semantic layer was powerful but confined. It solved the problem of data translation for one specific tool, but it couldn't provide a single source of truth for the entire company's analytics ecosystem.
Because of this, the semantic layer remained a powerful but mostly invisible component, tied directly to the BI dashboarding experience. This was the status quo for years, right up until the data world was turned upside down by the cloud.
The Modern Resurgence in the Cloud
The arrival of powerful cloud data warehouses like Snowflake, BigQuery, and Redshift changed everything. Companies could now store and analyze staggering amounts of data with incredible efficiency. This data boom also triggered an explosion of data tools—a whole new ecosystem of BI platforms, data science notebooks, and AI applications all trying to tap into the same information.
This new reality exposed the fatal flaw of the old, bundled approach. A semantic model locked inside a single BI tool just wasn't going to cut it anymore. Businesses desperately needed a way to make sure the definition of "net revenue" was exactly the same in their Tableau dashboards, their Python models, and their C-suite reports.
This demand for consistency and trust sparked the rebirth of the semantic layer as a standalone, flexible piece of the modern data stack. Today's universal semantic layers are built to sit between all your data sources and all your data tools, serving as a central, governed hub for all your business logic. This evolution from a patented feature to a modern data staple is what finally makes true self-service analytics possible at scale.
How a Semantic Layer Actually Works Under the Hood
To really get what a semantic layer does, you have to look past the high-level benefits and peek under the hood at the mechanics. Imagine it as an expert data concierge, standing between you and the raw data, managing every request to make sure you get exactly what you asked for.
It's important to remember that the semantic layer doesn't actually store any data. Instead, it holds the master instruction manual—the single source of truth for how to find, combine, and calculate information from your databases.
This entire process boils down to three core jobs that work together seamlessly: mapping technical data to business terms, centralizing all your business logic, and translating simple user requests into complex database queries.
The infographic below shows how we got here, tracing the evolution of the semantic layer from a patented concept to a must-have component in the modern data stack.
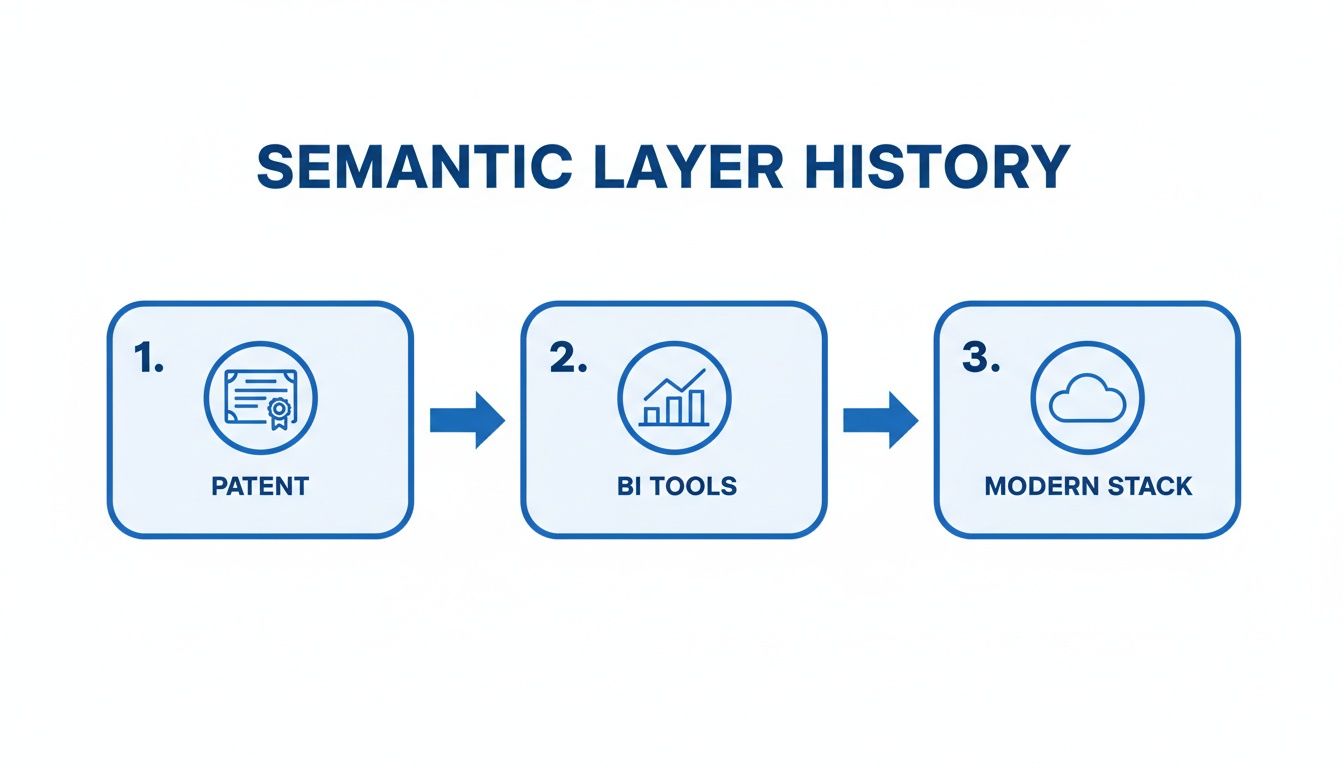
As you can see, the journey has been a shift away from siloed, tool-specific models toward the flexible, universal layers that power today's best analytics platforms.
Mapping Data to Business Language
First things first, the semantic layer has to play translator. Your databases are probably filled with cryptic, technical field names like fct_transactions or prod_sku. The semantic layer’s initial job is to map these unfriendly names to business terms everyone in the company actually uses.
fct_transactions.trans_amtbecomes Transaction Amount.dim_customer.acct_creation_dtbecomes Account Creation Date.
This simple act of renaming is a game-changer. It instantly removes a huge barrier for non-technical folks, turning an intimidating maze of database jargon into a familiar catalog of business concepts they can comfortably work with.
Centralizing Business Logic and Rules
Next up, and this is where the real magic happens, the semantic layer becomes the one and only source of truth for all your business calculations and definitions.
Instead of every analyst or department cooking up their own version of a key metric, that logic is defined just once, for everyone.
For instance, the metric Net Revenue might be defined as:SUM(fct_transactions.trans_amt) - SUM(fct_transactions.refund_amt)
This formula gets stored centrally within the semantic layer. From that point on, anyone who asks for "Net Revenue"—whether they're in Tableau, Power BI, or a Google Sheet—gets a number calculated using that exact, pre-approved logic. This is how you end the dreaded "why don't our numbers match?" meetings once and for all.
This centralized approach is a major departure from older methods. If you're comparing semantic layers vs. traditional data models, you'll see that traditional models often scatter business logic across dozens of different reports and tools, creating chaos.
By centralizing business logic, the semantic layer acts as your company's official data dictionary and rulebook. It guarantees that every metric is defined, calculated, and governed in one place, creating unwavering consistency.
This consistency is the bedrock of trustworthy self-service analytics. When people know they can rely on the numbers, they're empowered to explore the data and make decisions with confidence. That frees up your data team from an endless queue of "can you just validate this for me?" requests.
Translating User Requests into Database Queries
Finally, the semantic layer acts as an intelligent interpreter. When someone in marketing builds a report or a product manager asks a question, they're using the friendly business terms we set up in the mapping stage. The semantic layer intercepts that simple request and translates it into the complex, perfectly-formed SQL query the database needs to run.
Let’s walk through a quick example. A marketing manager drags and drops "Sales by Region" into their BI tool.
Request Interception: The BI tool sends a request to the semantic layer for the metric "Sales" and the dimension "Region."
Logic Application: The semantic layer looks up its definitions. It knows "Sales" is
SUM(fct_transactions.trans_amt)and "Region" is found in thedim_geo.region_namecolumn. Crucially, it also knows exactly how the transaction and geography tables are supposed to be joined together.SQL Generation: With this knowledge, it builds a complete SQL query on the fly. It'll look something like this:
SELECT dim_geo.region_name, SUM(fct_transactions.trans_amt) FROM fct_transactions JOIN dim_geo ON ... GROUP BY dim_geo.region_name;Execution and Delivery: The semantic layer sends this fresh query to the data warehouse. The warehouse runs it and sends back the results. The semantic layer then passes this clean, aggregated data back to the BI tool, where it appears for the user.
The marketing manager only sees the final result: a simple, clean table showing sales figures for each region. All the underlying complexity is handled automatically, ensuring the query is not only correct but also optimized for the best possible performance. This is how you make sophisticated data analysis accessible to everyone.
The Real-World Benefits for Your Business and Data Teams

Implementing a semantic layer isn't just a technical fix; it's a strategic decision that pays dividends across the entire company. It creates that elusive single source of truth everyone talks about, fundamentally changing how teams work with data. The friction disappears, paving the way for a huge jump in productivity and insight.
For the people on the business side, the change is immediate. It’s the end of data guesswork. No more waiting in a long line for the data team to pull a simple report. They can finally explore information on their own, build dashboards they trust, and get answers in minutes, not days.
Meanwhile, data teams get to break free from the endless cycle of ad-hoc requests. They’re no longer stuck clarifying definitions or explaining why one department’s numbers don’t match another’s. This frees them up to focus on the high-impact, strategic projects that actually move the business forward.
Empowering Business Users with Confidence
The single biggest win for non-technical teams is the confidence a semantic layer inspires. When everyone is working from the same governed definitions and metrics, trust in the data skyrockets. This reliability encourages genuine curiosity and empowers users to make faster, smarter decisions without second-guessing every number.
True Self-Service Analytics: Users can slice and dice data using familiar business terms—like "Monthly Recurring Revenue" or "Customer Churn"—and answer their own questions on the fly.
Faster Time-to-Insight: The lag time between a question and its answer shrinks dramatically. This lets teams react quickly to market shifts and jump on new opportunities.
Unwavering Consistency: Every report and dashboard, regardless of the department, shows the same figures for the same metrics. This puts an end to those dreaded "why don't our numbers match?" meetings.
A semantic layer also completely changes the game for roles like a Business Intelligence Analyst. It provides the consistent data view that’s essential for creating meaningful reports and analysis. If you're curious about the details of that role, this guide on what a Business Intelligence Analyst does offers a great overview of how they thrive in modern companies.
Unlocking Strategic Value for Data Teams
Data teams often find themselves buried under a mountain of requests for custom reports and one-off data pulls. A semantic layer acts as a pressure relief valve by automating the routine work and centralizing all the business logic. This frees up an incredible amount of their time and mental energy.
It’s a shift that allows them to evolve from a reactive support desk into a proactive, strategic partner to the business.
By defining metrics centrally, a semantic layer can reduce the time data teams spend on repetitive, ad-hoc queries by over 50%. This lets them tackle more complex challenges like predictive modeling and improving data infrastructure.
Here’s what’s in it for the technical teams:
Reduced Ad-Hoc Workload: When business users can help themselves, the queue for simple data requests naturally shrinks.
Centralized Governance: All your business logic, metric definitions, and access rules live in one place, which makes maintenance a breeze and guarantees consistency.
Enhanced Data Security: Access controls are applied universally. This means users only see the data they're supposed to, no matter which BI tool or application they're using.
Driving Business-Wide Agility and Governance
Beyond the benefits for individual teams, a semantic layer delivers powerful advantages for the entire organization. It’s a foundational piece for building a data culture that can scale securely. In a world where data silos plague an estimated 80% of enterprises, a semantic layer is the bridge that connects siloed data sources to the people who need them.
This abstraction—turning technical complexity into business-friendly language—is what makes true data democratization possible. For example, in the U.S. financial sector, firms using a semantic layer have reported a stunning 55% reduction in their time-to-insight. That acceleration, from days to hours, comes directly from empowering non-technical analysts to run their own queries.
By creating a unified, trusted view of data, organizations become more agile, data-literate, and better equipped to make smart decisions at every level.
Choosing Your Approach to Semantic Layer Architecture
Not all semantic layers are built the same way. Once you see the value in creating a single source of truth for your business metrics, the next big question is how to build it. The architectural path you choose will ripple through your entire organization, affecting everything from your data team’s agility to your company's long-term analytics strategy.
The decision really boils down to two main approaches. You can stick with a traditional, embedded model that lives inside a specific tool, or you can adopt a more modern, universal architecture built for flexibility. The right choice depends on thinking beyond today's problems to where your data stack is heading tomorrow.
The Traditional Embedded Model
For many companies, the journey starts with an embedded semantic layer. This is where your business logic—all those crucial metrics, dimensions, and relationships—is defined and stored right inside a single Business Intelligence (BI) tool. If you’ve ever built data models in platforms like Power BI, Looker, or Tableau, you’ve worked with an embedded model.
This approach is popular for good reason: it’s often the path of least resistance. When your whole company lives and breathes in one BI platform for every report and dashboard, an embedded model can feel wonderfully simple. Everything is in one place, which makes the initial setup and management seem straightforward.
But that simplicity hides a major drawback. Your carefully crafted business logic is now a prisoner, trapped inside that one application. What happens when the marketing team wants to use a different analytics tool, or a new AI application needs to pull a core metric? They can't. This creates new data silos and forces you to duplicate logic everywhere, leading to the exact kind of inconsistency the semantic layer was meant to solve.
The Modern Universal Model
On the other hand, the universal semantic layer—often called a "headless" or "standalone" layer—operates as an independent, central hub. It isn't tied to any single BI tool. Instead, it sits between your data warehouses and all the different tools your teams use, serving up consistent, governed metrics to everyone and everything that needs them.
This architecture is the natural evolution for the modern data stack, where companies rely on a mix of specialized tools. It ensures that the definition of "Net Revenue" is identical whether a data scientist is pulling it in a Python notebook, an executive is viewing it in a Tableau dashboard, or a product manager is seeing it in a customer-facing report.
By separating the business logic from the presentation layer, a universal model gives you incredible flexibility, helps you avoid vendor lock-in, and guarantees that every single person and system is working from the same playbook.
The universal layer is becoming the go-to for cloud-native companies because it's built for interoperability. By centralizing metric definitions, it can slash governance costs by 50% in complex environments and directly addresses the data consistency issues that 92% of firms report.
To help you decide which model fits your organization, let's compare them side-by-side.
Embedded vs Universal Semantic Layer Comparison
Choosing the right architecture is a critical decision. An embedded model might seem easy now, but a universal layer is built for the future. This table breaks down the key differences to help guide your choice.
Feature | Embedded Semantic Layer | Universal Semantic Layer |
|---|---|---|
Architecture | Tied to a specific BI or analytics tool | Independent, standalone platform |
Consistency | Consistent only within its host tool | Consistent across all tools and applications |
Flexibility | Low; locked into a single vendor's ecosystem | High; supports a diverse range of tools (BI, AI, etc.) |
Governance | Decentralized; logic is duplicated across tools | Centralized; a single source of truth for all metrics |
Scalability | Limited; becomes complex with more tools | Designed for scale and a growing data stack |
Best For | Teams using a single BI tool for all analytics | Organizations with multiple data tools and a focus on consistency |
Ultimately, while an embedded layer provides a quick win, a universal semantic layer offers a more strategic, future-proof foundation for your entire data ecosystem.
When you're weighing your options, think about long-term maintainability. An embedded model can quickly turn into a messy pile of technical debt, making it a nightmare to adapt as your company's needs change. Taking the time for understanding and managing technical debt will help you make a more sustainable choice that fuels growth instead of holding it back.
To get started on the right foot, check out our guide on the 5 steps to customize semantic layers to fit your business perfectly.
Putting Theory Into Practice with Modern Tools
It’s one thing to understand the theory behind a semantic layer, but it’s another to see it work in the real world. Modern data platforms are what bridge that gap, turning abstract ideas about data consistency into tangible, everyday workflows that save teams a massive amount of time and frustration. A tool like Querio, for instance, is built to create a shared space where product and analytics teams can come together to define, manage, and actually use business logic.
This is a huge departure from the old way of doing things, where data models were locked away inside a single BI tool, invisible to everyone else. The goal now is to build a central hub where a metric or dimension is defined just once. When that happens, your product team analyzing user engagement and your finance team reporting on revenue are guaranteed to be working from the same playbook.
Creating a Single Source of Truth
At its heart, a modern semantic layer is all about centralization. Instead of having business logic scattered across countless SQL scripts, dashboard-specific calculations, and disconnected spreadsheets, you define it all in one governed, accessible repository.
Platforms like Querio make this possible with features designed for a universal semantic layer:
Centralized Metric Definitions: You can define critical metrics like 'Customer Acquisition Cost' or 'Monthly Active Users' one time, complete with plain-English descriptions and the exact calculation logic.
Version Control for Logic: Business logic should be treated just like code. Any proposed change to a metric’s formula can be reviewed, approved, and tracked, which prevents those sudden, unexplained shifts in your reports.
Seamless Data Source Connectivity: You can pull in data from everywhere—production databases, data warehouses, third-party apps—and bring it all together under one clean, cohesive business model.
This is the structure that allows a company to grow its data culture without creating more data chaos. Everyone is finally speaking the same language.
A Practical E-commerce Example
Let’s picture an e-commerce company that’s constantly fighting over its numbers. The marketing team calculates Customer Acquisition Cost (CAC) using ad spend data pulled from their platforms. At the same time, the finance team calculates it using their own accounting records. The two figures never, ever match, which breeds friction and a general mistrust of the data.
With a platform like Querio, they can put this problem to bed for good. A data analyst sits down with both teams and gets them to agree on a single, official definition for CAC. Let's say they land on:(Total Marketing Spend + Total Sales Team Salaries) / Number of New Customers Acquired
This logic is then saved as a governed metric within the platform.
From that moment on, the debate is over. The metric 'CAC' now has a universal meaning across the entire organization. It is no longer a number to be questioned but a reliable insight to be acted upon.
Now, this trusted CAC metric can be pulled into any tool or report, anytime:
In internal dashboards for the marketing team to monitor campaign performance.
In executive reports for the leadership team to track overall business health.
Even in customer-facing analytics features embedded directly into their product.
This simple example shows how a semantic layer delivers on the promise of consistent, reliable data. By defining business logic once and reusing it everywhere, teams can finally stop arguing about what the data means and start making decisions with it. For a deeper dive, explore our guide on building a semantic layer that understands your business.
Common Questions About Semantic Layers
Even when the concept makes sense, the practical side of implementing a semantic layer brings up a lot of questions. Let's tackle some of the most common ones that pop up when teams start thinking about building one.
These are the real-world concerns that bridge the gap between theory and actually getting it done—from setup time and cost to how it plays with newer tech like Large Language Models (LLMs).
How Long Does It Take to Implement?
Honestly, it depends. A focused project for a single department that just needs to lock down a few key metrics could be up and running in a few weeks. But if you're talking about an enterprise-wide rollout connecting dozens of data sources and defining hundreds of metrics, you're looking at a multi-month project.
The trick is not to boil the ocean. Start small. Pick 5-10 critical business metrics that everyone argues about and get those right first. A smaller, iterative approach delivers value fast and builds the momentum you need for a bigger rollout later on.
Is a Semantic Layer the Same as a Data Warehouse?
Nope, they're two different tools that work together beautifully. A data warehouse is your heavy-duty storage system. Its job is to hold massive amounts of structured data and make it available for querying.
A semantic layer doesn't actually store any data. It sits on top of your data warehouse (or other sources) and acts as an interpretation layer. It provides business context, defines metrics, and handles the rules for who can see what.
Think of it this way: the data warehouse is the library building, full of books. The semantic layer is the expert librarian who knows what’s in every book and can help you find the exact piece of information you need and understand what it means.
How Does a Semantic Layer Work with AI and LLMs?
A semantic layer is quickly becoming a must-have for getting trustworthy answers from AI and LLMs. When someone asks a chatbot a question like, "How did sales in the Northeast perform last quarter?", the AI's answer is only as good as its understanding of your data.
Without a semantic layer, an LLM sees a database column named fct_transactions.trans_amt and has to guess what it means. With a semantic layer, it knows definitively that this field is "Revenue" and understands how it connects to concepts like "Region" and "Product Category."
A well-defined semantic layer acts as a trusted knowledge base for AI, ensuring that natural language queries are translated into accurate, context-aware answers. It grounds the AI in your business's specific reality, preventing hallucinations and building trust.
This relationship is a huge part of modern data strategy. We actually dive much deeper into this in our guide on how a semantic layer acts as a data interface for LLMs.
What Is the Cost of Building a Semantic Layer?
The cost really comes down to the path you take. If you use the semantic layer features embedded within your existing BI tool, you might not pay extra for software, but you'll invest a lot of your data team's time in building and maintaining it.
On the other hand, bringing in a dedicated, universal semantic layer platform comes with a subscription cost. However, these tools often speed up development significantly and cut down on the long-term maintenance headaches.
The real return on investment isn't just about software costs. It’s about the massive reduction in one-off data requests and, more importantly, eliminating the costly business mistakes that happen when people use inconsistent data. An investment here pays for itself by helping your teams make smarter, faster decisions.
Ready to build a single source of truth and empower your teams with self-serve analytics? Querio’s AI-powered platform makes it easy to define, govern, and explore your key business metrics. See how you can turn data chaos into clear, actionable insights at https://www.querio.ai.

