Business Intelligence
Top AI Business Intelligence Tools for Non-Technical Users
Explore top AI business intelligence tools that empower non-technical users to analyze data and gain insights effortlessly.
AI business intelligence (BI) tools make it easy for non-technical users to analyze data and gain insights without needing IT support or coding skills. These tools allow users to ask questions in plain English, automatically generate visualizations, and access real-time data through intuitive dashboards. Key features include natural language querying, automated insights, drag-and-drop interfaces, and integration with live data sources.
Here are five leading AI BI tools:
Querio: Focuses on natural language querying and live data integration. Starts at $14,000/year.
Microsoft Power BI: User-friendly with strong Microsoft ecosystem integration. Pricing starts at $10/user/month.
Tableau: Known for advanced visualizations and AI-driven insights. Offers robust security features.
Qlik Sense: Provides conversational querying and automated insights with live data connections.
Looker Studio: Free tool from Google with seamless integration into its ecosystem.
These tools empower teams to make data-driven decisions quickly by simplifying data analysis and reducing reliance on IT teams. Below is a quick comparison to help you choose the right tool.
Best AI Tools Every Data Analyst Should Know in 2025
Quick Comparison
Tool | Pricing | Key Strengths | ||
|---|---|---|---|---|
Querio | Yes | Yes | From $14,000/year | Plain English queries, live data |
Power BI | Yes | Yes | From $10/user/month | Microsoft integration, easy to use |
Tableau | Yes | Yes | Custom pricing | Advanced visualizations, security |
Qlik Sense | Yes | Yes | Custom pricing | Real-time data, conversational queries |
Looker Studio | Limited | Limited | Free | Google ecosystem integration |
Choose based on your team's needs, budget, and existing tools for seamless integration and effective data use.
Why Non-Technical Users Need AI Business Intelligence Tools
For many professionals, data insights are essential to doing their jobs well. Yet, the barriers are real: navigating complex query languages like SQL, making sense of raw data outputs, or waiting days - sometimes weeks - for custom reports from overwhelmed IT teams. In today’s fast-moving business world, having quick access to insights is a game-changer. That’s where tools with natural language querying and automated insights step in.
Natural language querying simplifies everything. Instead of wrestling with technical syntax, users can type or speak straightforward questions like, “What were the top-performing regions for sales in Q3?” or “Which product categories grew the most last month?” The AI processes these requests and delivers accurate, easy-to-understand answers in seconds.
Automated insights take convenience a step further by identifying trends, anomalies, and opportunities without being prompted. Imagine a marketing manager receiving an alert about a sudden surge in website traffic from a specific region. That kind of instant insight allows teams to act quickly and seize opportunities as they arise.
Modern AI business intelligence tools also excel at simplifying analytics for non-technical users. With user-friendly dashboards, drag-and-drop features, real-time visual updates, and customizable views, even those without technical expertise can feel confident navigating and interpreting data. These tools adapt to individual roles, ensuring users get the most relevant insights.
This shift toward accessible data - often called the democratization of data - has transformed how businesses operate. Teams can now analyze pipelines, measure campaign success, or track key metrics on their own. The result? Faster, more informed decision-making across the board.
Another major benefit is reducing dependence on IT. When users can access and analyze data independently, organizations save money and improve accuracy. AI tools ensure data is processed consistently, minimize manual errors, and maintain uniform reporting standards across departments.
Ultimately, AI-powered tools empower non-technical users by turning complex analytics into actionable insights. They eliminate the need for specialized training or constant IT support, letting teams focus on driving better outcomes for the business.
Must-Have Features in AI BI Tools
Natural language querying is a game-changer for making data accessible to everyone. Instead of wrestling with complex query languages, users can simply type questions like, "What was the revenue by region last quarter?" and instantly get clear, easy-to-understand visualizations. This removes the usual technical hurdles and makes data exploration more intuitive.
Automated insights take the guesswork out of spotting trends. These tools constantly monitor data for patterns and alert users when something stands out. For example, if a key performance indicator suddenly changes compared to earlier periods, the system flags it and notifies the right people. This ensures important shifts don’t go unnoticed.
Drag-and-drop interface design makes creating dashboards and exploring data a breeze. Users can build visualizations by dragging data fields onto charts, tweaking filters with dropdown menus, and arranging layouts - all without needing to write a single line of code. This approach makes it easier for beginners to get started quickly.
Low-code and no-code data analysis tools takes care of the messy work behind the scenes. These tools automatically clean and organize data, identify data types, fix inconsistencies, and merge information from various sources. They handle issues like duplicates, formatting errors, or missing values so users can focus on analysis instead of troubleshooting.
Live data connections keep dashboards up-to-date with real-time information. Instead of relying on outdated data snapshots, these tools connect directly to databases, cloud platforms, and business apps, ensuring that reports and visualizations always reflect current business conditions.
Collaborative features turn data analysis into a team effort. With tools to annotate charts, share custom views, and discuss metrics, teams can build a shared understanding of their data. This makes it easier to align on decisions and uncover insights together.
Mobile optimization ensures data is always within reach. Whether you’re on a smartphone or tablet, touch-friendly interfaces let you check metrics, get alerts, and share insights anytime, anywhere. This flexibility keeps teams connected, even on the go.
Governance and security controls are critical for protecting sensitive business information. Features like user permission settings, data access controls, audit trails, and compliance certifications give IT teams the tools they need to safeguard data while maintaining transparency.
Integration capabilities are key to making AI BI tools fit seamlessly into existing workflows. By connecting directly to CRM, analytics, and accounting systems, these tools eliminate data silos and provide a unified view of business performance.
Together, these features tackle the biggest challenges non-technical users face - like navigating data complexity and relying heavily on IT support. They empower teams to confidently explore, analyze, and share data across the organization.
1. Querio
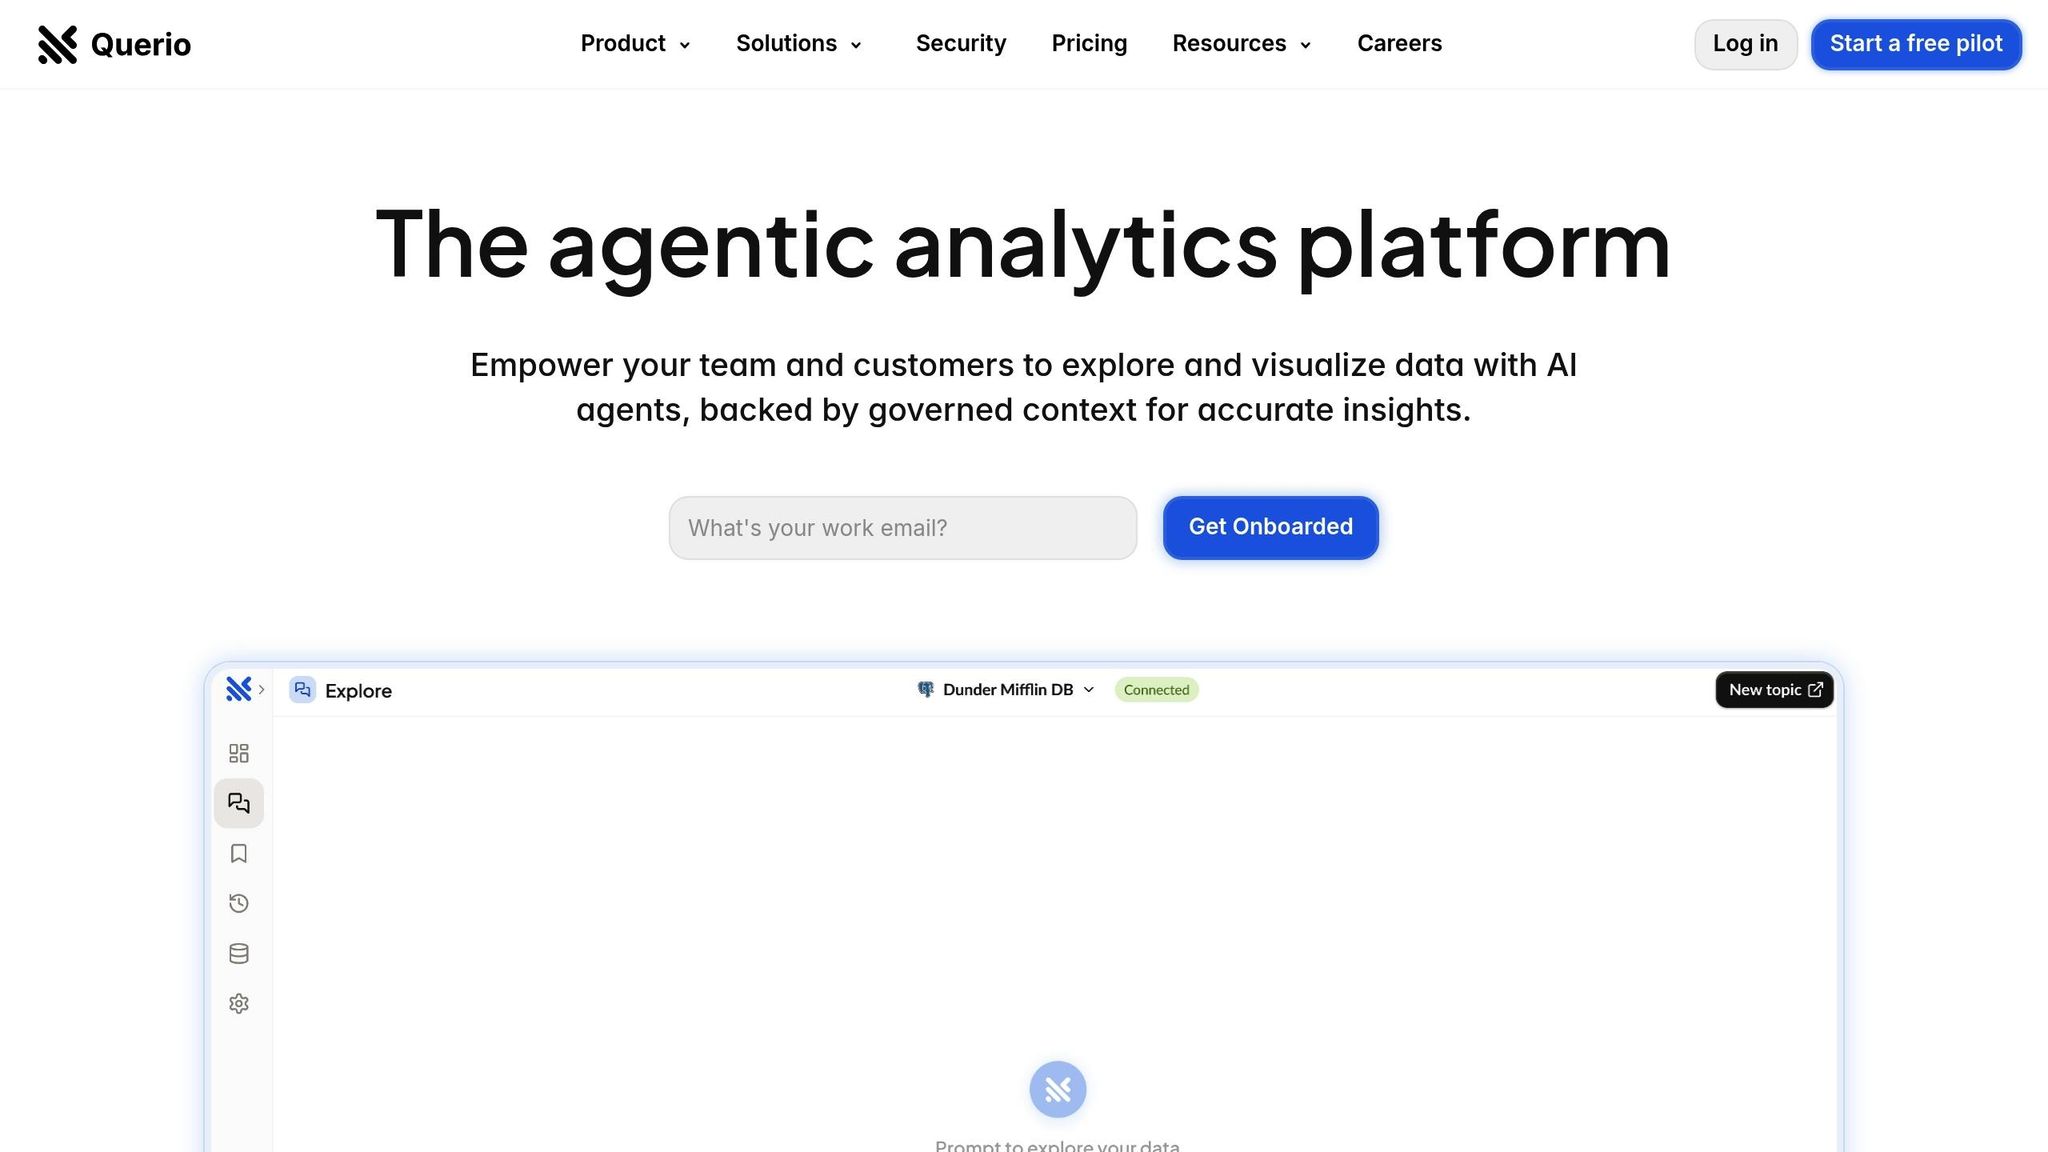
Querio is an AI-powered business intelligence platform designed to make live data accessible for non-technical users. It allows teams to interact with data using plain English, removing technical barriers and meeting the growing need for quick, data-driven decisions. By connecting directly to popular data warehouses like Snowflake, BigQuery, or PostgreSQL, Querio enables users to ask questions in everyday language and instantly receive accurate visualizations. This tool showcases how AI can simplify complex data analysis for everyone, regardless of technical expertise.
Natural Language Querying
Querio eliminates the need for SQL entirely, relying on its advanced language model to process conversational queries. Users can set up table joins, metrics, and glossaries just once, ensuring consistent and governed data access across the team.
Automated Visualizations and Reporting
The platform automatically transforms query results into clear, trend-focused visualizations. It also delivers scheduled reports, keeping decision-makers informed without extra effort.
Integration with Live Data Sources
Querio integrates seamlessly with major data warehouses like Snowflake, BigQuery, and PostgreSQL. This ensures real-time, accurate visualizations and extends its natural-language BigQuery insights for all users.
Pricing and Scalability
Querio is designed to scale with your business while offering flexible pricing options. The Core Platform starts at $14,000 per year, which includes one database connection, 4,000 prompts per month, and unlimited viewers. Additional features can be added based on your needs:
Dashboard functionality: +$6,000 annually
Extra databases: $4,000 per database per year
Data pipelines: $10,000 per year (up to three pipelines)
For self-hosted deployments, add 50% to the recurring fees, with a minimum cost of $60,000 per year. Monthly billing is also available at a 10% premium.
Querio also ensures high standards of security and reliability. It is SOC 2 Type II compliant and guarantees a 99.9% uptime SLA, making it a dependable choice for businesses prioritizing data security and performance.
2. Microsoft Power BI
Microsoft Power BI has become a go-to choice for many organizations, especially those already using Microsoft tools. Its popularity stems from its user-friendly interface, which feels familiar to anyone accustomed to Office 365. By blending this ease of use with AI-powered features, Power BI makes it simpler for non-technical users to dive into data analysis. This aligns with the broader trend of making AI data analytics tools for non-technical users more accessible to everyone.
Natural Language Querying
One standout feature of Power BI is its Q&A tool, which lets users ask questions about their data in plain, everyday language. Thanks to natural language processing uses in BI, the tool understands both the context and intent behind these questions. This means professionals like marketing managers or sales directors can explore their data without needing to write complex queries.
The Q&A tool gets smarter over time, learning from user interactions and performing better with well-structured datasets. It even suggests questions based on your data, helping uncover insights you might not have thought to explore.
Automated Insights and Visualizations
Power BI excels at turning raw data into easy-to-understand visual stories. Its Quick Insights feature automatically scans datasets to uncover patterns, trends, and anomalies. By running statistical analyses behind the scenes, it delivers pre-built visualizations that save users hours of manual work. Whether it’s spotting correlations, identifying outliers, or recognizing seasonal trends, Power BI simplifies the process without requiring users to know advanced analytical techniques.
The Smart Narrative feature takes this automation a step further by creating written summaries of visual data. These summaries explain charts and graphs in natural language, making it easier to share insights with stakeholders who prefer text over visuals.
Integration with Live Data Sources
Power BI offers flexibility in how it connects to data. Using DirectQuery, it works with live data in real time, while the Import mode allows users to create cached datasets for better performance when live data isn’t essential.
Its integration capabilities are another major strength. Power BI connects seamlessly with Microsoft tools like Teams, SharePoint, and Excel, allowing users to embed reports and dashboards directly into their daily workflows. This tight integration minimizes the learning curve and ensures that insights are readily accessible without switching between multiple platforms.
Pricing and Scalability
When you compare Power BI with other AI analytics tools, it offers flexible pricing to suit businesses of all sizes. The Pro plan costs $10 per user per month, while the Premium Per User plan, which includes additional AI features, is priced at $20 per user per month. For larger organizations, the Premium plan starts at $5,000 per month, providing dedicated capacity for enterprise-level performance and security.
Scalability is another strong point. Whether you’re a small team or a global enterprise, Power BI can handle your needs. Its integration with Azure adds even more options for managing complex data processing, and Microsoft’s global infrastructure ensures consistent performance no matter where you are.
3. Tableau
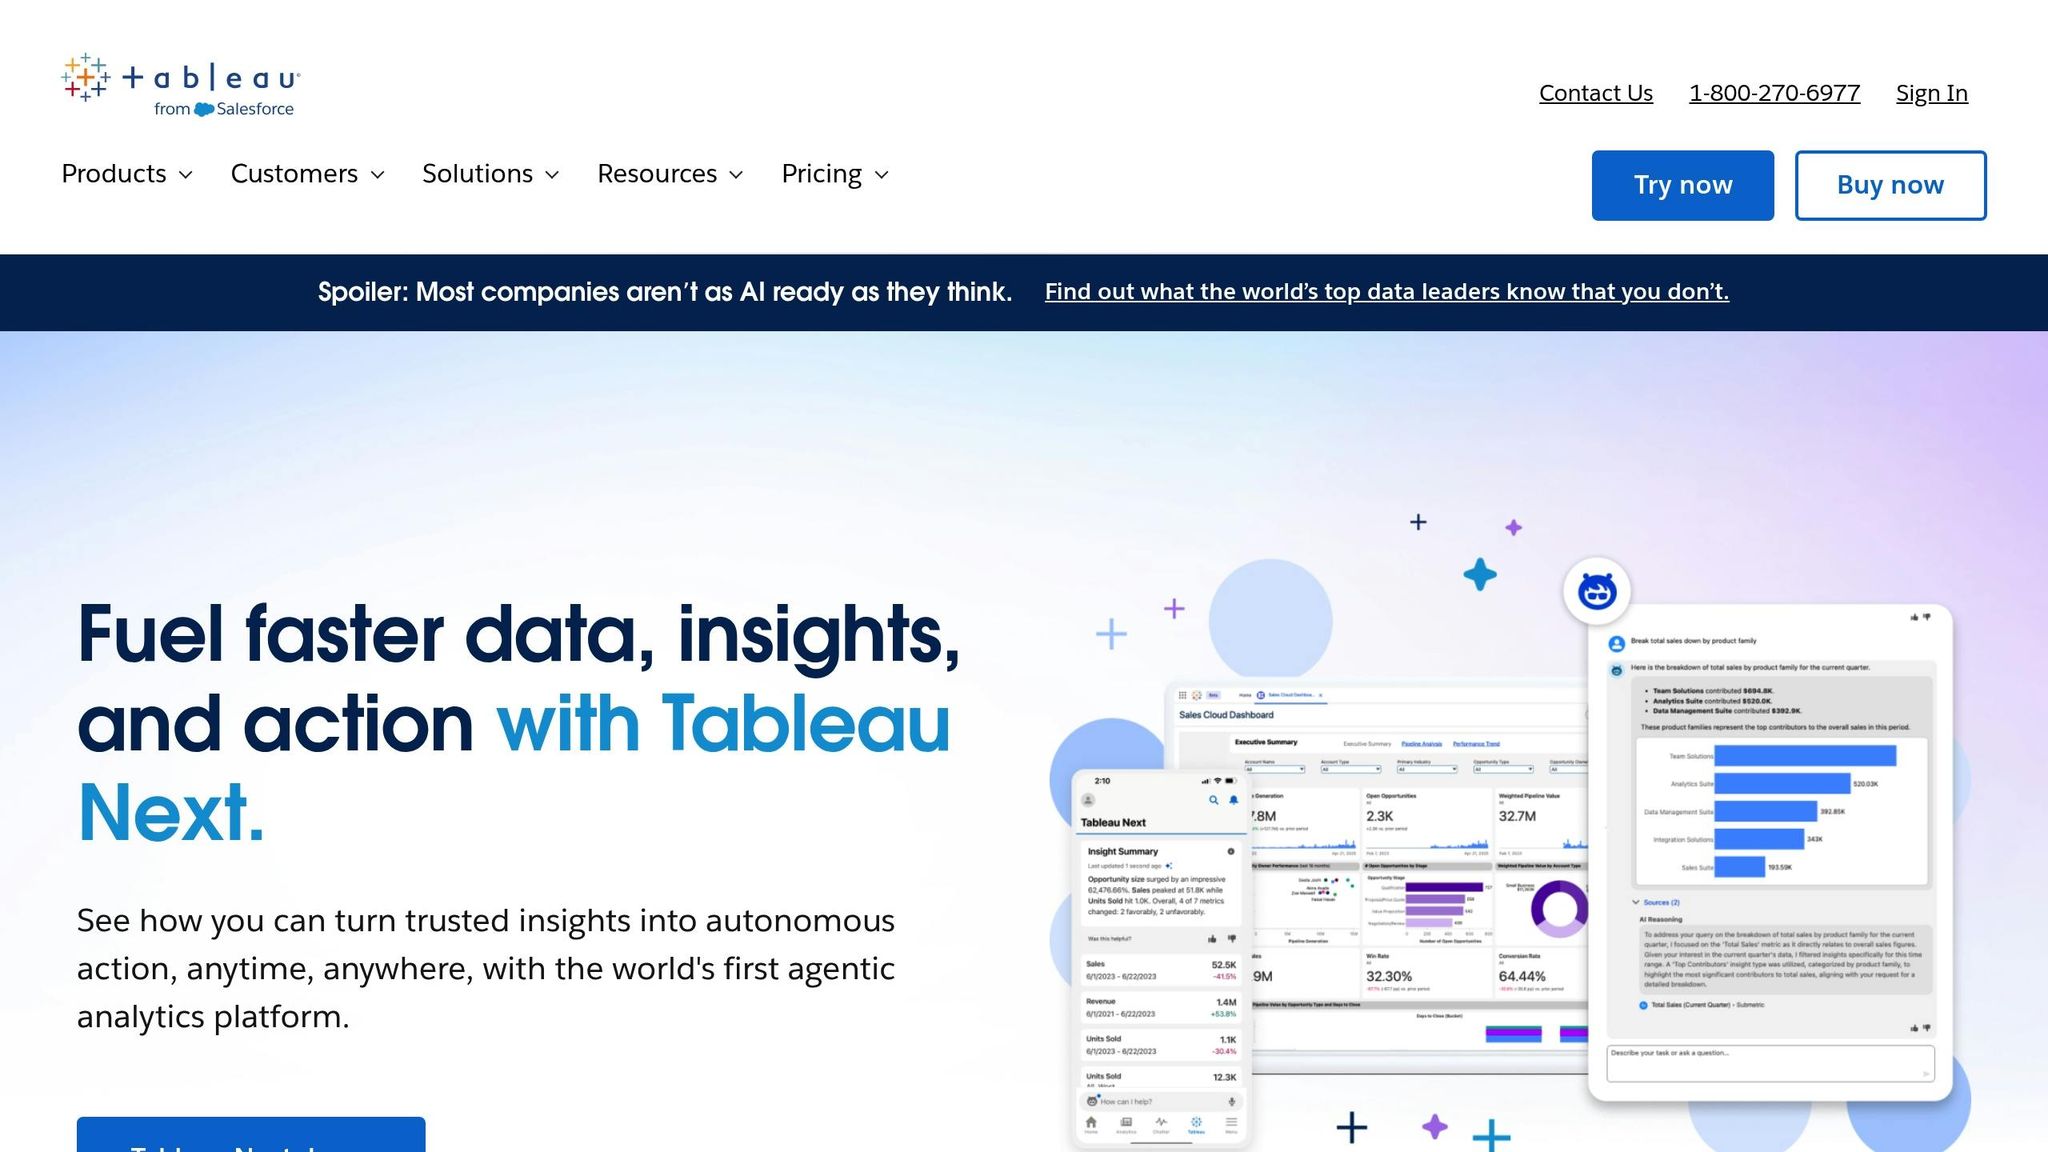
Tableau, well-known for its powerful data visualization capabilities, has stepped up its game with AI-driven tools. These updates make it easier for business professionals to create charts and discover insights - no technical expertise required.
Natural Language Querying
Tableau has integrated natural language processing into its platform, making data exploration more intuitive. With the help of Tableau Agent, users can simply type queries like "show me sales growth by region" or "what are our top-performing products this quarter." The system responds with automated visuals, turning plain English into actionable data insights. It handles tasks like listing, filtering, aggregation, ranking, and even time-series analysis. Plus, it understands common business terms and uses field metadata to deliver accurate results. Tableau Pulse adds another layer by surfacing key insights and suggesting follow-up questions to deepen the analysis[1].
Automated Insights and Visualizations
Tableau Agent also automates the creation of charts, including bar graphs, line charts, maps, scatter plots, pie charts, and tree maps. Beyond that, it proposes additional analyses to help users uncover patterns they might have missed. While the automated visuals are ready to use, users have the flexibility to tweak them manually for more precision[1].
Security
To keep data secure, Tableau relies on the Einstein Trust Layer. This ensures that AI agents only access governed content stored in Tableau Cloud or Server, maintaining strict control over sensitive information[1].
4. Qlik Sense
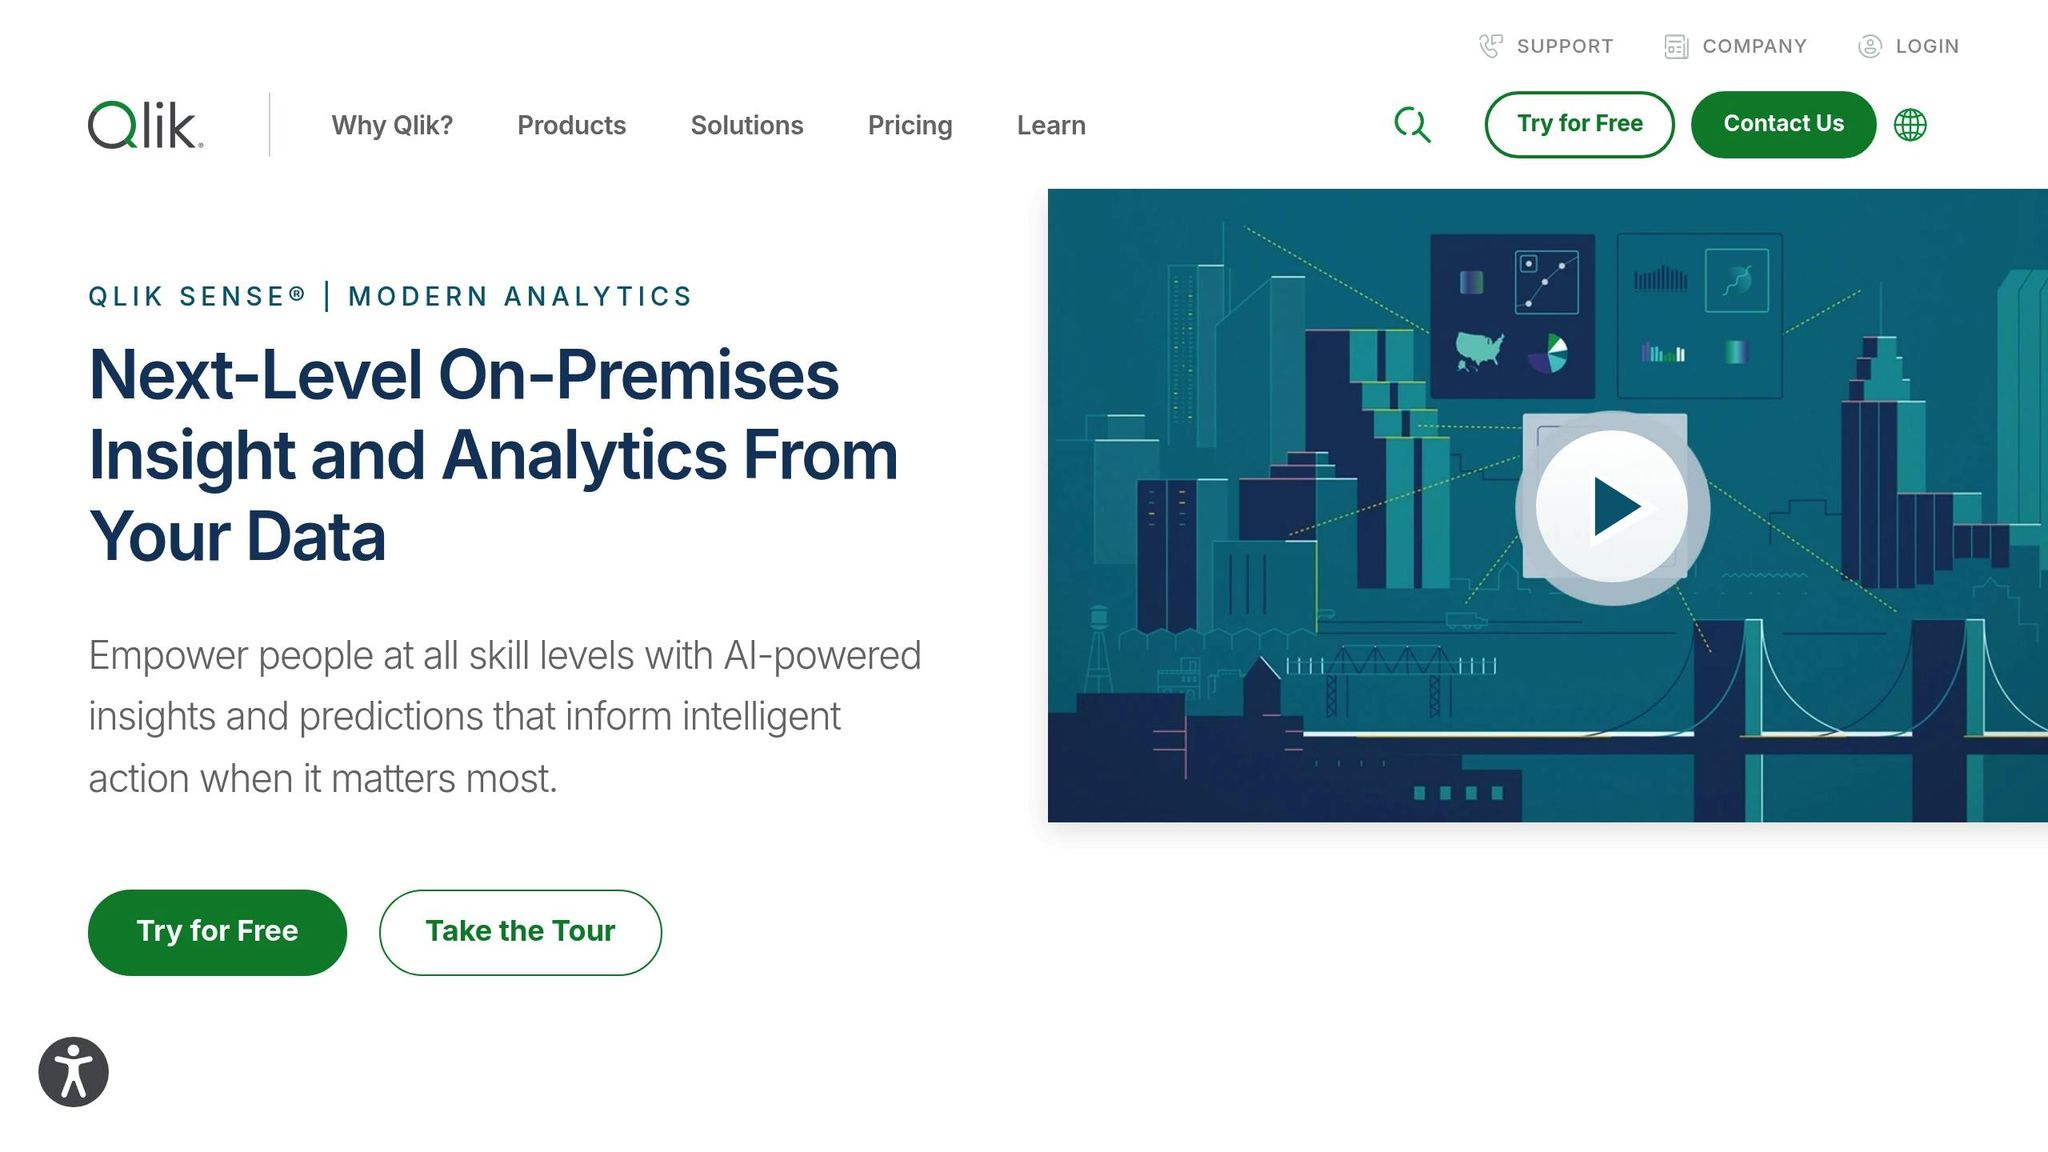
Qlik Sense stands out by offering advanced AI tools designed to make data analysis accessible, even for users without technical expertise.
Natural Language Querying
One of Qlik Sense's standout features is its Insight Advisor NLQ (Natural Language Querying). This tool lets users ask questions in plain, everyday language and receive visual answers almost instantly. For example, you could type, "Compare revenue by product category" or "Show customer satisfaction trends over the last six months", and Qlik Sense will generate the relevant visualizations. By understanding both the context and specific business terminology, it creates a natural, conversational experience without requiring users to learn complex coding or query languages.
Automated Insights and Visualizations
Qlik Sense also leverages AI tools like AutoML to uncover insights that might otherwise go unnoticed. Its generative AI assistant, Qlik Answers, takes things a step further by explaining data patterns and turning visualizations into actionable insights. This combination of automated insights and clear explanations helps users quickly understand and act on their data. To ensure accuracy, Qlik Sense keeps these insights tied to up-to-date data connections.
Integration with Live Data Sources
Another key strength of Qlik Sense is its ability to integrate with live data sources. This ensures that dashboards and reports are always based on the latest information. With real-time data connectivity, users can make timely, informed decisions while taking full advantage of Qlik Sense's intuitive querying and AI-driven insights.
5. Looker Studio (Google Data Studio)

Looker Studio, formerly known as Google Data Studio, makes data analysis accessible to everyone, even those without technical expertise. By turning raw data into meaningful insights through customizable templates and an easy-to-use interface, it empowers users to make informed decisions.
Visualization Capabilities
Looker Studio provides a wide range of visualization tools, allowing users to create interactive dashboards effortlessly. Its user-friendly design makes it easier to explore data and spot trends quickly, even for those new to data analysis.
Integration with Live Data Sources
One of Looker Studio's standout features is its smooth integration with the Google ecosystem. It connects directly to tools like Google Analytics, Google Ads, Google Sheets, and YouTube Analytics, ensuring your data stays up-to-date. Beyond Google services, it also supports external data sources like MySQL and BigQuery, enabling users to build reports that cover all their critical metrics. With the option to set custom refresh schedules, dashboards remain current without requiring manual updates.
Pricing and Scalability
Looker Studio is completely free, offering powerful reporting and visualization tools without any licensing costs. Thanks to Google's cloud infrastructure, the platform can scale effortlessly to meet the needs of small businesses and large enterprises alike, all without requiring additional hardware or complex technical management.
Next, find out how to select the right AI BI tool for your business.
How to Pick the Right AI BI Tool for Your Business
Selecting an AI BI tool that fits your business needs is essential to avoid wasting time, money, and effort. Here's a closer look at the essential features of modern business intelligence tools, to help you make the right choice.
Ease of use matters for non-technical teams. If your team isn't fluent in SQL or other technical skills, prioritize tools that are straightforward to use. Features like natural language querying and user-friendly dashboards are game-changers. For instance, Querio allows users to ask questions in plain English and instantly receive clear visualizations - no coding required.
Check compatibility with your existing data systems. Your BI tool should integrate seamlessly with your current data sources. Look for tools that connect directly to platforms like Snowflake, BigQuery, or Postgres for real-time data access. Querio, for example, supports these integrations, making it easier to work with live data.
Understand the pricing structure. Costs can vary widely depending on the tool's features, user access, and data volume. Some tools charge per user, while others offer unlimited viewer access. Querio’s pricing starts at $14,000 annually for unlimited viewers, which can be a cost-efficient option for organizations needing broad data accessibility.
Think about scalability and future needs. As your business grows, so will your data and user demands. Cloud-based business intelligence software generally scales more easily than on-premise solutions, so consider platforms that can handle increased data sources, query volumes, and users without requiring a major overhaul. Make sure the tool can keep up with your growth projections over the next few years.
Evaluate governance and compliance features. If you're in a regulated industry, ensuring the tool meets security and compliance standards is critical. Look for features like SOC 2 Type II compliance, strong encryption, and audit capabilities. Querio meets these needs with SOC 2 Type II compliance and a 99.9% uptime SLA, balancing enterprise-level security with ease of use.
Test the tool with your own data. Before committing, see how the tool performs with your actual data. Pay attention to query speed, the clarity of its visualizations, and how easily you can extract the insights you need.
Factor in the learning curve and support. Even the best tool won't be effective if your team struggles to use it. Look at the training resources and support options available. Tools with a steep learning curve might require a bigger investment in training, while more intuitive platforms can speed up adoption across your organization. The right tool should not only meet your current needs but also grow with you over time.
Conclusion
AI-powered BI tools have transformed how businesses access and use data, enabling teams without technical expertise to gain insights instantly. Gone are the days of waiting for IT to generate reports over weeks - today, professionals can simply ask questions in plain English and receive visualized data in real time, helping them make faster, smarter decisions.
Among the tools discussed, Querio stands out with its natural language querying tools and strong focus on data governance, making it a compelling option for many organizations.
Choosing the right tool depends on your team’s technical proficiency and integrating AI into your analytics workflow based on your business needs. Factors like your current data systems, budget, and the urgency of getting your team up to speed all play a role. Even the most advanced tool won’t deliver results if your team struggles to use it effectively. But when implemented well, these tools can lead to measurable gains, including faster decision-making and improved operational efficiency. For instance, Querio’s Core Platform, starting at $14,000 annually, demonstrates how strategic investments in AI BI tools can quickly pay off by driving better outcomes and delivering a strong return on investment.
FAQs
How can AI-powered business intelligence tools help non-technical users make better decisions with data?
AI-powered business intelligence tools simplify data analysis for everyone, even those without technical expertise. With intuitive interfaces and smart automation, these tools let users interact with data in plain English, generate comprehensive reports, and craft visualizations - no coding required.
Features like natural language processing and automated insights make it easy to spot trends, identify new opportunities, and make well-informed choices. Accessible dashboards empower users to explore data effortlessly, turning raw information into actionable insights that can shape better business strategies.
What should businesses with non-technical teams look for in an AI-powered business intelligence tool?
When selecting an AI-powered business intelligence tool for non-technical teams, focus on finding one that's easy to use with a straightforward interface. The goal is to simplify complex data so that everyone on the team can understand and act on insights without frustration.
It's also important to choose a tool that connects smoothly with your current data sources and offers interactive, clear visualizations. These visuals can help bring the data to life, making it easier to spot trends and patterns.
Another game-changing feature to look for is AI-driven natural language queries. This allows users to ask questions in plain English and get relevant answers, no technical jargon required. Combine that with automated insights, and your team can quickly uncover key information, streamlining decision-making for everyone involved.
How do natural language queries and automated insights make AI business intelligence tools more useful for everyday business tasks?
AI business intelligence tools are transforming how businesses interact with data by making it easier and more conversational. With natural language queries, users can simply type out questions in plain English - no technical expertise required - and receive straightforward, visual responses like charts or graphs.
On top of that, these tools save time by automatically spotting trends, patterns, or anomalies in the data. This means businesses can make quicker, data-driven decisions. By removing technical barriers, these tools give non-technical users the confidence to explore data and focus on practical, actionable insights instead of wrestling with complex systems.
Related Blog Posts


