Business Intelligence
Top 9 Tableau Alternatives for AI-First Teams (2026)
Pick BI tools that expose inspectable SQL and enforce a governed metric layer for reliable AI-driven analytics.

If I were picking a Tableau alternative for an AI-first team in 2026, I’d start with one question: Can I inspect the AI’s SQL, and does it use the same metric rules every time? That’s the split between tools that help and tools that create extra review work.
From this article, my short take is simple:
- Querio fits lean teams that want inspectable SQL/Python, Git-based metric context, and Slack/Teams delivery.
- ThoughtSpot fits business-user-heavy teams that want search-style analytics on live warehouse data.
- Looker fits companies that care most about one shared metric model across the business.
- Hex and Mode fit analyst-led notebook work more than broad self-serve.
- Sigma fits finance and ops teams that like spreadsheet-style work and write-back.
- Power BI fits Microsoft shops, but full AI can add about $6,400/month in Fabric capacity.
- Omni fits teams that want governed self-serve on live warehouse data.
- Qlik Sense fits multi-source analysis and governed reporting more than chat-first use.
The article compares all 9 tools on four buying points:
- AI agent depth - can you inspect the SQL or logic?
- Semantic governance - do metrics stay the same across users?
- Live warehouse access - does it query current data or lean on extracts?
- Dashboarding and delivery - can answers reach Slack, Teams, embeds, or apps?
One stat stands out: Snowflake Cortex Analyst reports 90%+ accuracy with a mature semantic model. That says a lot. AI analytics is only as good as the metric layer under it.
::: @figure 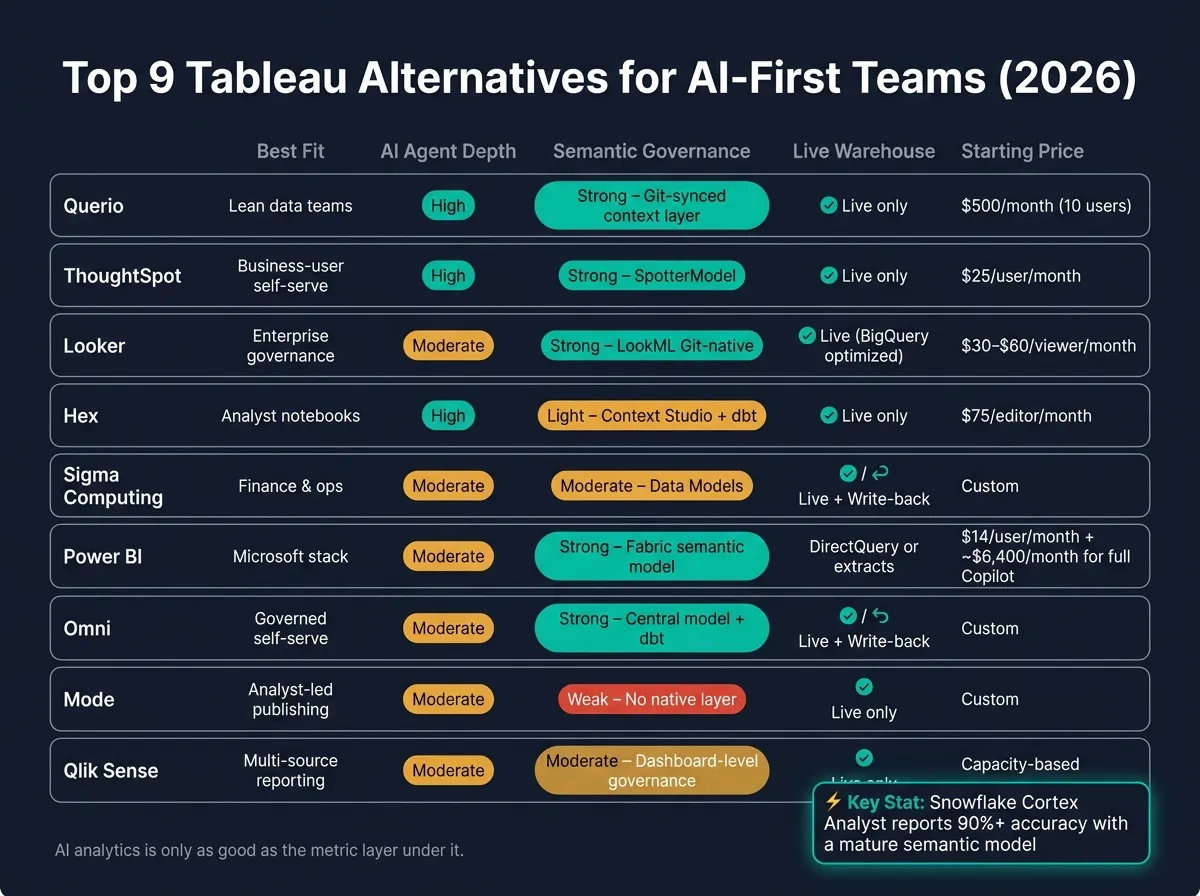 {Top 9 Tableau Alternatives for AI-First Teams: Side-by-Side Comparison (2026)}
:::
{Top 9 Tableau Alternatives for AI-First Teams: Side-by-Side Comparison (2026)}
:::
Replace Tableau with pure AI based analytics? Why this fails!
::: @iframe https://www.youtube.com/embed/25ppzjVyDeI :::
Quick Comparison
| Tool | Best fit | AI style | Metric governance | Live warehouse | Delivery |
|---|---|---|---|---|---|
| Querio | Lean data teams | Inspectable SQL/Python | Git-synced context layer | Yes | Slack, Teams, email, embeds |
| ThoughtSpot | Business-user self-serve | Conversational search | SpotterModel | Yes | Liveboards, embeds |
| Looker | Large-company governance | Gemini on modeled data | LookML | Yes | Reports, embeds |
| Hex | Analyst notebooks | SQL/Python notebook agent | Light context + dbt | Yes | Data apps |
| Sigma | Finance and ops | Spreadsheet AI | Data Models | Yes | Spreadsheet-style dashboards |
| Power BI | Microsoft stack | Copilot | Fabric semantic model | Yes, but AI is strongest in Fabric | M365, Teams |
| Omni | Governed self-serve | NL on modeled data | Central model + dbt | Yes | Sharing, embeds |
| Mode | Analyst-led publishing | Analyst workflow first | Limited native metric layer | Yes | Curated apps |
| Qlik Sense | Multi-source reporting | Guided AI analysis | Dashboard/report-level governance | Yes | Dashboards, reports |
My read: if you want chat-first analytics, inspectable output, and live warehouse access, narrow the list fast. If you want locked-down KPI reporting, a stronger semantic model matters more than flashy AI.
That’s the lens I’d use before reading the full breakdown.
1. Querio
Querio gives teams answers from inspectable SQL or Python, which makes it easier to see how metrics are produced. That matters for AI-first teams. If you can't check the logic, you're basically taking the tool's word for it. This section looks at how Querio handles agents, governance, warehouse access, and delivery.
AI Agent Depth
Querio answers questions in the web app, Slack, Microsoft Teams, or Claude via MCP by writing inspectable SQL and Python in a live notebook. As the logic changes, charts update too. Every answer stays editable, so teams can review the work instead of treating it like a black box.
There's also a clear rule here: if the data isn't available, the agent returns no answer instead of making something up. That's a big deal. A blank answer is annoying, sure, but a made-up one can send a team in the wrong direction.
Semantic Governance
Querio's governance model is built on a context layer. That layer includes joins, metric definitions, and trusted queries stored as plain SQL, Markdown, and Python files, synced to GitHub in the same repo as your dbt project. The agent can suggest what it learns, but only logged-in users can approve and commit changes.
Nothing is trapped inside the platform. The context layer can work with Claude Code or another agent even if you're not using Querio's MCP. For teams that use more than one tool, that's a practical setup.
For AI-first teams, one of the main tests is simple: do metric definitions stay the same across users and tools? Here's how Querio is set up for teams using Snowflake, BigQuery, Redshift, Postgres, Databricks, or ClickHouse.
| Feature | Querio Implementation |
|---|---|
| Governance model | Context layer (SQL, Markdown, Python files) synced to Git |
| dbt integration | Syncs context files directly to dbt project repositories |
| Supported warehouses | Snowflake, BigQuery, Redshift, Postgres, Databricks, ClickHouse |
| Data handling | Live, read-only connections |
Warehouse Actionability
Governance is only part of the story. The platform also needs to do something useful with current warehouse data.
Querio connects live to Snowflake, BigQuery, Redshift, Postgres, Databricks, or ClickHouse with read-only credentials. It can also run scheduled, prompt-driven investigations to spot anomalies, dig into root causes, and send findings to Slack or email before your team even logs in. That's the kind of workflow that can save time when something goes sideways overnight.
Dashboarding and Delivery
Querio uses notebook-based dashboards that are editable, schedulable, shareable, and embeddable in customer-facing apps through API and iframes with row-level security. In plain English: teams can build, share, and ship dashboards without giving up control over who sees what.
Slack answers include a full audit trail, and every agent query through MCP uses OAuth. That means queries inherit each user's data permissions on their own. So non-technical users can ask questions, while governance rules still stay in place.
Pricing can shape whether this works for a small analytics team or a much larger rollout. Querio starts at $500/month for 10 users. The $1,999/month plan includes unlimited users and 3 data connections, with custom enterprise pricing also available. MCP and API access starts free at 100 questions/month, and no payment details are required.
2. ThoughtSpot
After inspectable notebook-style analysis, ThoughtSpot moves the comparison toward search-first enterprise analytics. It’s a strong Tableau alternative for enterprise teams that want conversational analysis on live warehouse data and are okay with the setup work and pricing tradeoffs.
AI Agent Depth
ThoughtSpot’s 2026 AI features center on the Spotter suite, which includes AI Analyst, SpotterModel, SpotterViz, and SpotterCode [1][4]. Spotter supports multi-turn analysis, which means users can ask follow-up questions without starting over each time. It can also use Snowflake Cortex through MCP when the warehouse team wants native model support [2].
Semantic Governance
Governance in ThoughtSpot runs through SpotterModel. This is where data teams define relationships, synonyms, and business terms ahead of time so AI answers stay grounded in the business context. In plain English, you’ll need some upfront modeling work in SpotterModel before the AI output becomes dependable.
The platform also applies row-level security, SSO, and enterprise audit controls directly on live warehouse queries.
| Capability | ThoughtSpot Details |
|---|---|
| Semantic Layer | SpotterModel (relationships, synonyms, business terms) |
| Warehouse Connections | Snowflake, BigQuery, Redshift, Databricks, Postgres |
| Security | Row-level security, SSO, enterprise audit controls |
| Delivery | Liveboards, search-to-share, embedded SDK |
Warehouse Actionability
ThoughtSpot has shared rollout results from the field. WEX said AssistIQ reached 65% adoption in 90 days and cut report latency from minutes to under 3 seconds [6].
That kind of result matters because fast answers tend to change behavior. If people can search and get a response almost instantly, they’re far more likely to use the tool instead of waiting on a report queue.
Dashboarding and Delivery
ThoughtSpot delivers results through Liveboards and an embedded SDK for customer-facing deployments. Pricing starts at $25 per user per month for Essentials and $50 per user per month for Pro, with enterprise contracts often landing in the five- or six-figure annual range [4].
That pricing makes ThoughtSpot a better fit for enterprise teams. For smaller groups, the main sticking point is usually per-seat cost.
Next, Looker shifts the focus from search-first analytics to centralized modeling and governed reporting.
3. Looker
If the last platform begins with search, Looker begins with the model.
That’s the core idea behind the product. Looker is built around LookML, a code-defined semantic layer that puts modeling in one place and sets the rules for every metric.
AI Agent Depth
Looker combines LookML with Gemini for plain-English querying [2].
Here’s the catch: if someone asks a question that falls outside LookML, Looker returns "I don't know" instead of making something up [5]. That helps with reliability. But it also means the system is less suited to open-ended analysis.
So where does Looker shine? It’s at its best when a team wants governed metrics and embedded reporting, not broad autonomous analysis.
Semantic Governance
LookML keeps business logic in Git, which means metrics are version-controlled, peer-reviewed, and auditable. The same definitions power both charts and AI answers.
That setup is a big plus for teams that care about consistency. If the finance team, product team, and exec team all look at the same KPI, they’re pulling from the same source of truth.
The downside is the setup time. Mature LookML usually takes weeks or months of analytics engineering work [5].
Warehouse Actionability
Looker connects to Snowflake, BigQuery, Redshift, and Postgres, with the best fit for Google Cloud and BigQuery [2][7].
In plain terms, that makes Looker a strong pick for BigQuery-centric teams. Its embedded BI API is also among the strongest in the market [7], which is a big deal for enterprises that need to surface governed metrics inside customer-facing products.
That’s why Looker tends to be a better fit for governed, warehouse-backed reporting than for free-form AI exploration.
Dashboarding and Delivery
Looker is sold by custom quote, with viewer seats usually landing at $30–$60 per month at scale [3]. Total cost of ownership often runs high because the platform assumes you have analytics engineers maintaining the model [7].
By 2026, a common setup is to keep Looker for high-signal governed dashboards while adding a separate AI analyst layer for the long tail of ad hoc Slack or Teams questions [3][4].
| Capability | Looker Details |
|---|---|
| Semantic Layer | LookML (Git-native, code-defined) |
| AI Integration | Gemini on modeled metrics only |
| Warehouse Connections | BigQuery (optimized), Snowflake, Redshift, Postgres |
| Setup Time | Weeks to months |
| Pricing | $30–$60/viewer/month at scale |
Hex shifts the comparison from centralized modeling to notebook-first analysis.
4. Hex
Hex is a collaborative, notebook-first BI platform built for AI-assisted exploratory analysis on live warehouse data. In plain English: it shines in analyst workflows and is less of a fit for centralized executive KPI reporting. For AI-first teams, Hex stands out for inspectable AI analysis and live warehouse access, but it offers less control than tools built around a centralized semantic layer. It fits analyst-led teams that want notebook-based AI work, dbt-aligned logic, and warehouse-native execution.
AI Agent Depth
Hex's Magic AI and Notebook Agent turn natural language into SQL or Python cells using text-to-SQL query tools that analysts can inspect, edit, and rerun right inside the notebook.[1][5]
That matters because the AI output isn't a black box. Analysts can see what the tool wrote, tweak it, and run it again without leaving the workflow.[1][5]
Semantic Governance
Hex supports semantic consistency through Context Studio, which acts as a lighter semantic layer for modeling and AI governance.[1]
The trade-off is pretty simple: governance is lighter than in tools built around a centralized semantic layer, while warehouse permissions stay in control. Hex also works with dbt models as a source of metric logic, which helps keep metric definitions aligned with transformation work.[1] If your team already uses dbt, that keeps the logic close to where the data work already happens.
Warehouse Actionability
Hex connects live to Snowflake, BigQuery, Redshift, Databricks, and Postgres. It also generates SQL directly from warehouse schema.[1]
Setup can take only a few hours, which lowers the barrier for teams that want to get moving fast.[5]
Dashboarding and Delivery
Hex lets analysts publish notebooks as interactive Data Apps that non-technical users can work with.[1]
Its pricing scales with analyst headcount, not viewer count. The Community tier is free for up to five notebooks, and the Team tier costs about $75/editor/month. Most paid plans include unlimited viewers.[1][5]
That pricing model makes sense for analyst-heavy teams. But if the main goal is broad self-serve access across an organization, it can feel a bit limiting.
| Capability | Hex Details |
|---|---|
| Primary User | Data analysts and data scientists |
| AI Interface | Magic AI and Notebook Agent for natural language to SQL/Python |
| Semantic Layer | Context Studio (lightweight) + dbt integration |
| Governance | Lighter than centralized semantic-layer tools; permissions inherited from the warehouse |
| Warehouse Connections | Snowflake, BigQuery, Redshift, Databricks, Postgres |
| Setup Time | A few hours |
| Pricing | Free Community tier; Team about $75/editor/month; most paid plans include unlimited viewers |
Next, the comparison shifts from notebook-first analysis to a more spreadsheet-like BI workflow.
5. Sigma Computing
If Hex is notebook-first, Sigma is the spreadsheet-native pick. It brings live warehouse data into a spreadsheet-like interface, which makes it a strong match for finance and ops teams that want warehouse-scale analysis without stepping outside the grid. That matters for AI-first teams when business users need governed analysis and write-back, not notebook-based work.
AI Agent Depth
Sigma’s AI assistant and AI Apps bring analysis into the spreadsheet workflow, demonstrating how AI agents reduce time-to-insight for business teams. Users can ask questions and take action on the results in the same place.
Semantic Governance
Data Models define metrics and lineage on top of the warehouse, acting as a semantic layer for self-service BI to keep numbers consistent and traceable. That’s especially helpful when finance and operations teams need dependable numbers for reporting and planning.
Warehouse Actionability
Sigma queries live data with no extracts and supports write-back for planning and forecasting.
Dashboards and Delivery
Sigma’s dashboards look and act more like interactive spreadsheets than chart-heavy dashboards. That spreadsheet-style interface makes it easier for business users to get started and helps self-serve analysis move faster [1].
| Capability | Sigma Computing |
|---|---|
| Primary User | Finance and ops teams; spreadsheet-native users |
| AI features | AI assistant (spreadsheet-style) and AI Apps for workflow-specific interfaces on warehouse data |
| Semantic Layer | Data Models (warehouse-centric metrics and lineage) |
| Live data and write-back | Live query (no extracts), write-back for planning and forecasting |
| Learning Curve | Low for business and data teams [1] |
6. Power BI
Power BI is Microsoft's native BI pick on this list. It's strong for governed dashboards, but less strong for warehouse-first AI outside Fabric. If your team already runs on Microsoft 365 and Fabric, Power BI will feel like a natural fit. Pro seats start at $14 per user per month, which looks good at first. But once you step outside the Microsoft stack, that value can fade fast. It tends to beat Tableau when Microsoft standardization and lower seat cost matter more than warehouse-native AI range.
AI Agent Depth
Power BI's AI story revolves around Copilot. It works best when your data lives in Fabric or in Power BI datasets. It doesn't work as directly on Snowflake, BigQuery, or Redshift. There's also a big catch on cost: full Copilot requires Fabric capacity at F64 or higher, which adds about $6,400 per month on top of per-user licensing [2].
Semantic Governance
Power BI has a mature semantic model layer, with row-level security and controls to keep metrics consistent. That's a big plus for teams that care about governed reporting. The tradeoff is that this layer is closely tied to the Microsoft Fabric ecosystem, so it's harder to extend across external warehouse setups. For Microsoft-standardized teams, that's usually fine. For mixed-stack teams, it can feel limiting.
Warehouse Actionability
Power BI connects to Snowflake, BigQuery, and Redshift, but Copilot is still strongest when the data is modeled in Fabric.
Dashboarding and Delivery
Power BI does a good job with recurring executive dashboards. That's one of its strong suits. Where it starts to struggle is with ad hoc reporting and questions, especially the back-and-forth, conversational analysis that AI-first teams now expect from a BI tool [3]. Put simply, it's good at governed delivery and less strong at chat-first analysis across mixed warehouse stacks.
The table below shows why that tradeoff matters for AI-first teams.
| Capability | Power BI |
|---|---|
| Primary User | Microsoft-committed enterprises |
| AI Features | Copilot (requires Fabric F64, ~$6,400/month) [2] |
| Semantic Layer | Mature semantic model within Microsoft Fabric ecosystem |
| Live Data | Connects to Snowflake, BigQuery, and Redshift; AI optimized for Fabric-modeled data [3][2] |
| Dashboarding | Strong for recurring executive dashboards |
| Pricing | $14/user/month (Pro); full AI requires major cost barrier in Fabric capacity spend [2] |
7. Omni
If Power BI feels a bit too tied to Microsoft, Omni is a better pick for teams that want governed analytics on live warehouse data while staying inside their warehouse setup. It fits AI-first teams that need self-serve analysis with guardrails, plus a flexible exploration layer. In plain English, this is not just dashboard-only BI.
AI Agent Depth
Omni’s natural-language analytics tend to work best when the semantic model is already in place. If metric definitions are loose, answers can drift and start to conflict. That lines up directly with the article’s main governance test: if the logic isn’t set, the output gets shaky.
Semantic Governance
Omni uses a central model for reusable business logic, and it fits neatly with dbt. It also supports row-level permissions, which helps teams offer self-serve reporting without things getting messy. That shared model is a big part of what makes live analysis and write-back usable across a team.
The catch? You need to do the modeling work up front before self-serve analytics starts to feel dependable.
Warehouse Actionability
Omni connects straight to Snowflake, BigQuery, Redshift, and Postgres. It also supports write-back and operational workflows for planning and follow-up work. So instead of stopping at analysis, teams can move from warehouse data to shareable reporting and embedded workflows in the same flow.
Dashboarding and Delivery
Omni’s dashboarding supports self-serve reporting, embedded analytics, and dashboard sharing. That said, dashboard depth and implementation effort are still worth a close look before rolling it out.
| Capability | Omni |
|---|---|
| Primary User | Analyst-led teams wanting governed self-serve |
| AI Features | Natural-language analytics on governed data |
| Semantic Layer | Central governed model with dbt alignment and reusable business logic |
| Permissions | Row-level permissions |
| Live Data | Snowflake, BigQuery, Redshift, Postgres |
| Workflow Strength | Write-back and operational workflows |
| Dashboarding | Good for self-serve, embedded analytics, and sharing |
8. Mode
Mode is a strong match for analyst-heavy teams that work in SQL and Python notebooks, then publish curated apps for other people to use. In practice, that makes it a better fit for analyst-led workflows than for teams that want governed, chat-first analytics.
Against the four buying criteria - live warehouses, governed metrics, AI agent support, and delivery to business users - Mode does well with warehouse access and analyst workflows. It falls short more on semantic governance and self-serve access for non-technical teams.
Agent Support
With Mode, analysts handle the analysis and then publish curated apps for others to consume. That setup works well when analysts are the ones driving the work.
But it doesn't give non-technical users natural language self-service. So if your team wants people across the business to ask questions directly and get answers on their own using natural language interfaces, Mode isn't built around that use case.
Semantic Governance
Mode does not show a clearly documented native semantic layer or shared metric store. Because of that, teams should verify how metric governance works before moving forward.
That matters more than it may seem at first glance. If each team defines the same KPI in a different way, reporting can drift fast.
Warehouse Actionability
Mode connects to live warehouses and delivers results through published apps. That makes it a solid option for teams that want analysts to work directly on live data and package the output for other users.
| Capability | Mode |
|---|---|
| Primary User | SQL/Python analysts publishing apps |
| AI Features | No documented native natural-language layer for non-technical users |
| Semantic Layer | No clearly documented native semantic layer |
| Live Data | Yes, live warehouse connections supported |
| Workflow Strength | Analyst-led notebook workflows with app-style distribution |
| Dashboarding | Curated apps; limited self-serve for non-technical stakeholders |
Next is Qlik Sense, which shifts the comparison toward associative analytics and governed visual exploration.
9. Qlik Sense
Qlik Sense (Qlik Cloud Analytics) works best for governed, multi-source analysis on live warehouse data. Its associative engine helps people follow relationships across datasets that standard linear query paths can miss. That gives Qlik an edge when teams need governed discovery, not just static dashboards.
AI Agent Depth
Qlik includes generative AI assistants and automated machine learning for driver analysis, anomaly review, and guided exploration.
Semantic Governance
Governance and access control are usually handled at the report or dashboard level. That setup works well for repeatable executive metrics and governed self-service analytics for compliance reporting.
The downside is pretty simple: when someone asks an ad hoc question that sits outside the model, an analyst often has to step in. That can slow self-serve use.
Warehouse Actionability
Qlik connects to Snowflake, BigQuery, Redshift, and Postgres. So if a team needs to relate data across several sources and keep an eye on production KPIs, Qlik makes a lot of sense.
It performs well for standing operational views, but it is less nimble for live ad hoc questions.
Dashboarding and Delivery
Qlik's capacity-based licensing can make broad dashboard distribution easier by lowering the marginal cost of basic viewers. The learning curve is steeper than Tableau's drag-and-drop authoring because Qlik's associative modeling approach takes more dedicated training.
That said, the tradeoff is clear: you get more flexible, multi-source data discovery. Qlik is a better fit for broad, governed distribution and exploratory discovery across complex data.
| Capability | Qlik Sense |
|---|---|
| Primary User | Enterprise analytics teams and BI consumers |
| AI Features | Generative AI assistants and automated ML for guided exploration |
| Semantic Layer | Associative engine; governance and access control at report/dashboard level |
| Live Data | Snowflake, BigQuery, Redshift, Postgres |
| Workflow Strength | Multi-source discovery; compliance and audit reporting |
| Dashboarding | Strong for standing dashboards and broad distribution |
How Each Platform Performs on the Four Buying Criteria
Four criteria separate the strongest Tableau alternatives for AI-first teams: AI agent depth, semantic governance, warehouse actionability, and dashboarding and delivery. No tool wins all four. The smart move is to pick based on the two criteria that matter most for your team.
The platform reviews earlier in the article go deeper. This section pulls the tradeoffs into one place, so you can see what matters day to day.
AI Agent Depth
Start with how each platform handles agent output. That usually comes down to one of three things: inspectable SQL, conversational search, or AI sitting on top of a governed model.
Querio stands out for inspectable SQL/Python. ThoughtSpot is strongest on conversational search. Hex works well for analyst-led SQL/Python workflows.
Looker's Gemini assistant still depends on LookML to keep answers reliable. Power BI Copilot comes with a major Fabric cost hurdle. Omni's natural-language analytics tend to work best when the semantic model is already set up. Mode stays focused on analyst-led SQL generation. Qlik Sense is better for governed visual analysis than agent-first workflows.
Semantic Governance
This is where the market splits most clearly. Some tools lean on code-defined governance. Others use centralized semantic layers. A few rely on lighter context models.
Looker's LookML gives you code-defined governance with Git-native metric consistency, but it also asks for steady analytics engineering work. Querio uses a context layer that stores definitions, joins, and trusted queries as plain SQL, Markdown, and Python files synced to GitHub next to your dbt project. That means governed context can be reused across the app, Slack, Teams, Claude, or any MCP client. Qlik Sense also applies a semantic layer for metric consistency, though setup is more implementation-heavy than with AI-native tools [3].
If a tool has no governed metric layer, two teams can ask the same question and get two different numbers. That’s not a small issue. It’s how reporting trust starts to break.
Governance matters most when the platform can work on current warehouse data.
Warehouse Actionability
Here, the big line is write-back versus read-only live querying.
Sigma stands out because it supports write-back through input tables. That matters when teams need to send decisions back into the warehouse instead of stopping at analysis. Omni also supports write-back along with live querying.
Querio, ThoughtSpot, Hex, and Mode all query live data without extracts or CSV round-trips. Looker is especially strong in BigQuery and GCP setups, while Power BI supports both DirectQuery and extracts.
Dashboarding and Delivery
This category is less about making charts and more about how answers reach people.
Querio sends scheduled answers straight to Slack, Teams, or email from notebook-based dashboards. ThoughtSpot leads with Liveboards and an embedded SDK, which makes it a strong fit for customer-facing deployments. Power BI ties in tightly with Microsoft 365. Hex turns notebooks into shareable data apps.
The table below condenses the comparison across the four buying criteria.
| Tool | AI Agent Depth | Semantic Governance | Warehouse Actionability | Dashboarding & Delivery |
|---|---|---|---|---|
| Querio | High - inspectable SQL/Python in a reactive notebook | Governed context layer synced to GitHub; dbt-compatible | Live-query only; no extracts or CSV round-trips | Reactive notebooks → dashboards; Slack/Teams/email delivery |
| ThoughtSpot | High - conversational search over live data | Governed definitions via SpotterModel | Live-query | Liveboards; embedded SDK |
| Looker | Moderate - Gemini on modeled metrics | Strong via LookML; code-defined, Git-native | Live-query; native in BigQuery/GCP | Governed Explores; embedded reports |
| Hex | High - analyst-led SQL/Python workflows | Lightweight context layer; dbt sync | Live-query | Published notebook apps |
| Sigma | Moderate - spreadsheet-native workflows | Data Models; warehouse-centric metrics | Live-query + write-back | Spreadsheet-native dashboards |
| Power BI | Moderate - Copilot (major Fabric cost hurdle) | Semantic model within Microsoft Fabric | DirectQuery or extracts | Teams/Excel/M365 integration |
| Omni | Moderate - governed natural-language analytics | Central governed model; dbt-aligned | Live-query + write-back | Self-serve, embedded analytics, and sharing |
| Mode | Moderate - analyst-led SQL generation | Analyst-owned; no native semantic layer | Live-query | Published notebook apps |
| Qlik Sense | Moderate - dashboard-first BI | Semantic layer for consistent metrics | Live-query | Governed dashboards and reports |
Pros and Cons of Each Tool
The four-criteria breakdown above shows where each platform stands out. This table makes the tradeoff clearer: when you pick one tool, you also accept what it doesn't do as well. Put simply, each platform leans toward a different blend of governance, AI, and delivery.
| Tool | Key Pros | Key Cons | Best Buyer Profile |
|---|---|---|---|
| Querio | Inspectable SQL/Python; governed context layer synced to GitHub; live warehouse connections; Slack, Teams, and MCP delivery | Requires a warehouse-first operating model; not an extract-and-spreadsheet tool | Lean data teams (1–5 people) at B2B SaaS, fintech, or healthcare wanting auditable, self-serve analytics |
| ThoughtSpot | Conversational search over live data; underlying query is viewable | Starts at $25/user/month [4]; semantic model requires ongoing maintenance | Business-user-heavy teams that need broad self-serve exploration |
| Looker | LookML governance; consistent metric definitions | Natural-language accuracy depends on LookML model quality | Enterprises where metric consistency is non-negotiable |
| Hex | Collaborative notebook platform; SQL/Python; Notebook Agent for building data apps | More notebook-centric than dashboard-centric | Analyst-heavy teams that want to publish shareable data apps |
| Sigma Computing | Spreadsheet-style interface; live-queries cloud warehouses without extracts [7] | Better for spreadsheet-style exploration than chat-first analysis | Finance and ops teams that live in spreadsheets |
| Power BI | Pro seats at $14/user/month [2] | Full Copilot requires Fabric capacity at F64 or higher, about $6,400/month, on top of Pro seats [2] | Microsoft-standardized organizations |
| Omni | Central governed model; live warehouse access; write-back for operational workflows | Requires upfront modeling; dashboard depth and implementation effort need validation | Teams comparing fit in their own warehouse environment |
| Mode | Strong for analyst-led SQL/Python workflows and published apps | Weak semantic governance; limited self-serve for non-technical users | Analyst-led teams that want to test workflow fit directly |
| Qlik Sense | Associative engine for exploring data relationships across multiple sources [7] | Better suited to governed exploratory BI than to chat-first workflows | Enterprises with complex, multi-source data environments |
The main thing to check is simple: Can you inspect the AI's output, and is it tied to governed metric definitions? That's the filter that helps narrow your shortlist before moving into the choice guide below.
Which Tool to Choose
Choose based on workflow, not feature count. The best Tableau alternative is the one that lines up with how your team queries data, governs definitions, and gets answers to people.
The table below turns those four criteria into a short buying list.
| Buyer Need | Best Fit |
|---|---|
| Startup / lean data team | Querio |
| Enterprise governance | Looker |
| Embedded BI in a product | ThoughtSpot |
| Chat-first / Slack-native analysis | Querio |
| Notebook-driven analysis | Hex |
| Business-user self-serve | ThoughtSpot |
| Microsoft-standardized org | Power BI |
For lean data teams, Querio is the best match when the goal is inspectable AI output tied to a governed context layer.
Hex makes the most sense for analyst-heavy teams that want to publish interactive data apps from notebooks. Looker is the safer pick when metric definitions need to stay consistent across a large company. And if you need embedded analytics in a customer-facing product, ThoughtSpot's SDK is built for that job.
If your company runs on Microsoft, Power BI is still appealing at $14/user/month. But be honest about total cost: if you want full Copilot functionality, you'll likely need Fabric capacity, which starts at about $6,400/month for F64.
These are the strongest AI-first options, but Tableau still has a place in a few cases. It stands out when teams are deep in the Salesforce ecosystem or when polished dashboard design matters most.
Start with metric definitions first. Nail down what revenue means, how churn gets calculated, and which joins your team trusts. Then pick the tool that shows those definitions clearly and makes verification simple. As Valiotti Data puts it:
"A tool that is right 85% of the time, with no way to know which 15% is wrong, is slower than the analyst it replaced." [2]
FAQs
::: faq
How should I choose between governed BI and chat-first analytics?
Choose the tool based on the job: governed BI for a reliable, repeatable source of truth, and chat-first analytics for flexible ad-hoc work.
Governed BI is the better fit for executive, operational, and compliance reporting because it relies on consistent, audited metrics. Chat-first analytics works better for quick self-serve questions, especially when the exact question is still taking shape. In many teams, both are used together and connected to a shared governed semantic layer so metrics don’t drift. :::
::: faq
Do I need a semantic layer before using AI for BI?
Yes, in almost every case.
Some schema-first tools can pull useful insights from raw data on day one. But there’s a catch: results can get inconsistent when the AI recalculates metrics like revenue or churn in different ways from one prompt to the next.
A governed semantic layer gives AI one source of truth. That means it works from certified definitions instead of making its best guess.
Without that layer, teams run into metric drift and conflicting answers to the same question. :::
::: faq
Which option is best for a small data team?
It comes down to your stack and the kind of workflow you need most. If you want governed self-serve analytics on live data without a heavy enterprise setup, Querio is a strong fit.
Already running on Microsoft 365? Power BI with Copilot may be the best match. If your team prefers search-first analytics, look at ThoughtSpot. For analyst teams that live in notebooks, Hex is often the top pick.
No matter which tool you choose, a governed semantic layer is critical if you want AI answers to stay consistent. :::