Business Intelligence
Embedded Analytics Tools & Platforms Guide
Embedded analytics brings live, governed data into apps: interactive dashboards, semantic layers, AI tools, and criteria to evaluate platforms and rollouts.
Embedded analytics integrates live data insights directly into the tools you use daily, eliminating the need for separate systems. It allows users to access real-time metrics, track trends, and make decisions without switching platforms. For SaaS, fintech, and e-commerce businesses, embedded analytics enhances both customer experience and internal decision-making by providing instant access to actionable data.
Key Highlights:
What It Does: Embeds live, interactive dashboards and reports within apps.
Why It Matters: Reduces support tickets, speeds up decisions, and adds value for users.
Top Features to Look For: Real-time data connections, interactive dashboards, semantic layers for consistent metrics, and AI-powered business intelligence tools.
Example Platform: Querio connects directly to data warehouses like Snowflake and BigQuery, ensuring accurate, real-time insights without duplicating data.
This guide explains how embedded analytics works, its benefits, and what to consider when choosing a platform.
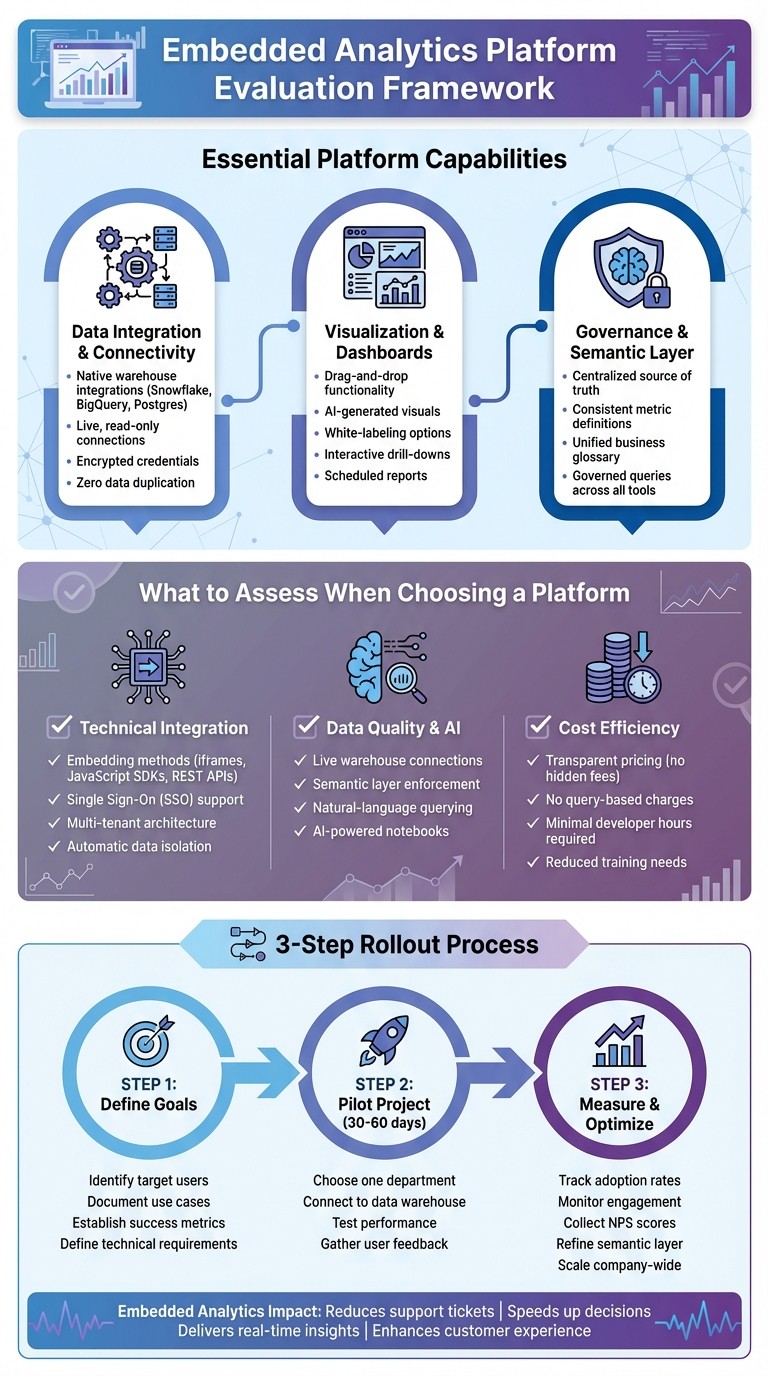
Embedded Analytics Platform Evaluation Framework: Key Features and Selection Criteria
Core Features of Embedded Analytics Platforms
Data Integration and Connectivity
For embedded analytics to work seamlessly, it must connect directly to live data sources. Modern platforms should offer native integrations with data warehouses like Snowflake, BigQuery, and Postgres. This avoids relying on outdated copies or extracts that can quickly become irrelevant. By using live, read-only connections secured with encrypted credentials, users can access the most up-to-date data without compromising security or incurring extra storage costs.
Querio takes this approach by connecting directly to your data warehouse with encrypted credentials, ensuring live access to your source data. There’s no need for duplication, which means no additional storage fees or syncing delays. When users interact with dashboards or ask questions, they’re always working with real-time data - not outdated snapshots from previous ETL processes. Plus, since the data never leaves your infrastructure, compliance and control are maintained. This real-time connection is the backbone of Querio’s intuitive and interactive data visualizations.
Visualization and Embedded Dashboards
Today’s users don’t want to jump between tools to find insights - they expect analytics to be embedded directly within their workflows. Effective dashboards should offer drag-and-drop functionality, adapt to any screen size, and allow for white-labeling with top analytics tools so the analytics feel like a natural part of your application. Interactive features such as drill-downs and filters should be accessible without requiring users to write SQL queries.
Querio delivers on these expectations with dashboards that combine drag-and-drop simplicity and AI-enhanced visualizations. For instance, a product manager can type "show monthly active users by region" and instantly receive a polished chart. These visuals can be embedded into customer-facing apps or internal tools, with full control over branding and layout. Additionally, scheduled reports ensure executives stay informed without needing to log into another platform. All visualizations pull from a governed data layer, ensuring consistency and reliability across the board.
Governance and Consistency with Semantic Layers
A lack of governance can lead to conflicting metrics and confusion. A semantic layer solves this by acting as a centralized source of truth. It defines key elements like table relationships, the meaning of metrics such as "revenue", and which fields are safe for users to query. Data teams can set these rules once, ensuring every query - whether from a dashboard, an analyst, or an AI assistant - follows the same logic.
Querio’s semantic layer allows data teams to configure joins, metrics, and business glossary terms in one unified location. For example, when a finance team member asks about "net revenue" or a product manager queries "MRR", both receive answers aligned with the company’s official definitions. This unified semantic layer ensures consistent governance across dashboards, scheduled reports, and AI-powered notebooks. By standardizing the rules, Querio provides reliable insights that support fast, data-driven decisions.
What is Embedded Analytics? Explained in 15 Minutes with Examples
How to Evaluate Embedded Analytics Platforms
Embedded analytics has become a key element in decision-making, making it essential to assess platforms based on how well they integrate technically, handle governed data, and manage costs. Beyond core features like data connectivity and governance, it's also important to consider scalability, AI-driven insights, and overall efficiency.
Technical Integration and Scalability
The way a platform integrates into your existing system is critical. Look for support for embedding methods like iframes, JavaScript SDKs, and REST APIs, as these provide flexibility. Single Sign-On (SSO) is another must-have for seamless user access. Scalability is equally important - multi-tenant architecture should automatically isolate data for different customers, so you don’t have to create custom security measures for each new client.
Querio simplifies integration into SaaS workflows through standard embedding options and includes built-in SSO for easy access. Its live warehouse integration and multi-tenant architecture ensure that each customer only sees their own data, removing the need for custom security configurations. This streamlined approach minimizes infrastructure complexity and allows your development team to focus on building core product features rather than managing analytics infrastructure. These robust technical foundations also enhance data governance and enable advanced AI capabilities.
Governed Data and AI-Driven Insights
Inconsistent or outdated data can erode trust in analytics. A platform should offer live connections to your data warehouse and include a semantic layer that enforces consistent business rules across all queries. AI features should be practical, helping your analysts save time rather than just showcasing flashy capabilities. Tools like natural-language querying and AI-generated visualizations are only useful if they’re built on a solid foundation of governed data.
Querio’s semantic layer ensures that every query - whether it comes from a business user or an AI tool - adheres to the logic defined by your data team. Its AI-powered notebooks allow users to write Python or SQL with intelligent suggestions or simply ask questions in plain English to generate accurate charts instantly. Because the semantic layer governs all queries, you avoid issues like conflicting metrics or non-compliant queries. This combination of live data, strong governance, and AI tools reduces the workload for your analysts while delivering faster insights to users.
Cost Efficiency and Value
Evaluating cost involves more than just the initial price tag. Hidden expenses, such as developer hours, maintenance, and training, can quickly add up. Be sure to ask vendors about potential charges for queries, storage, or other usage-based fees. Platforms that require frequent tuning or custom integrations can drain engineering resources better spent on developing your core product.
Querio offers straightforward pricing with no hidden query fees or usage-based tiers that escalate as your business grows. It leverages your existing infrastructure, avoiding extra storage costs, and its drag-and-drop interface, along with natural-language querying, shortens the learning curve. The governed semantic layer also reduces back-and-forth between teams, cutting down on support tickets and freeing up your data analysts. With Querio, you’re investing in a premium solution that simplifies analytics rather than creating additional workload.
Common Architectures and Implementation Patterns
Embedded analytics typically follow three main patterns that align with the growth of your product. Choosing the right architecture ensures your analytics system can evolve alongside your needs. Let’s break down these approaches and their roles in creating a better user experience.
Warehouse-Centric Analytics
This setup taps directly into your cloud data warehouse, eliminating the need to duplicate data into separate analytics databases. Every chart and dashboard pulls live data from the warehouse, so users always see the most current information - no waiting for batch jobs or ETL pipelines to finish.
Querio connects to your warehouse using read-only, encrypted credentials, keeping production data secure while delivering real-time insights. A governed semantic layer acts as a bridge between users and the warehouse, ensuring consistent definitions and data accuracy. This warehouse-native method avoids data duplication and strengthens the reliability of your analytics.
Application-Embedded Dashboards
In this approach, dashboards are embedded directly into your SaaS application, offering customers a tailored analytics experience without requiring a separate login. A multi-tenant design ensures that each customer sees only their own data.
Querio’s embedded analytics integrate seamlessly into your application, delivering intuitive dashboards right where users need them. Governed by the semantic layer, these dashboards provide accurate and consistent data. This model works especially well for customer-facing analytics, where real-time, personalized insights are key.
Advanced Workflows with AI-Powered Notebooks
For users who need more than pre-built dashboards, AI-powered notebooks offer the flexibility to write Python or SQL, build predictive models, or explore data interactively. These notebooks provide advanced capabilities while maintaining governance and live connections to your warehouse.
Querio’s in-house AI Python notebook is designed to meet these needs. It offers intelligent code suggestions and plain-English querying, enabling analysts to generate accurate visuals quickly. By combining self-service dashboards with deep technical analysis, notebooks provide a unified platform for all levels of data exploration - all while connecting directly to your live warehouse.
How to Select and Roll Out Embedded Analytics
Before choosing an embedded analytics platform, it’s crucial to understand your target users, the questions they need answers to, and where analytics will fit into your workflows. Start by outlining specific use cases - whether it’s data products for your customers, internal sales reporting, or dashboards for executives. Identify the data sources you’ll connect and the insights users will find most valuable. Laying this groundwork ensures you’re addressing practical needs. Then, clearly define your analytics goals to set the foundation for a smooth rollout.
Define Goals and Requirements
Start by documenting who your target users are and their level of technical expertise. Decide what success means for your organization - whether it’s quicker decisions, fewer support tickets, or new revenue streams from analytics features. Think about whether you’ll need tools like AI-powered querying for natural language questions or if pre-built dashboards will meet your needs. Establish key metrics to take full advantage of Querio’s semantic layer and ensure your goals are measurable.
Start with a Pilot Project
Kick off with a focused pilot project lasting 30 to 60 days. Choose one area, like data analytics for product managers, and connect it directly to your data warehouse. This allows you to test the platform’s ability to handle your data volume, measure dashboard performance, and evaluate how easily it integrates into your application. Querio simplifies this process by connecting directly to your data warehouse without requiring data duplication, making it easier to scale from a single department to company-wide analytics. Collect user feedback during the pilot, track improvements like faster report generation, and fine-tune your approach before expanding the rollout.
Measure Success and Optimize
Track key metrics like user adoption, engagement rates, and the speed of decision-making. Metrics such as Net Promoter Score (NPS) and the number of dashboards created can indicate how well the platform is performing. Querio also lets you monitor the most-used AI-generated queries, helping you refine your semantic layer for even faster insights. Regularly gather feedback, tweak dashboard designs, and plan for advanced features like AI-powered notebooks as your team’s analytics capabilities grow. By continuously optimizing, you’ll ensure your embedded analytics system evolves to meet your business needs effectively.
Conclusion
Embedded analytics has evolved static reporting into a tool for dynamic insights, helping businesses make quicker decisions and deliver better experiences for both internal teams and customers. In multi-tenant SaaS environments, the right analytics platform must ensure granular data security, handle high query volumes without performance dips, and manage costs predictably as usage grows.
Querio delivers on all these fronts. By connecting directly to your data warehouse and leveraging a semantic layer, Querio ensures governed, consistent data without duplication. Its combination of natural-language querying and purpose-built Python notebooks allows users to generate accurate charts in seconds and perform custom analyses - free from the constraints of rigid reporting systems.
When choosing an embedded analytics platform, prioritize solutions that grow with your needs while maintaining strong data governance. Seek platforms that support live data connections, offer unlimited viewer access, and provide AI-driven insights without surprise query fees. Querio simplifies data access for everyone, reducing dependency on analysts and empowering teams to make confident, data-informed decisions.
FAQs
How can embedded analytics enhance decision-making in SaaS applications?
Embedded analytics improves decision-making in SaaS applications by providing real-time insights right within the tools users already use. This seamless integration removes the hassle of switching between platforms, making workflows more efficient and saving valuable time.
With features like intuitive visualizations and customizable dashboards, embedded analytics transforms complex data into clear, easy-to-digest formats. This allows users to quickly make informed decisions, leveraging actionable insights that are tailored to their unique requirements.
What should I look for in an embedded analytics platform?
When selecting an embedded analytics platform, it's important to prioritize features that allow for smooth integration and the ability to grow alongside your business. Start by ensuring the platform offers API and connector support, making it simple to connect with your current applications. It should also handle increasing data volumes and user demands without sacrificing performance.
Key features to consider include customizable dashboards and reports that align with your specific business needs, mobile accessibility for insights anytime, anywhere, and powerful data visualizations that make complex information easier to understand. Additionally, platforms with multitenancy capabilities are ideal for serving multiple customers, and robust security features, such as detailed permission settings, are crucial for safeguarding sensitive data.
What role does a semantic layer play in ensuring data consistency and governance?
A semantic layer plays a key role in maintaining data consistency and governance by offering a unified structure for defining data, metrics, and business rules. It ensures that terminology is standardized and data quality is upheld, so everyone in the organization relies on the same trustworthy information.
Additionally, role-based permissions within the semantic layer safeguard sensitive data by restricting access to authorized individuals. This means only the right people can view or modify specific datasets. Together, these features promote better decision-making and help foster trust in your data across teams and tools.
Related Blog Posts


