Mastering ad hoc reporting for on-demand insights
Explore ad hoc reporting and learn how on-demand insights unlock faster, smarter decisions with practical steps, tips, and real-world examples.
https://www.youtube.com/watch?v=lgkX4X09ync
published
Outrank AI
ad hoc reporting, business intelligence, data analysis, self service analytics
ea7f4cc7-73a9-41c5-b5d6-10009b42cbff

Ad hoc reporting is all about getting answers to specific, immediate business questions by creating a one-time report. It’s not your regular scheduled update; think of it more like an on-demand investigation into your data. This approach gives anyone the power to dig into unexpected trends or quickly validate a hunch, without having to wait around for a formal analysis.
What Is Ad Hoc Reporting Really
Imagine you’re on a road trip with a printed map. It’s great for the route you planned yesterday, but it’s completely useless when you hit a surprise road closure. Now, picture switching to a live GPS app on your phone that instantly reroutes you. That's the difference between traditional, static reports and dynamic ad hoc reporting. It’s the business version of asking your GPS, "What's the absolute fastest way to get there right now?"
Standard reports are predictable. They show up on schedule, like a weekly sales summary, and they’re perfect for tracking well-known KPIs and measuring progress toward goals. But they fall short when it comes to answering the spontaneous, "what if" questions that pop up every day.
Ad hoc reporting fills this critical gap. It’s about turning business curiosity directly into data-driven insights, giving you the agility to navigate today's fast-changing markets.
This type of reporting gives you the freedom to investigate an odd-looking number, explore a potential new opportunity, or just satisfy a "what's going on here?" moment without filing a ticket with the data team and waiting days for an answer.
From Curiosity to Clarity
The real magic of ad hoc reporting is how it empowers teams across the entire company. This isn't just a tool for data analysts anymore. With the right setup, business users can ask their own questions and get immediate answers, which helps build a culture where decisions are truly informed by data.
Just think about these real-world situations where ad hoc analysis is a game-changer:
Marketing: A campaign manager sees a sudden traffic spike from a social media channel they weren't focused on. They can instantly generate an ad hoc report to see who these visitors are and what they're doing on the site.
Sales: A regional manager notices sales have dipped unexpectedly in what's usually a top-performing territory. A quick, one-off report can break down sales by rep, product, and customer to pinpoint the problem.
Operations: The support team is swamped with tickets. An operations manager can create a report on the fly to see which issues are causing the surge, what time of day it's happening, and which product versions are affected.
The Impact on Human Resources
This on-demand approach is also incredibly valuable for departments like Human Resources. To truly get a pulse on the workforce, HR teams often rely on advanced techniques like human resources analytics. For instance, an HR manager could use an ad hoc query to see if there’s a link between employee overtime hours and turnover rates in a specific department over the last three months.
At its core, ad hoc reporting is about two things: speed and specificity. Instead of being stuck with broad, historical data, it delivers targeted insights right when you need them most. This capability is a cornerstone of modern business intelligence reporting, shifting companies from being reactive to proactive by letting them adapt their strategies based on what the data is telling them right now.
Ad Hoc Reporting Compared To Other Analytics
In the data world, it's easy to get lost in a sea of similar-sounding terms. But when it comes to reporting, understanding the difference between ad hoc, scheduled, and self-serve analytics is crucial. They aren't competing ideas; they're complementary tools that, when used together, give you a complete picture of your business.
Let's use an analogy. Think of scheduled reporting as your annual health checkup. It’s the routine, predictable report—like a weekly sales dashboard or a monthly marketing KPI summary—that monitors your business's vital signs. These reports are great for tracking known metrics over time, but they can't always tell you why something suddenly changed.
That's where ad hoc reporting comes in. It's the diagnostic you run when that checkup reveals something unexpected, like a sudden drop in website conversions. An ad hoc report is a one-off investigation designed to answer a very specific question, right now. For example: "Which landing pages saw the biggest conversion drop last Tuesday?" It’s reactive, specific, and laser-focused on finding the root cause of an immediate business question.
Distinguishing Key Analytics Approaches
So, if scheduled reports show you what happened, ad hoc reports help you figure out why. But what makes this kind of on-the-fly investigation possible for everyone, not just data analysts?
This is the role of self-serve analytics. It isn't just another type of report; it’s the entire platform or environment that gives business users the power to dig into data themselves. A strong self-serve platform is the toolkit that makes true ad hoc reporting a reality for your whole team. It’s the difference between waiting in line for an analyst and being able to ask the data a question yourself and get an answer in seconds. As you explore this, you might also be curious about how traditional query methods stack up against newer, AI-powered ones. You can learn more about SQL vs AI-driven data exploration in our article to see how technology is making these deep dives easier than ever.
This process—moving from curiosity to insight—is what makes on-demand reporting so powerful for business teams.
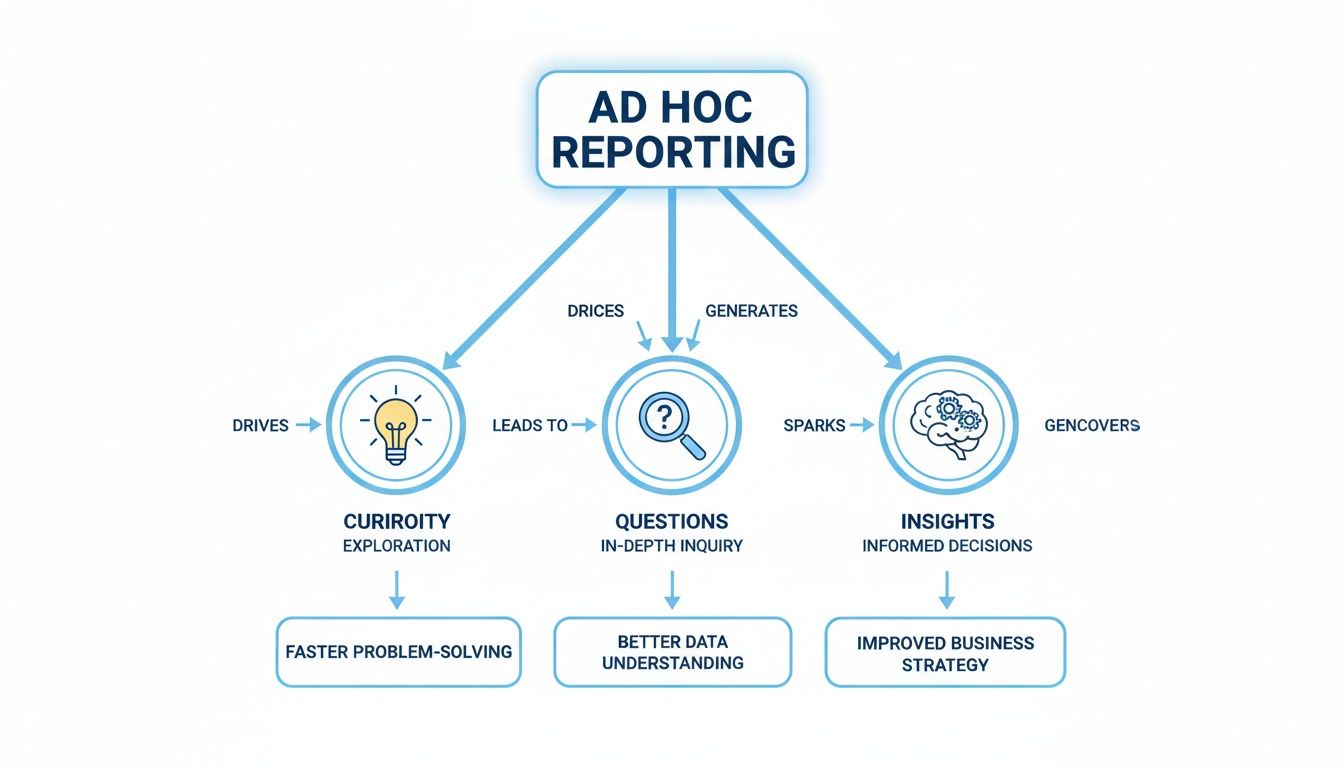
As you can see, it creates a flywheel effect where one question leads to another, driving deeper understanding and better decisions.
A Head-To-Head Comparison
To really nail down the differences, let's put these three approaches side-by-side. The table below breaks down how they differ across a few key attributes.
Comparing Reporting And Analytics Approaches
Attribute | Ad Hoc Reporting | Scheduled Reporting | Self-Serve Analytics |
|---|---|---|---|
Purpose | To answer a specific, one-time business question or investigate an anomaly. | To monitor known KPIs and track performance against goals on a regular basis. | To empower non-technical users to explore data and create their own reports. |
Frequency | On-demand, as needed. | Recurring (daily, weekly, monthly). | Continuous, user-driven exploration. |
User | Business users, managers, analysts. | Executives, team leads, stakeholders. | Anyone in the organization with a data question. |
Flexibility | High; report is built to answer a unique question. | Low; format and metrics are predefined. | Very high; users have freedom to query and visualize data. |
Speed | Immediate; designed for fast answers. | Delayed; delivered on a set schedule. | Instant; real-time query results. |
Example | "Why did our customer churn spike by 15% in the Midwest last month?" | "Show me the weekly sales performance for all regions." | An interactive platform where a user can ask questions in plain English. |
Ultimately, a smart data strategy doesn't choose one over the others—it uses all three. Scheduled reports flag potential issues, ad hoc reporting digs in to find the cause, and a self-serve analytics platform gives your entire team the tools they need to find answers on their own.
How Teams Use Ad Hoc Reporting to Win
Theory is great, but the real magic of ad hoc reporting happens when you see it in action. This isn't just about pulling numbers; it's about answering urgent, specific questions that can steer the entire direction of a company. When teams have this on-demand capability, they stop reacting to old news and start making proactive, intelligent decisions in the moment.

Let's get practical. We’ll look at a few real-world scenarios where asking one spontaneous question led to a game-changing insight. These examples show how ad hoc analysis can directly drive revenue, streamline operations, and create better customer experiences.
Sales Teams Uncovering Hidden Trends
Imagine a sales leader glancing at their usual weekly dashboard. On the surface, things look good—except for one glaring problem. The West Coast region, almost always a top performer, just saw its deal closure rate tank by 15% in the last two weeks. The standard report tells them what happened, but it offers zero clues as to why.
Instead of filing a ticket and waiting days for an analyst to dig in, the sales leader fires up an ad hoc query on the spot. They start asking a series of targeted questions:
Can I see the deal closure rate for each rep on the West Coast over the past month?
Now, compare the number of demos they completed versus the deals they actually closed.
Let's break down the lost deals by competitor and the reason cited.
In just a few minutes, a clear picture emerges. The report shows that two key competitors launched a surprise, aggressive pricing promotion aimed squarely at their core customers in that region. Armed with this knowledge, the leader can immediately build a counter-offer, arm their team with new talking points, and regain momentum. That’s ad hoc reporting in a nutshell: turning a sudden drop into a swift, actionable plan.
Marketing Managers Optimizing Spend in Real Time
Picture a marketing manager two weeks into a huge multi-channel campaign. The plan was to pour most of the budget into paid search, a channel that’s always been a reliable workhorse. But a quick check of the live dashboard reveals something worrying—clicks are high, but actual conversions are strangely low.
Is the budget going down the drain? The manager needs answers now, not next week. Using ad hoc reporting, they can instantly ask:
What's the conversion rate for each ad creative we're running?
Show me the cost per acquisition (CPA), broken down by demographic, for our social media ads.
Which landing page is driving the most sign-ups from our email blast?
The ad hoc report reveals a golden nugget of information: a specific video ad on social media, which got only a tiny slice of the budget, is bringing in conversions at half the CPA of the expensive search ads. The manager doesn't hesitate. They immediately shift a huge chunk of the budget from paid search to the high-performing social video, saving the campaign's ROI before it's too late. That kind of agility is only possible with on-demand data.
Product Managers Investigating User Behavior
A product team just rolled out a big new feature. The initial adoption numbers look great, but they need to know if people are actually finding it useful. A standard dashboard might only track the total number of clicks on the new feature's button, which doesn't tell the whole story.
A product manager can use ad hoc reporting to dig much deeper and understand the user experience. They can ask things like:
What percentage of users who tried the feature came back to use it more than once in the first week?
Which user segments are engaging with this feature the most?
Is there a correlation between using the new feature and overall session time or user retention?
The analysis uncovers something fascinating. While lots of users click the button once, only 10% come back to use it again. But for that dedicated 10%, their overall time spent in the app skyrockets by 30%. This tells the team the feature is incredibly valuable to those who master it, but it likely has an onboarding or discovery problem. They now know exactly where to focus their efforts: improving the user experience to drive that deeper engagement.
In today's fast-paced business environment, ad hoc reporting has become a cornerstone for agile decision-making, especially as market volatility surges. When policy shifts cause rapid risk reassessments, the demand for this kind of spontaneous analysis can spike dramatically. For instance, some sales teams use ad hoc queries for funnel tracking, uncovering issues like a 12% conversion drop between MQL to SQL in specific regions, which allows for immediate strategy pivots and can boost quarterly revenue forecasts by as much as 8%.
What all these examples really show is a fundamental shift in how work gets done. With modern tools that understand natural language, anyone can ask questions of their data—not just the experts. Curiosity becomes a real competitive advantage. This widespread access to data is exactly what makes self-service analytics such a powerful tool for data-driven teams.
Building a Successful Ad Hoc Reporting Strategy
Rolling out an ad hoc reporting system is about more than just buying new software. You’re building a framework that sparks curiosity without creating total data chaos. Without a solid plan, you're setting yourself up for a free-for-all where inconsistent definitions lead to conflicting reports, shattering the very trust you’re trying to build in your data.
A successful strategy really comes down to four things: establishing clear data governance, picking the right user-friendly tools, making sure your data is clean and easy to get to, and fostering a culture where people aren't afraid to ask questions. Get these right, and ad hoc reporting becomes a powerful engine for growth instead of a potential headache.

Establish Clear Data Governance
Before you let everyone loose to ask questions, you have to establish a single source of truth. Think of data governance as the official rulebook. It ensures everyone in the company is playing the same game with the same definitions. This is what stops the marketing team's "customer" count from being completely different from the sales team's.
To get your governance in order, focus on a few key areas:
Centralized Data Models: Define your most important business metrics in one place. When everyone pulls from the same verified source, the answers stay consistent no matter who's asking.
Access Controls: Not everyone needs to see everything. Use role-based permissions to make sure people only see the data relevant to their job, which keeps sensitive information protected.
Clear Ownership: Assign data stewards—people who are officially responsible for the quality and definitions of specific data sets, like customer records or financial data.
This structure puts up the guardrails you need for safe and productive data exploration.
Choose User-Friendly Tools
The whole point of ad hoc reporting is to make data accessible to people who don't live and breathe code. If your team has to write complex SQL or wrestle with a clunky interface just to get an answer, they’ll fall back into old habits and just ping the data team. You’ll be right back where you started.
Look for tools that are genuinely easy to use. A platform with a natural language interface, like Querio's "Ask your data" feature, completely removes the technical barrier. It allows a product manager to just type, "Show me user engagement for our new feature by region," and get a chart back instantly. No coding required. The tool should feel intuitive and invite people to explore, not intimidate them.
A thoughtful strategy is the difference between data democratization and data anarchy. By setting clear rules and providing the right tools, you empower teams to find answers safely and efficiently, fostering a culture of confident, data-driven decision-making.
The flexibility of modern tools is already changing how teams work, especially in fast-paced departments like FP&A. In fact, by 2026, it's expected that top ad hoc tools will handle 70% of all unscheduled queries for busy teams. That's a massive leap from the 30% managed by older, legacy systems. This change is being supercharged by Generative AI, with 78% of organizations now using it for features like embedded "Ask your data" bars that can spit out accurate visuals in seconds. Discover more insights about how AI is reshaping analytics.
Ensure Data is Clean and Accessible
Your reports are only as good as the data powering them. It's the classic "garbage in, garbage out" problem. A winning strategy depends on a real commitment to data quality and accessibility. That means your data has to be clean, current, and structured in a way that actually makes sense for analysis.
Invest time in your data pipeline to automate cleaning and transformation. This makes sure that when someone asks a question, the underlying data is trustworthy. On top of that, your reporting tool needs to connect seamlessly to all your key data sources—from your product database to your CRM—to paint a complete picture of the business.
Foster a Culture of Data Inquiry
Finally, tools and rules are only half the battle. You also need to build a culture where people feel empowered and even encouraged to ask questions. This is about more than just giving them a login; it requires training, support, and leading by example.
Start by running training sessions that show teams how to use the tools to solve their own real-world problems. Create a support channel where users can ask for help or share cool things they've discovered. Most importantly, leaders need to walk the walk by using ad hoc reports in meetings to guide conversations and justify decisions. When people see data being used to find real answers, they'll start doing it themselves.
Common Ad Hoc Reporting Pitfalls to Avoid
Giving your teams ad hoc reporting capabilities is a bit like handing over the keys to a sports car—it’s incredibly powerful, but you need some guardrails in place. Without a clear set of rules and the right technology, you can easily create more problems than you solve, turning a tool for agility into a source of chaos.
While the upsides are huge, a poorly planned rollout can quickly get out of hand. Understanding the most common pitfalls is the first step toward building a healthy reporting culture. Most of these challenges boil down to three things: data integrity, system performance, and security.
If you can see these issues coming, you can put solutions in place before they become major headaches.
The Danger of Data Chaos
The biggest and most immediate risk of opening up data access is creating a “wild west” of conflicting reports. This is what happens when different teams, or even different people on the same team, use slightly different definitions for the same business metric.
For example, imagine your marketing team defines a "new customer" as anyone who signs up for a free trial. At the same time, the sales team only counts someone as a "new customer" once they've actually paid. Their reports will never, ever line up, and you’ll waste entire meetings arguing about whose number is “right.”
This kind of inconsistency completely erodes trust in the data. When leadership sees two different numbers for the same KPI, they start to doubt all the numbers. The entire analytics program gets undermined.
The only way to prevent this is to establish a single source of truth. This means creating a governed, centralized data model where key terms are defined once and for all. When everyone is pulling from the same set of verified definitions, their reports will remain consistent, no matter who’s building them.
A single, unreliable report can do more damage than no report at all. Data chaos undermines confidence and leads to decision-making based on flawed assumptions, turning a valuable asset into a liability.
Poor Performance and Inefficient Queries
Another classic pitfall is when your entire system grinds to a halt. When you have dozens of people running complex, on-the-fly queries directly against your production database, things can get slow—and not just for the person running the report. We’re talking about slowdowns that can impact your actual customers.
An inefficient query written by a non-technical user can easily lock up critical tables, bringing your app or service to its knees. This is especially true if you’re trying to run this on older systems that just weren't designed for this kind of workload.
Protecting your operational databases has to be a top priority. Here’s how you can do it:
Use a Dedicated Analytics Database: The best practice is to replicate your production data into a separate data warehouse or analytics-focused database. This creates a safe space for exploration that is completely isolated from your live systems.
Lean on Query Optimization: Modern BI and analytics platforms are smart. Many have built-in optimizers that can take a clunky, inefficient query written by a business user and rewrite it behind the scenes to be far more performant.
Manage Your Resources: You can also implement controls that limit how complex a query can be or how long it's allowed to run. This prevents one single "runaway" report from hogging all the system's resources.
Overlooking Critical Security Risks
Finally, and this is a big one, you absolutely cannot open up data access without rock-solid security protocols. Just giving every user a key to the entire data kingdom is a recipe for a compliance nightmare, especially when you're dealing with sensitive customer PII or confidential financial records.
Security can’t be an afterthought here; it has to be baked in from the very beginning. This is where modern embedded analytics tools really shine, as they provide the essential guardrails you need.
Make sure any tool you use has these key security features:
Role-Based Access Controls (RBAC): This is foundational. It ensures that users can only see the datasets and fields that are relevant to their specific job function. No more, no less.
Row-Level Security (RLS): This is a game-changer. RLS filters data dynamically based on who is logged in. This allows you to build one dashboard that multiple people can use, but they will each only see the data they’re authorized to see—for instance, a regional sales manager only sees numbers for their specific territory.
Single Sign-On (SSO): Integrating with your company’s identity provider (like Okta or Azure AD) streamlines user management and ensures your company's authentication policies are enforced consistently.
By tackling these potential issues head-on, you can create an ad hoc reporting environment that’s not just powerful, but also secure, reliable, and trusted by everyone in the organization.
The Future of Ad Hoc Reporting is AI-Powered
The true potential of ad hoc reporting has always been about giving anyone—regardless of their technical background—the power to ask a direct question and get a reliable answer. For a long time, the biggest hurdle was the interface itself. You needed to know your way around a specific tool or, worse, a query language. Now, artificial intelligence is finally breaking down that wall, turning ad hoc analysis from a specialist's job into an everyday capability for everyone.
AI-powered systems are doing this with natural language interfaces. It sounds technical, but it’s really just a fancy way of saying you can ask questions in plain English. Instead of messing around with report builders or writing code, a marketing manager can just type, "Compare customer churn last quarter by subscription plan," and get a clear chart back instantly. This completely changes how we interact with data.
When answers are just a question away, every team can operate at the speed of its own curiosity. The cycle of asking, learning, and acting gets a whole lot faster.
The Rise of Natural Language and Embedded Analytics
What’s really happening here is that AI is making ad hoc reporting feel less like a formal process and more like a conversation. A platform like Querio isn't just a search bar; it's an intelligent partner that understands your business. This lets you ask follow-up questions, just like you would with a human analyst. "Okay, now show me that for just the enterprise plan," or "What was the biggest reason for that churn?"
This conversational approach is most powerful when it’s delivered through embedded analytics. Think about it: instead of forcing your team to log into a separate BI tool, you can put an "Ask your data" bar right inside the apps they already use all day. You’re meeting them where they are, making deep analysis a seamless part of their existing workflow.
This shift from static dashboards to dynamic, conversational insights is what's driving so much growth in the data world. The hunger for on-the-fly analysis is a huge reason the global Data Science and Predictive Analytics Market is projected to jump from $19.54 billion in 2025 to $71.34 billion by 2031. We see it in practice, too, with a massive 411% year-over-year increase in enterprise machine learning models in production as these ad hoc investigations grow into full-fledged AI pipelines. Learn more about the market's explosive growth.
From Internal Tool to Customer-Facing Value
This isn't just a game-changer for your internal teams. Embedded analytics gives you a way to put ad hoc reporting power directly into your customers' hands, right inside your own product. Imagine letting your clients securely analyze their own data without ever leaving your platform.
This opens up a few huge advantages:
Increased Product Stickiness: When customers can easily find answers and see the value your product provides, they’re much less likely to leave.
Competitive Differentiation: Offering sophisticated, self-serve analytics is a powerful feature that can make your product stand out from the crowd.
Reduced Support Load: If you empower customers to answer their own questions, they’ll file fewer support tickets and data requests. You can read our guide on reducing ad hoc analysis bottlenecks with AI for a deeper dive on this.
At the end of the day, AI is making the old promise of "data democratization" feel real. By combining natural language with secure embedded analytics, we can finally build a world where fast, intuitive, and reliable ad hoc reporting is available to everyone—both inside and outside an organization.
Got Questions? We've Got Answers
Even with the best plan in place, a few common questions always pop up when teams first start digging into ad hoc reporting. Let's tackle some of the most frequent ones we hear from business leaders.
Ad Hoc Reporting vs. Data Discovery: What's the Difference?
This one trips people up a lot, but the distinction is pretty simple. Think of ad hoc reporting as being on a mission to answer a specific, known question. You have a target in mind, like figuring out, "Why did our sales in the Midwest suddenly drop 15% last month?" You need a direct answer, and you need it now.
Data discovery, on the other hand, is more like exploring. You're sifting through your data without a predefined question, just looking for interesting patterns, anomalies, or insights you didn't even know to look for. It’s the difference between using a GPS to find a specific address (ad hoc) and going for a drive to see what you can find (discovery).
How Can We Guarantee the Data Is Accurate?
This is a big one. How can you really trust a one-off report that someone just pulled together? The secret isn't in the report itself, but in the foundation it's built on. Trustworthy ad hoc reporting all comes down to solid data governance.
The key is to have a centralized, governed data model that acts as a single source of truth. When everyone is pulling from the same well—where terms like "active user" or "churn rate" have one, agreed-upon definition—you eliminate the classic problem of two different reports showing two different realities. If your source data is trusted, the ad hoc insights you pull from it will be, too.
Can Our Non-Technical Staff Really Do This?
Absolutely. But you can't just hand them a complex, old-school BI tool and expect magic. The right platform makes all the difference. Modern tools with natural language interfaces completely change the game, letting your team ask questions in plain English, just like they would ask a colleague.
This is a huge shift. The focus moves away from knowing how to code a query or build a complex report and toward knowing what business questions to ask. When the tool is intuitive, anyone’s curiosity can lead to a clear, data-backed answer without them ever seeing a line of code.
Ready to give your teams the power to get fast, reliable, and secure answers on their own? See how Querio's AI-powered platform lets anyone ask questions and get insights in seconds. Explore Querio today.

