Business Intelligence
Best Hex Alternatives for AI Analytics (2026)
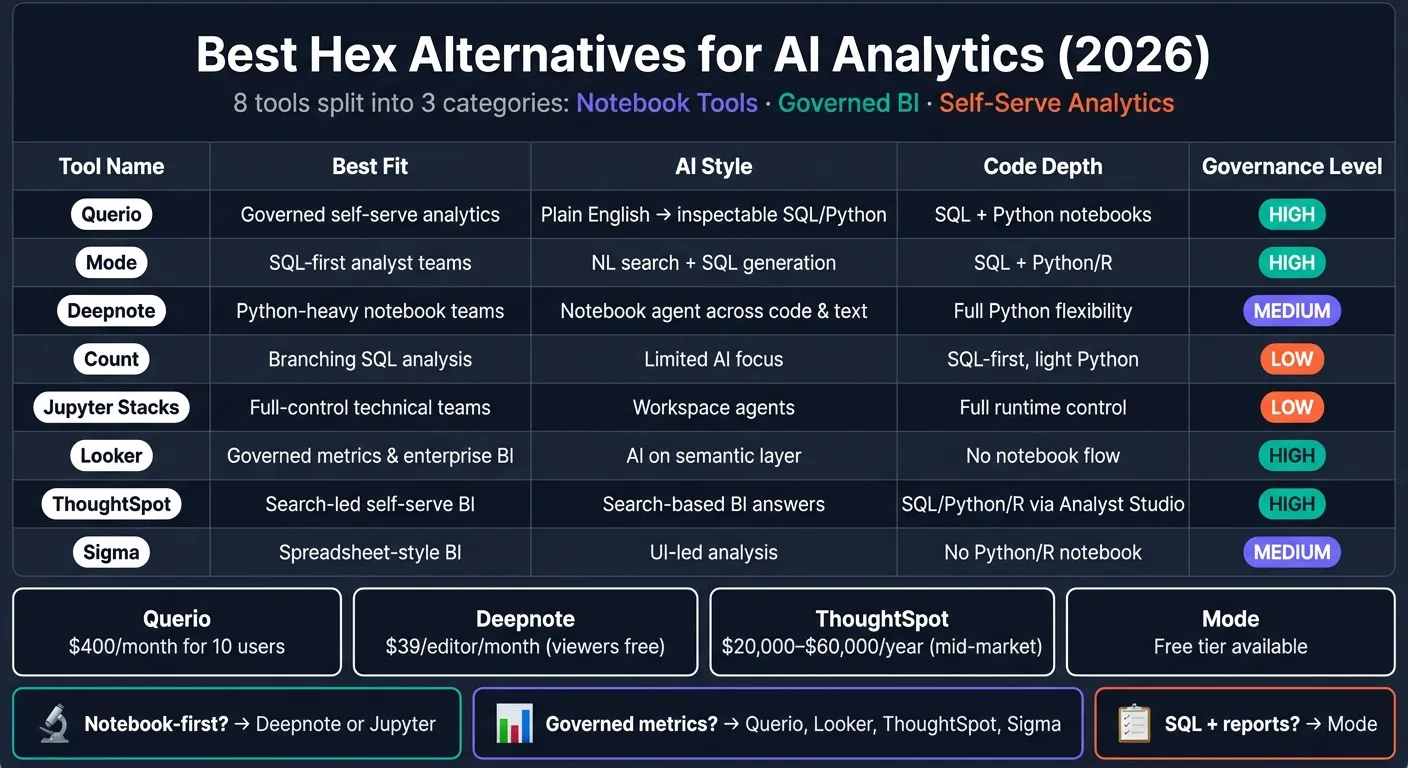
Pick Hex alternatives by workflow: notebook freedom for analysts, governed BI for consistent metrics, or self-serve analytics for business users.

If I had to sum it up fast: Hex alternatives split into 3 groups - notebook tools, governed BI tools, and self-serve analytics tools. For most teams, the best choice depends on one thing: who needs answers every day.
Here’s the short version:
- Querio: best for governed self-serve analytics on top of the warehouse
- Mode: best for SQL-first teams that send repeatable reports
- Deepnote: best for Python-heavy notebook work
- Count: best for branching SQL analysis on a canvas
- Jupyter-based stacks: best for teams that want full code control
- Looker: best for governed metrics and company-wide reporting
- ThoughtSpot: best for search-led BI for business users
- Sigma: best for spreadsheet-style analysis on live warehouse data
If you’re choosing between them, I’d look at 4 things first:
- AI workflow: plain-English to SQL, notebook help, or search-based answers
- Code depth: SQL only, SQL + Python, or full notebook/runtime control
- Governance: semantic layer, permissions, and metric consistency
- Delivery: dashboards, scheduled reports, or analyst-facing notebooks
A few facts stand out from the list:
- 8 tools made the shortlist
- Querio has a free plan, and Core is $2,499/month, with unlimited users on every plan
- Deepnote starts at $39/editor/month
- ThoughtSpot often lands around $20,000–$60,000/year for mid-market teams
- Mode includes a limited free tier for small-scale use
Quick Comparison
| Tool | Best fit | AI style | Code depth | Governance | Reporting |
|---|---|---|---|---|---|
| Querio | Governed self-serve analytics | Plain English to inspectable SQL/Python | SQL + Python notebooks | Shared semantic/context layer, RBAC, SOC 2 Type II | Dashboards + scheduled reports |
| Mode | SQL-first analyst teams | NL search and SQL generation | SQL + Python/R | dbt-based metric control, access controls | Strong scheduled reporting |
| Deepnote | Python-heavy notebook teams | Notebook agent across code and text | Full Python flexibility | SSO, RBAC, project permissions | Data apps and scheduled notebooks |
| Count | Branching SQL analysis | Limited AI focus | SQL-first, light Python | Lighter governance | Sharing more than reporting |
| Jupyter stacks | Full-control technical teams | Workspace agents in managed setups | Full runtime control | Varies by setup | Apps and scheduled runs |
| Looker | Governed metrics | AI on top of semantic layer | No notebook flow | Strong permissions and lineage | Strong dashboard reporting |
| ThoughtSpot | Search-led self-serve | Search-based BI answers | Analyst Studio adds SQL/Python/R | dbt semantic support, RBAC | Liveboards + scheduled delivery |
| Sigma | Spreadsheet-style BI | Focus is UI-led analysis | No Python/R notebook | Built-in controls | Dashboards on live warehouse data |
Bottom line: If your team lives in notebooks, I’d compare notebook AI vs traditional BI and look at Deepnote or Jupyter-based stacks. If your team needs one set of trusted metrics for many users, I’d start with Querio, Looker, ThoughtSpot, or Sigma. And if your analysts mainly write SQL and ship reports, Mode is the cleanest fit.
That’s the frame I’d use before getting into the tool-by-tool tradeoffs.
1. Querio
Querio is a governed, warehouse-native analytics workspace that connects straight to Snowflake, BigQuery, Amazon Redshift, ClickHouse, and Postgres.
AI Analysis
Analysts can ask questions in plain English, and Querio turns those prompts into SQL and Python they can inspect, edit, and run again. That matters because you’re not stuck with a black-box answer. You can see the logic, tweak it, and keep going.
Notebook and SQL Depth
When the work needs a deeper pass, Querio includes a reactive notebook. If the logic changes, the results update too. That makes iteration feel a lot less clunky, especially when you’re moving between drafts of a query or testing a new idea.
Dashboards and Reporting
Teams can turn analysis into scheduled reports and live dashboards. Each run queries the warehouse directly, so the output stays tied to the source data instead of drifting into stale exports.
Governance and Warehouse Fit
Publishing is only part of the story. Querio also has a shared semantic/context layer that keeps joins, metric definitions, and business terms in sync across queries, notebooks, dashboards, and AI answers. dbt models can line up with that same layer, which helps teams keep one version of the truth instead of five slightly different ones.
For teams that need tighter controls, Querio includes role-based access controls and SOC 2 Type II support for governance in B2B SaaS settings.
Querio has a free plan, and Core is $2,499/month (or $25,000 a year billed annually), with unlimited users on every plan. The next sections look at tools that lean more toward notebooks, governed BI, or production reporting.
2. Mode
Mode, now part of ThoughtSpot Analyst Studio, is a SQL-first analytics platform built for governed analysis and scheduled reporting. It works well for teams that want analysts to go from SQL work to polished, shareable reports without a lot of friction. Put simply, Mode is a stronger match for analyst-led SQL work than notebook-first AI analysis.
AI Analysis
Mode’s AI layer runs through Helix and ThoughtSpot’s Sage. These tools lean into natural language search and SQL generation, not the more agent-style notebook flows you see in Hex. The big plus is control: answers stay tied to governed data layer with dbt metrics, so results come from trusted definitions instead of free-form guesses.
Notebook and SQL Depth
Mode’s notebooks use a simple flow: write SQL, send the results into a Python or R dataframe, then keep going from there. Native R support with 60+ libraries[4] stands out, especially alongside Python and SQL support. The execution model is sequential, so cells farther down the notebook don’t auto-update when logic changes upstream. That can slow iteration compared with Hex, but it also makes SQL handoff cleaner for analyst-led work.
Dashboards and Reporting
This is one of Mode’s strongest areas. Scheduled delivery by email and Slack, interactive Liveboards, and a browser-based visual explorer that can handle more than 100,000 datapoints[4] make it a mature pick for operational reporting. If your team depends on reports going out on a set schedule, Mode’s workflow is more complete than Hex’s native scheduling.
Governance and Warehouse Fit
Mode includes granular access controls, identity management, and curated reusable datasets, which helps stop teams from splitting metric logic into one-off queries. Consistent metric definitions flow through the dbt Semantic Layer. That setup works best for data teams that need reliable metrics for non-technical stakeholders, rather than fully open self-serve. If your team wants more notebook collaboration, the next option moves closer to that style.
Pricing is quote-based. There’s also a limited free Studio tier for individual use or small-scale testing[4]. If your team needs more code-native collaboration, the next option shifts in that direction.
3. Deepnote
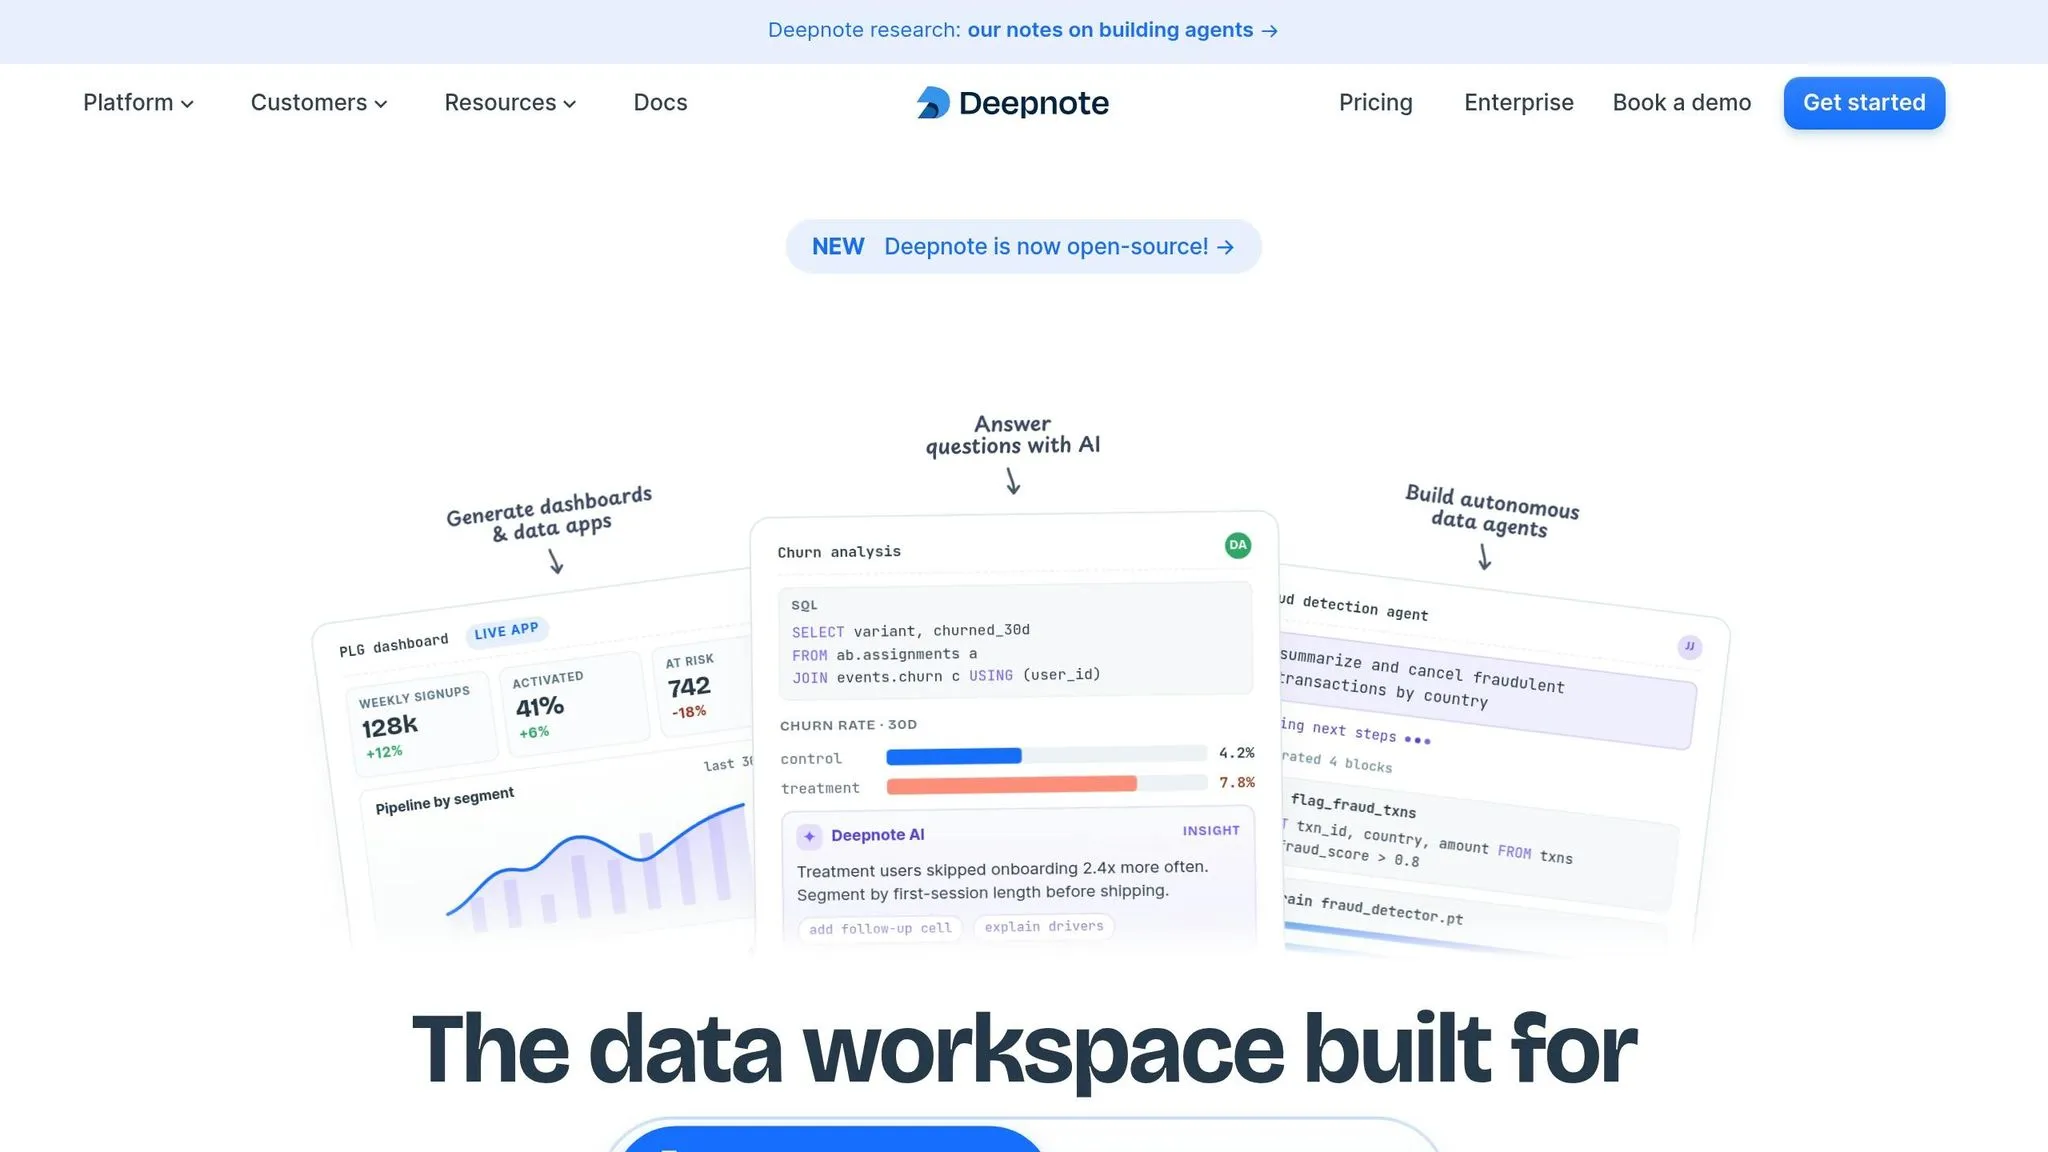
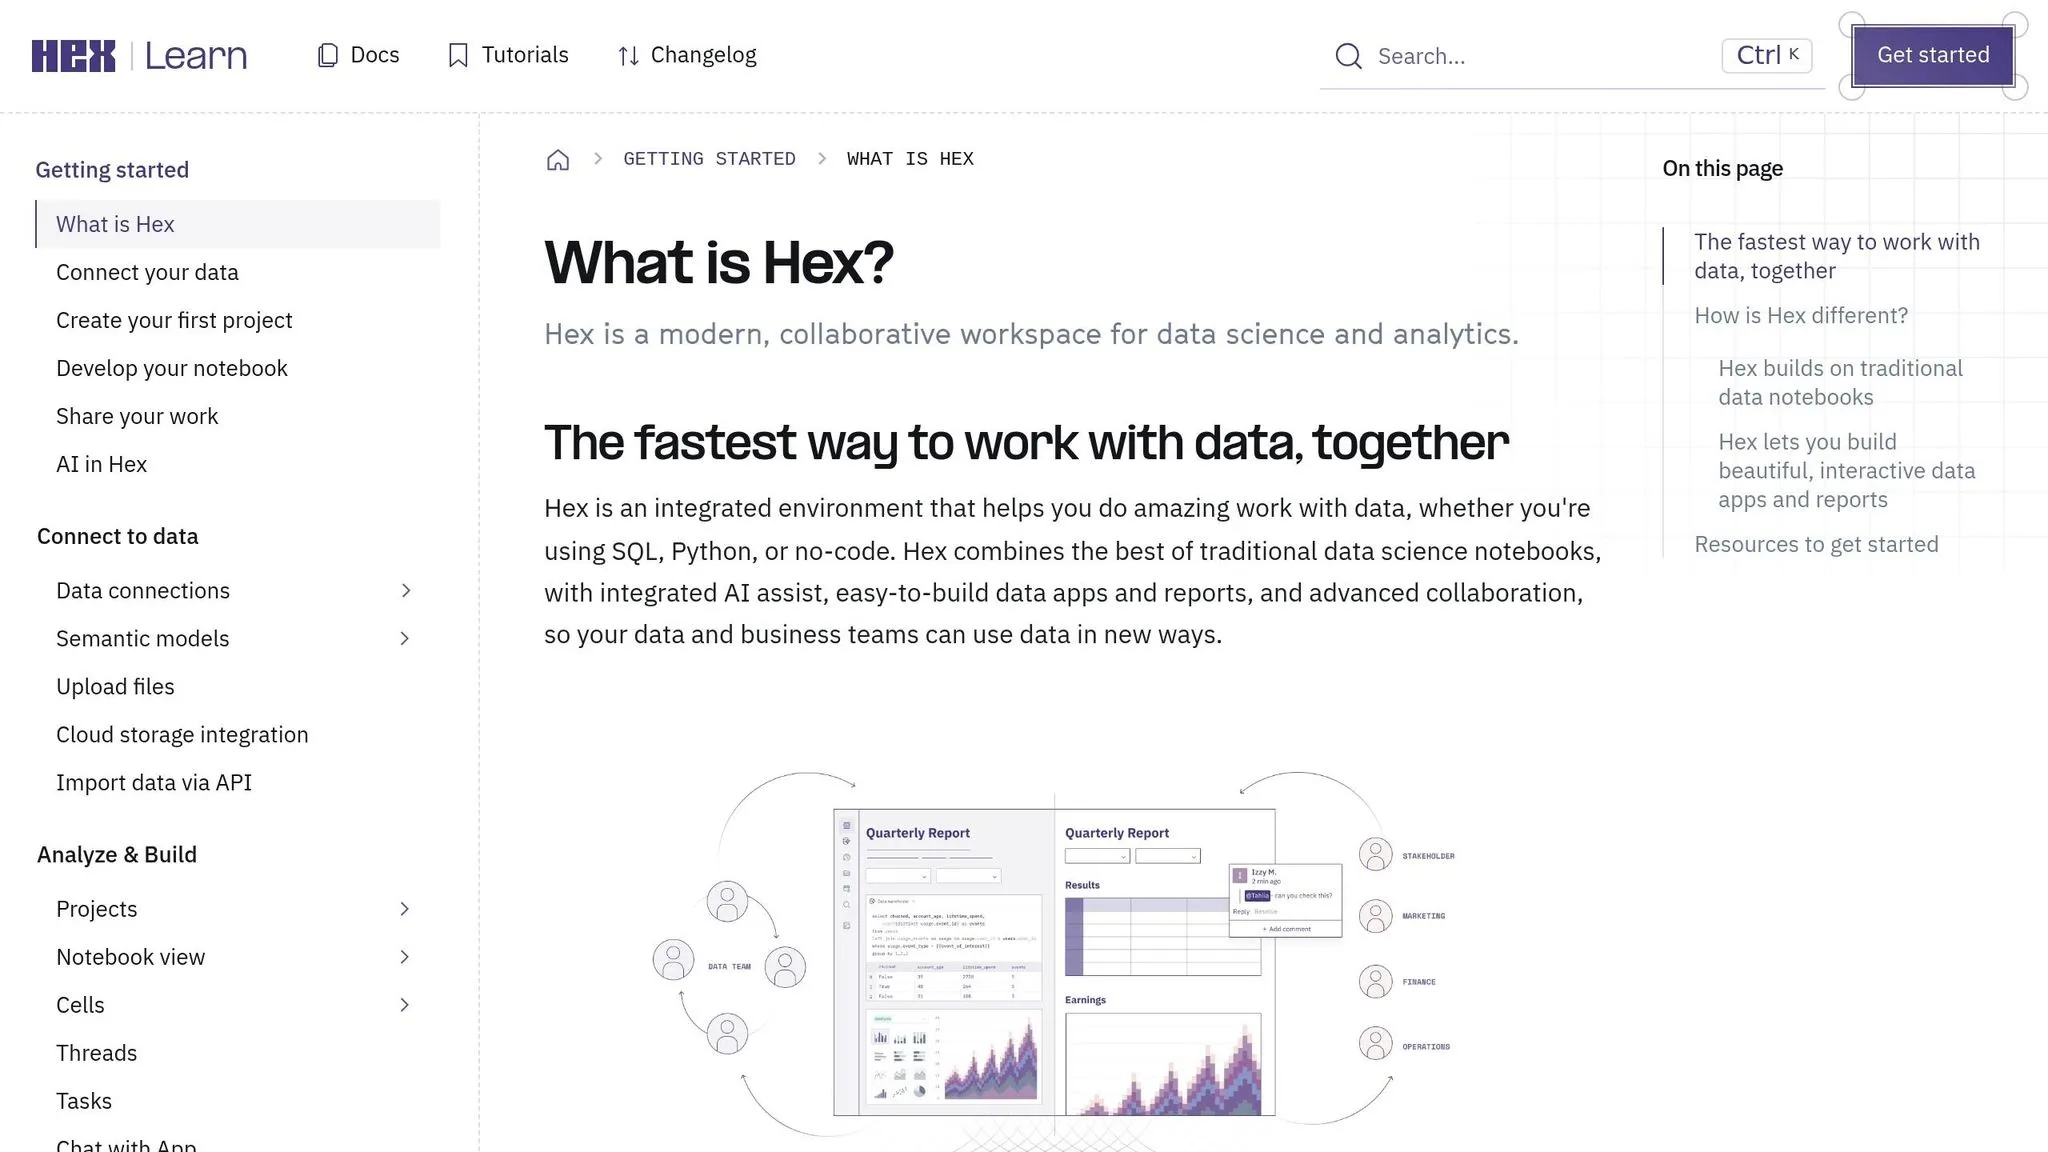
Deepnote is a good match for teams that like Hex’s notebook workflow but want more freedom in the Python runtime. You can use any library, upgrade packages, run custom Docker images, and pull in external data. That makes it a stronger fit for analyst teams that want AI help inside a flexible notebook, not a governed BI layer. [1]
AI Analysis
Deepnote’s AI runs through Deepnote Agent. It can edit Python, SQL, and text blocks across the notebook in a single pass. The output is easy to inspect because Deepnote uses an open .deepnote format with CLI and Git-based review. Deepnote also supports Model Context Protocol (MCP), which means notebooks can connect to or be called by external AI agents. [1]
Notebook and SQL Depth
Deepnote treats the notebook like a shared workspace where people and AI agents work on the same file together. SQL cells connect straight to Snowflake, BigQuery, Redshift, Postgres, and Databricks. From there, results move directly into Python dataframes.
It also has real-time collaboration built in, so multiple users can edit at the same time. If your team needs faster Python iteration than Hex’s notebook model gives you, Deepnote is often the better pick. [1][6]
Dashboards and Reporting
Deepnote supports scheduled notebooks, API triggers, and published data apps. Still, it leans more toward technical analysis than polished self-serve reporting. [1]
Governance and Warehouse Fit
Deepnote includes SSO, RBAC, project permissions, and single-tenant or on-prem deployment options. What it doesn’t include is a governed semantic layer, so metrics can be less standardized across teams. Team plans start at $39 per editor per month, and viewers are free. [1]
If your next priority is data-app style delivery or broader notebook-based analysis, the next section moves to a different fit.
4. Count
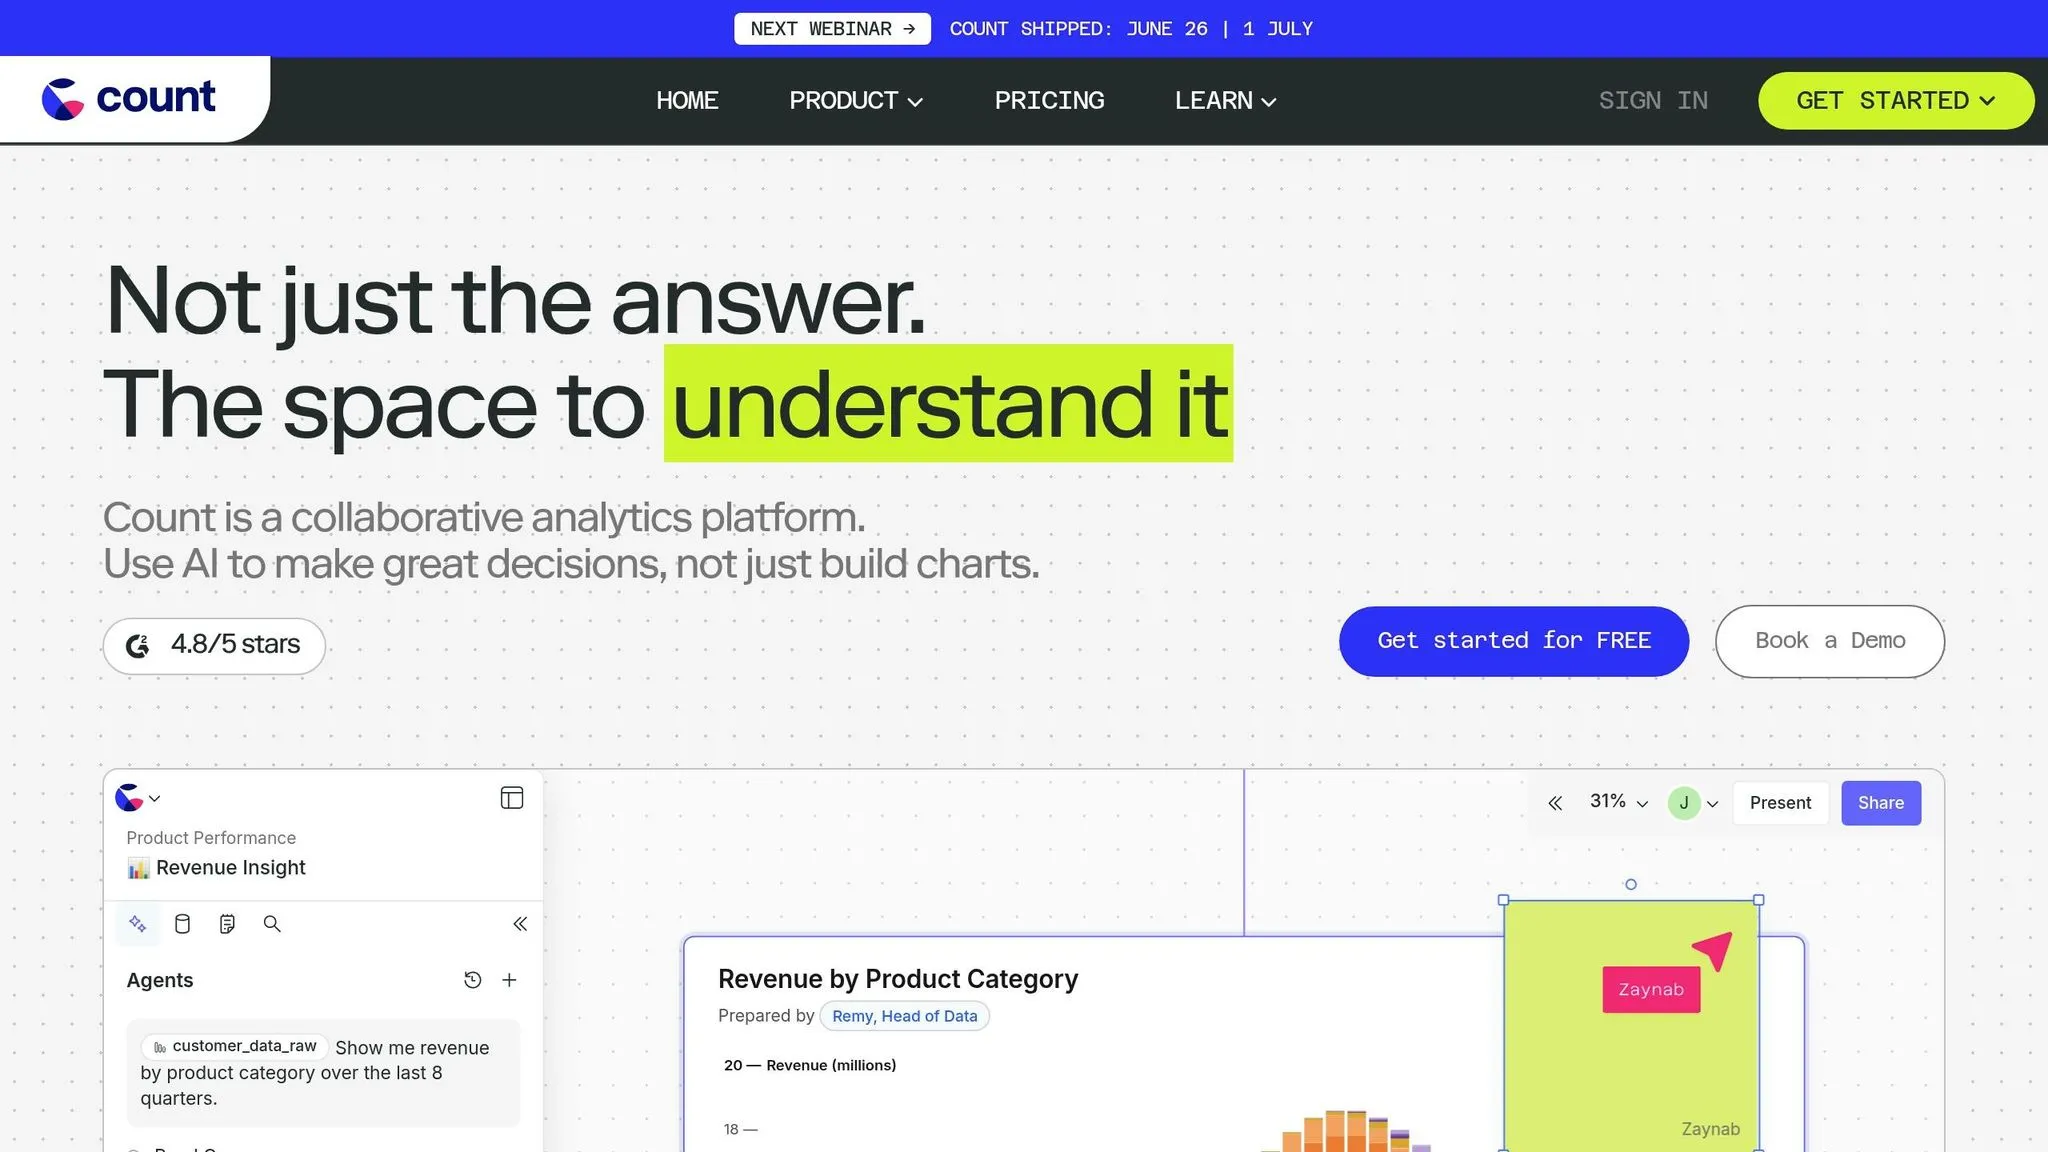
For teams that want analysis without notebook cells, Count goes in a different direction. Instead of a linear notebook, it uses a 2D canvas where analysts can place SQL, charts, and notes as movable cards. That setup works well when analysis branches in different directions and a single top-to-bottom flow feels too limiting.
AI Analysis
Count is strongest for collaborative exploration, not AI-driven automation. AI isn't the main workflow here. It's a better fit for SQL vs. AI-driven data exploration where context, side paths, and branching analysis matter more than automation.[2][1]
Notebook and SQL Depth
The canvas model is useful for multi-part analysis where the steps don't follow one linear order. Count is SQL-first, with direct connections to Snowflake, BigQuery, Redshift, and Postgres. Python support is there, but it plays a secondary role to the SQL workflow.[1]
Dashboards and Reporting
Count lets teams share analysis, but that's not the same as being built for scheduled reporting or governed dashboards. Its focus is exploration first, reporting second.[1][5]
Governance and Warehouse Fit
Count has a free tier for small teams, plus per-seat enterprise plans. The simpler canvas can make it easier for SQL analysts to get started. But if your team needs tighter governance, more detailed permissions, or production reporting, you'll likely want a metrics layer vs. semantic layer alongside it.[1][2][5]
If your workflow needs more structured notebooks or governed reporting, the next sections cover those paths.
5. Jupyter-based stacks
If Count feels a bit too structured, Jupyter-based stacks go the other way.
They fit a different job than Hex. These tools are for teams that want full Python control. Compared with Hex, they give up guardrails in exchange for flexibility. That means more freedom, but also more work on setup, governance, and sharing.
The best-fit ICP here is analytics engineers and analysts who already live in the Python ecosystem, not business users who want a guided workflow.
AI Analysis
Managed notebook environments can add workspace-level agents that edit Python, SQL, and text across the notebook. That's more useful than cell-only help when the work spans multiple steps.
The tradeoff is simple: more context, less structure.
Notebook and SQL Depth
Jupyter gives power users full control over the Python runtime, packages, and Docker images.
Modern notebook stacks also support native SQL cells and warehouse connections to:
- Snowflake
- BigQuery
- Redshift
- Databricks
- Postgres
Dashboards and Reporting
These stacks can publish interactive notebooks as apps and scheduled runs.
But let's be clear about what they are: analyst-facing tools. They're not self-serve BI products for non-technical users.
Governance and Warehouse Fit
Open-source Jupyter often needs custom work for permissions, sharing, and reproducible environments.
Managed stacks close part of that gap with SSO and role-based access. But they still don't provide a governed semantic layer. That leaves a gap for non-technical self-serve.
So Jupyter is best for technical analysis, not business-user self-serve.
6. Looker
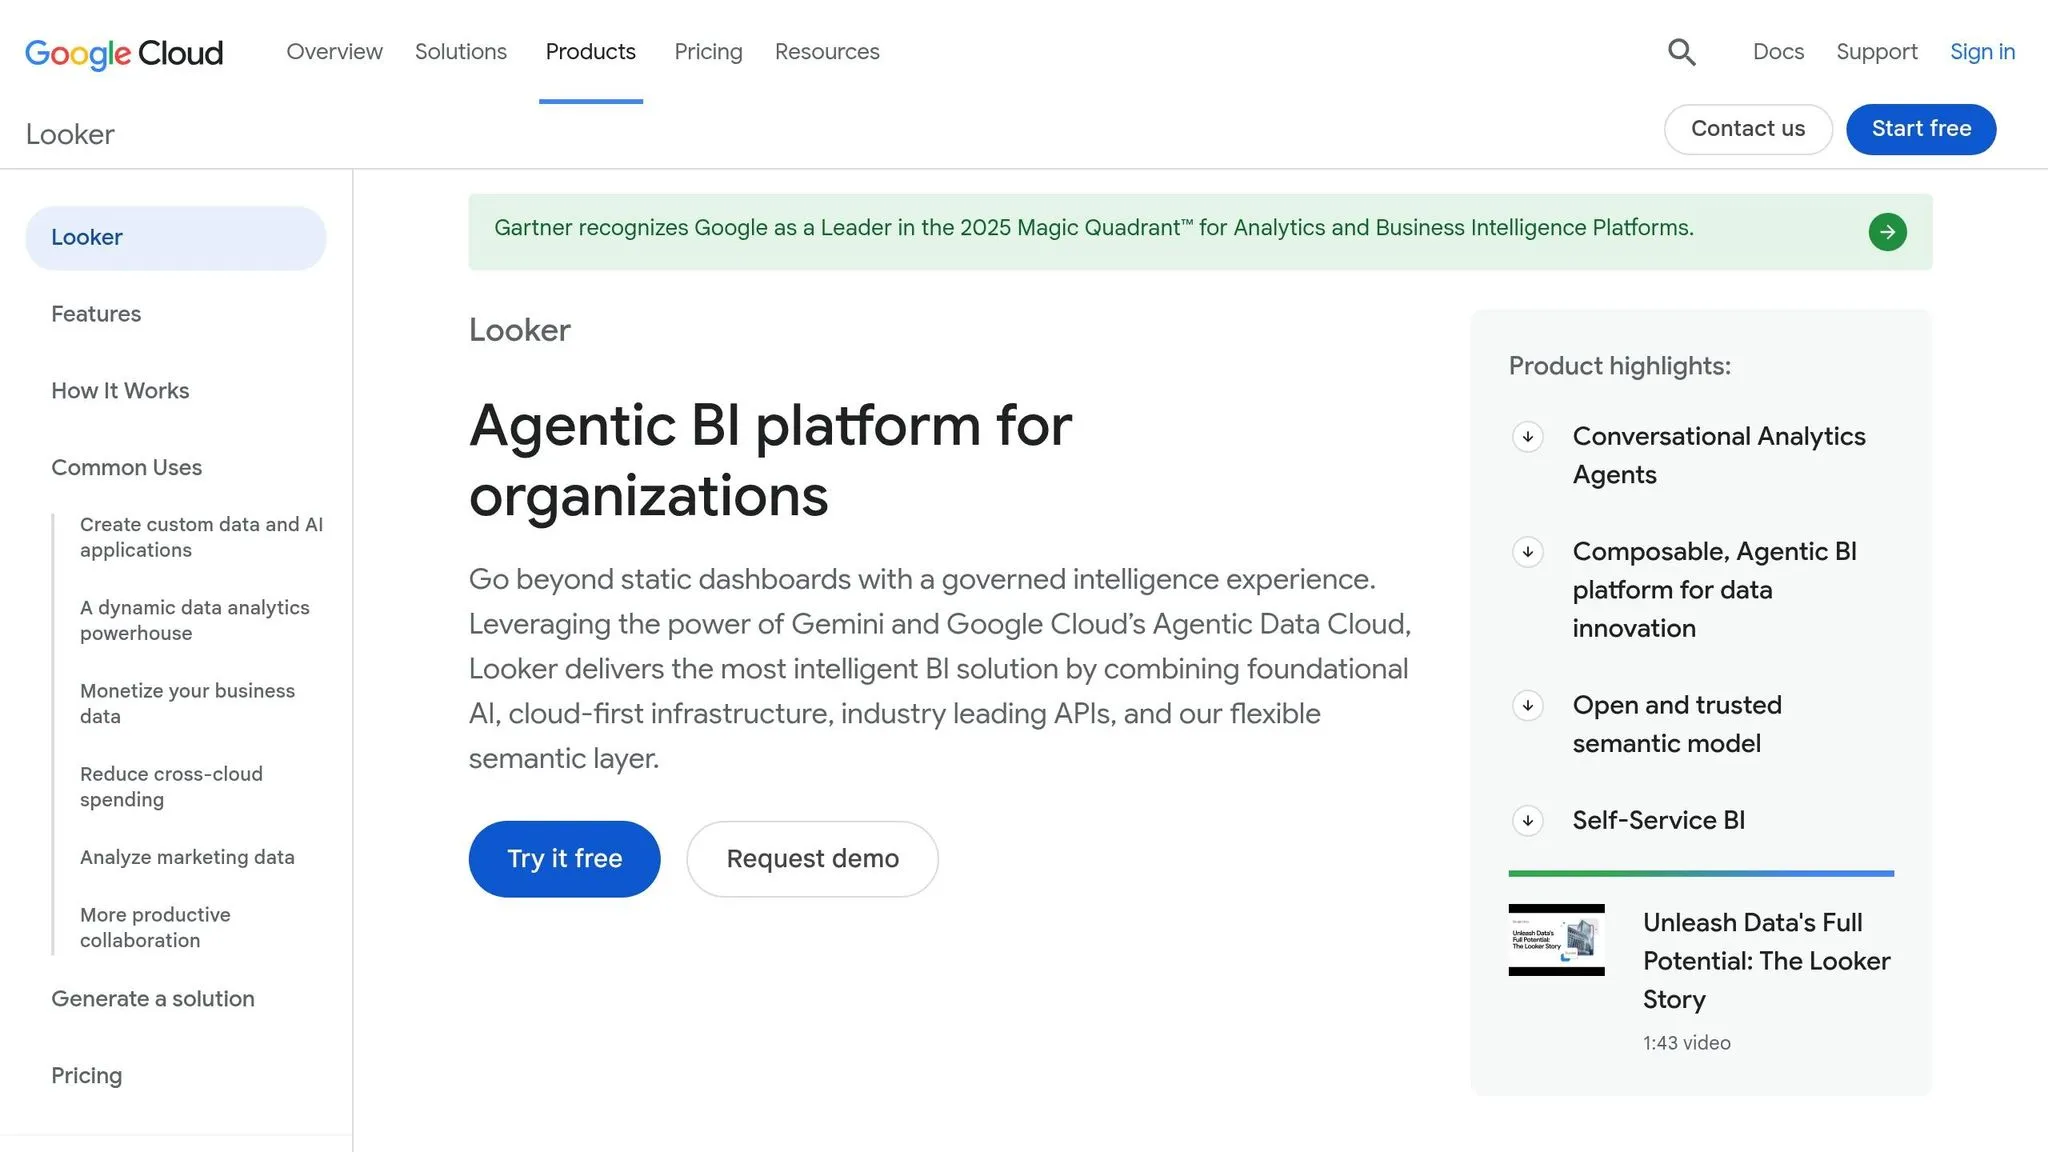
If your team has outgrown notebook-first analysis and now needs governed business metrics, Looker is built for that job. It's a BI platform made for production dashboards and consistent reporting across the business.
AI Analysis
Looker often acts as the governed semantic layer that AI agents query. LookML helps keep outputs consistent and easy to inspect. That same semantic layer also supports Looker’s reporting workflow.
Notebook and SQL Depth
Looker is not a notebook tool. It doesn’t support the mixed SQL/Python workflow or reactive cells that teams use for iterative discovery.
Dashboards and Reporting
This is where Looker shines. It’s strong for operational dashboards, governed metrics, and self-service BI accessibility for non-technical stakeholders.
Governance and Warehouse Fit
Looker connects natively to Snowflake, BigQuery, Redshift, and Postgres [3][5]. Granular permissions and lineage make it a strong fit for enterprise governance. The tradeoff is cost: implementation and migration can be expensive.
7. ThoughtSpot
ThoughtSpot goes after a different use case than Hex. It centers on search-led self-serve BI, so business users can ask natural-language questions and get answers from governed data. Its strong suit is broad access across the business, not deep notebook-based analysis.
AI Analysis and Dashboards
ThoughtSpot's AI is built to give teams across the company access to metrics and dashboards. Users can ask questions and get answers based on trusted data, then filter, drill down, and ask follow-up questions inside Liveboards without needing an analyst to step in[4]. It also includes scheduled delivery to email and Slack[4].
Notebook and SQL Depth
Analyst Studio, from Mode, supports SQL, Python, and R[4]. The main extra here is R support. That said, it doesn't match Hex's reactive notebook style. On the delivery side, Liveboards handle more of the presentation work for analysts.
Governance and Warehouse Fit
ThoughtSpot connects natively to Snowflake, BigQuery, Databricks, and Redshift, and it sends queries straight to the warehouse without intermediate storage[4]. It also works with the dbt Semantic Layer and other metric layers for governed metric definitions and offers granular role-based access controls[4].
There is a tradeoff: setup can take more work at the start because teams need to map data sources and relationships. Pricing for Analyst Studio is usually custom and often lands between $20,000 and $60,000 per year for mid-market deployments[3].
ThoughtSpot makes the most sense when governed self-serve is a bigger priority than analyst-led notebook iteration. If your team wants a different mix of analysis and reporting, the next option changes the workflow again.
8. Sigma
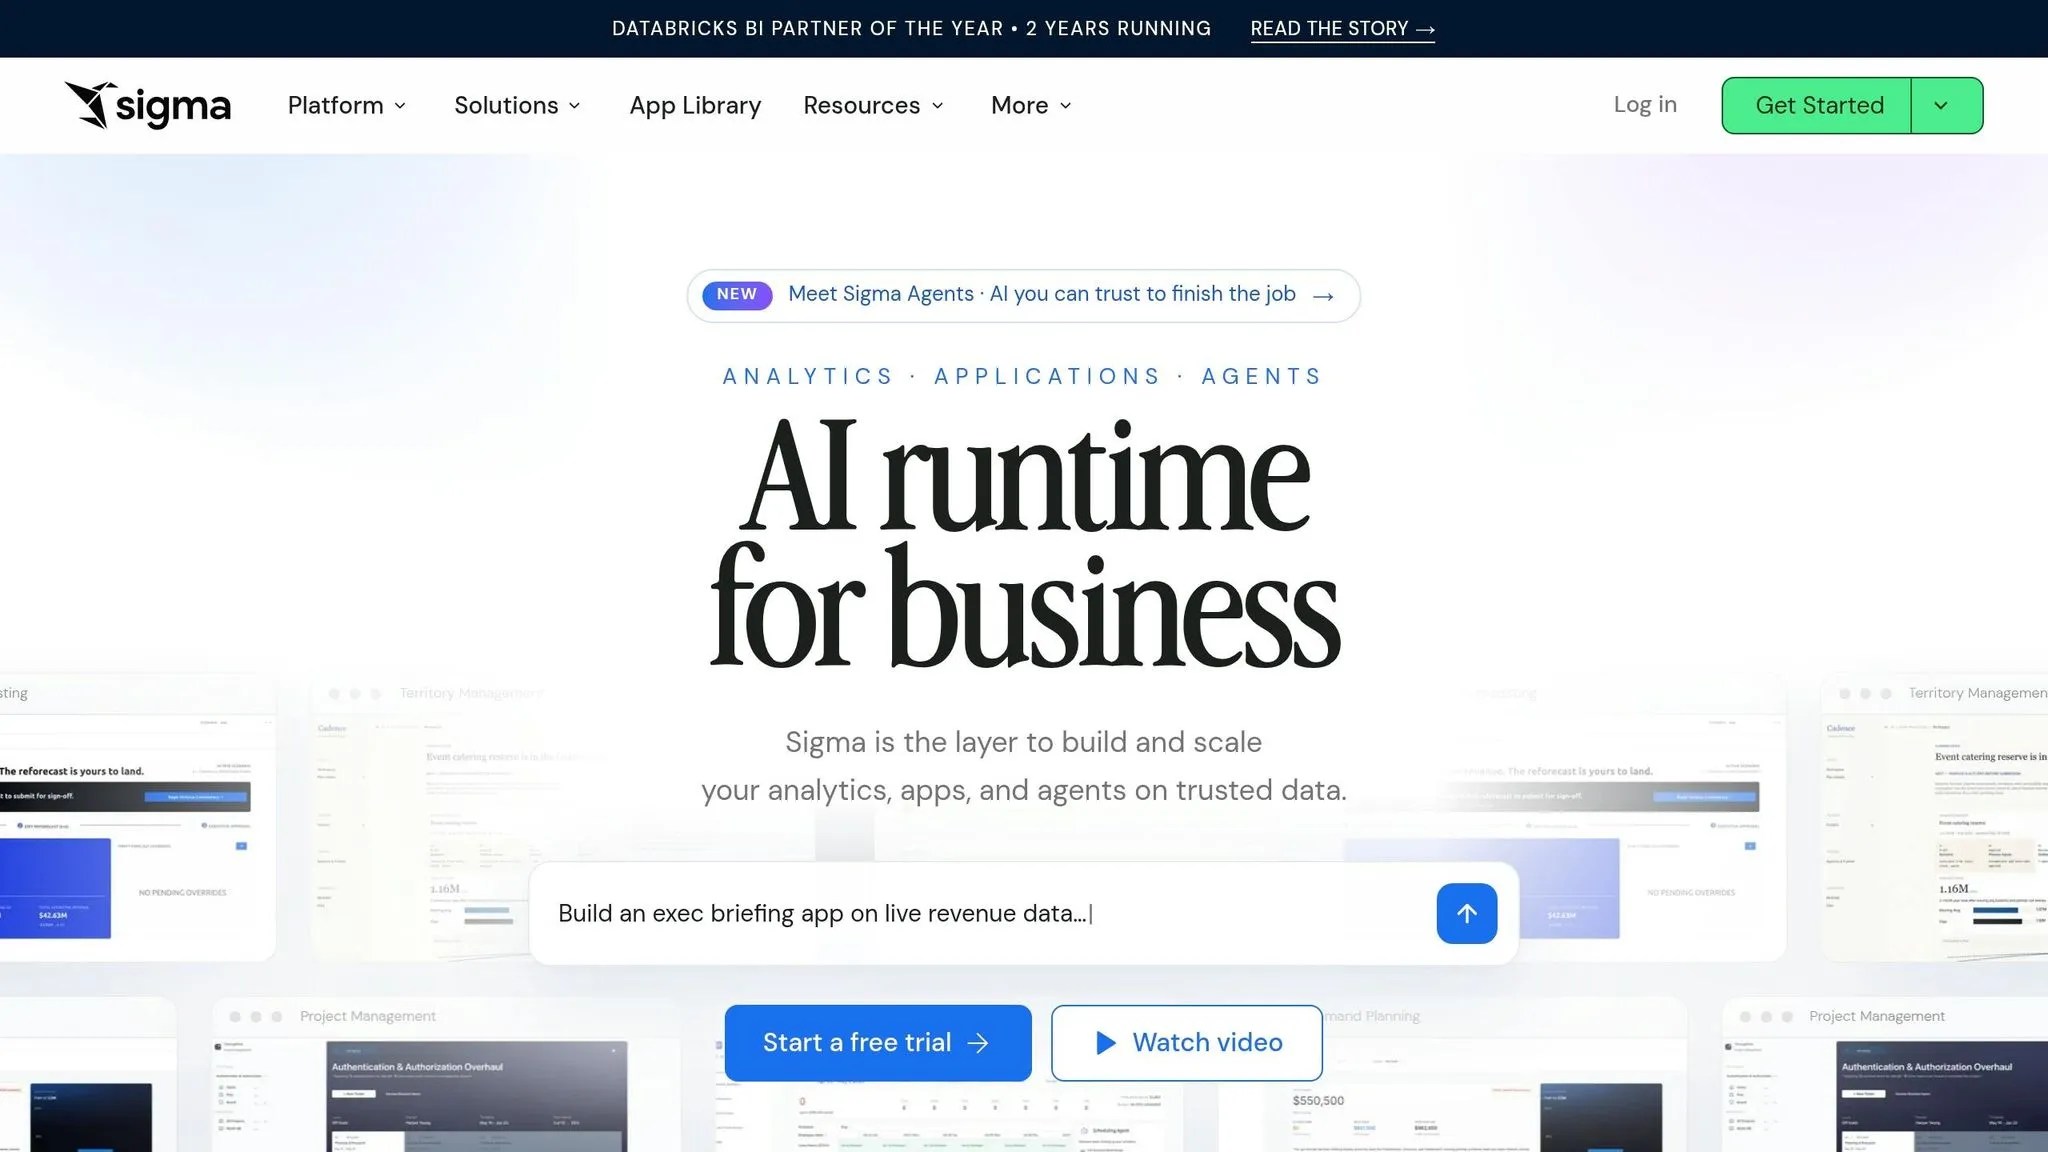
Where Hex starts with notebooks, Sigma starts with a spreadsheet-style interface that works right on top of your cloud data warehouse. That makes it a better fit for teams that want governed self-serve on live warehouse data, not notebook-led analysis. In plain English: Sigma gives business analysts a familiar spreadsheet-like UI for live data in Snowflake, BigQuery, Redshift, or Databricks.
Dashboards and Exploration
Sigma works best when analysts want governed, spreadsheet-style exploration and dashboards, not Python or R notebooks. Its charting gets the job done, but it isn't built with a design-first feel. If your team wants shareable dashboards on live Snowflake or BigQuery data, Sigma is a solid pick.
Notebook and Code Depth
Sigma does not have a native Python or R notebook. It's mainly a BI and exploration platform, not a tool for code-first analysis. For teams that depend on heavy coding or advanced statistical modeling, that's a clear limit. Sigma is made for UI-led exploration, not code-first work.
Governance and Warehouse Fit
Sigma pushes queries down directly to cloud data warehouses like Snowflake, BigQuery, Redshift, and Databricks. It also includes built-in governance and access controls, which makes it a good match for teams with strict data residency and security needs [2].
Sigma tends to make the most sense when your business users are comfortable working in spreadsheets and your data already sits in Snowflake, BigQuery, Redshift, or Databricks. That tradeoff - spreadsheet-first exploration instead of deep notebook support - sets up the workflow comparison below.
Tradeoffs by Workflow Type
No single tool works for every workflow. The right pick depends on how your team actually works day to day: SQL-first analysis tools, notebook-led teamwork, governed metrics, or self-service analytics for business users. The table below turns that into a short workflow-based view, so you can line up your main use case before digging into finer tradeoffs.
| Team Need | Best-fit Tools | Why They Fit | Main Compromise |
|---|---|---|---|
| SQL-first analyst teams | Mode, Count | Mode works well for governed SQL reporting; Count is strong for branching exploration | Mode is less notebook-oriented; Count is limited for production reporting |
| Collaborative notebook-heavy data science | Deepnote | Full Python flexibility with real-time collaboration | Limited spreadsheet-style analysis and no governed metrics layer |
| Governed semantic definitions | Looker | Best for governed metrics at enterprise scale | High implementation complexity |
| Business-facing self-serve analytics | Sigma, ThoughtSpot | Sigma suits spreadsheet-style exploration; ThoughtSpot fits search-led self-serve | Sigma lacks a notebook surface; ThoughtSpot is most useful inside its own ecosystem |
| Maximum flexibility (Jupyter-based) | Deepnote, Jupyter (OSS) | Maximum Python control and open formats | Collaboration and governance are lighter out of the box |
The tradeoff is pretty straightforward: more governance often means less flexibility.
For many B2B SaaS data teams with 100–500 employees, the best answer isn't one tool. It's a combo. A notebook-first tool handles deep analysis, while a governed layer supports the metrics that stakeholders check every day.
Pros and Cons
Here’s the fast read on the main tradeoffs: AI visibility, SQL/Python flexibility, governance, collaboration, and self-serve. For Hex buyers, this is where the choice gets practical. Most Hex replacements land in one of three camps: notebook flexibility, governed BI, or self-serve warehouse analytics.
The table below pulls those workflow differences into a quick side-by-side view.
| Tool | Pros | Cons | Best For |
|---|---|---|---|
| Querio | Governed semantic/context layer; inspectable SQL and Python for every answer; reactive notebooks | Requires upfront context and modeling for consistent results | Data teams at B2B SaaS companies that need governed self-serve analytics platforms without engineering overhead |
| Mode | Strong SQL workspace; solid narrative reporting; mature platform | Weaker visual SQL query builder; no reactive notebook model | SQL-first analyst teams running repeatable reports |
| Deepnote | Highest Python flexibility; custom Docker and any library; real-time collaboration | Not built for BI; limited for governed metrics and dashboard-heavy reporting | Python-heavy data teams and AI BI vs traditional workflows |
| Count | 2D canvas supports branching analysis; strong SQL-first exploration | Limited for production reporting; no governed metrics layer | Collaborative branching SQL exploration |
| Jupyter-based stacks | Maximum flexibility; full control over the environment | Collaboration and governance are light by default; requires more engineering to productionize | Teams that need full control and have engineering resources to manage infrastructure |
| Looker | Best-in-class governance via LookML; strong multi-tenant permissions; enterprise-grade | High implementation complexity; slow to set up | Large enterprises where governance is the primary requirement |
| ThoughtSpot | Search-driven self-serve; strong for executive self-serve dashboards | Less flexible for notebook-style analysis | Business users who want search-led self-serve |
| Sigma | Spreadsheet UI for live warehouse data; queries live warehouse data directly | No notebook surface; charting is serviceable but simple | Business analysts transitioning from Excel who need to explore live data |
The pattern is pretty clear. Tools with the most flexibility often give up some governance. Tools built around governance usually ask for more setup and definition up front. A built-in semantic layer can close part of that gap.
The next section turns these tradeoffs into a final recommendation by workflow.
Conclusion
This choice boils down to one thing: what kind of work does your team do most often?
Do you need governed self-serve analytics, the freedom of notebooks, or dashboard-first reporting?
Pick a Hex alternative based on who will use it, how much control and oversight you need, and whether your team works mainly in notebooks or mainly in dashboards.
Deepnote stands out as the best notebook-first pick for Python-heavy teams that need full control over their environment. Mode works well for SQL-first teams that rely on repeatable reporting and scheduled delivery.
Sigma is a good match for business users who want spreadsheet-style analysis on live warehouse data.
Jupyter-based stacks make sense for teams that want maximum flexibility and can handle their own infrastructure. But they’re not a good match for teams that want one packaged workflow that goes from analysis to dashboards.
For B2B SaaS data teams that need governed self-serve analytics, Querio brings together a governed semantic/context layer, inspectable SQL and Python, and live warehouse connections to Snowflake, BigQuery, Redshift, and other warehouses.
The right pick is the one that fits your team’s main workflow, not the one with the longest feature list.
FAQs
How do I choose between notebooks, BI, and self-serve analytics?
Choose based on what you need most: open-ended analysis, repeatable reporting, or easy self-serve access.
Tools like Hex or Deepnote work well for analyst-led, code-heavy work in SQL and Python. They’re a good fit when the team wants room to dig in, test ideas, and work close to the data.
BI platforms make more sense for governed, recurring reporting and for people who don’t write code.
If you need both flexibility and consistency, look for a governed semantic layer with live warehouse access. Querio does this with inspectable, editable SQL and Python, consistent metrics, and self-serve access without CSV exports.
When does a governed semantic layer matter most?
A governed semantic layer matters most when teams need consistent metric definitions across the company. Without it, definitions can drift from one query to the next. That leads to conflicting numbers and chips away at trust in AI-generated insights.
It gives you a single source of truth so non-technical users can self-serve without going off the rails, while dashboards, SQL work, and AI outputs stay inspectable, accurate, and aligned with governed business logic.
Should one team use more than one analytics tool?
Yes. A lot of teams use more than one analytics tool so both technical and non-technical users can get what they need.
A common setup looks like this: one tool for deep, collaborative ad hoc analysis, and another for governed self-serve reporting.
That can mean higher costs. But in practice, it often scales better than trying to make one platform do both jobs.