Business Intelligence
self service analytics platforms enterprise
Enable nontechnical users to analyze data with governed, scalable self-service analytics—AI insights, semantic layers, secure access, and phased implementation.
Self-service analytics platforms let non-technical users access and analyze data without relying on IT teams. These tools simplify data exploration with features like drag-and-drop interfaces and natural language queries, enabling faster decision-making and reducing bottlenecks.
Key benefits include:
Faster insights: Business users can analyze data in real time without waiting for IT-generated reports.
Improved data access: Employees gain direct access to data, fostering better understanding and decision-making.
Reduced IT workload: IT teams can focus on strategic tasks instead of routine reporting.
Advanced features: AI-powered insights, natural language processing, and secure data governance meet enterprise needs.
What enterprises need:
Scalability: Platforms must handle large datasets and user bases.
Security and governance: Features like row-level security and standardized metrics ensure data accuracy and compliance.
Integration: Compatibility with tools like Snowflake, BigQuery, and existing systems is essential.
Choosing the right platform involves aligning features with business needs, ensuring integration with current tools, and evaluating total costs. Implementation requires a phased approach, data governance implementation, and user training to maximize adoption and maintain data trust. When done right, self-service analytics can transform how organizations make data-driven decisions.
Building a data-driven culture with self-service analytics
What Are Self-Service Analytics Platforms and Why Do Enterprises Need Them?
Self-service analytics platforms give non-technical users the ability to access, analyze, and visualize data without needing specialized training or relying on IT teams for support [2][9]. Imagine a marketing manager wondering, "Which campaigns had the highest conversion rates in the last six months?" With these platforms, they can generate an interactive dashboard in minutes instead of waiting for a static report.
The key idea is decentralizing data analysis. Instead of IT teams handling every request, these platforms put analytical tools directly into the hands of business users - whether in marketing, sales, finance, or operations [1]. Mike Chen from Oracle explains it well:
The "self-service" aspect of self-service analytics refers to business users being able to handle both [data selection and analysis] without assistance [1].
A semantic layer ensures consistency by standardizing business terms across departments [9][4]. For example, when marketing talks about "revenue" and finance uses the same term, both are referring to the same metric. This alignment is especially important for SaaS companies tracking monthly recurring revenue (MRR) or churn, and for e-commerce businesses monitoring conversion rates [4].
This shift doesn’t just improve individual analysis - it transforms how organizations make decisions.
Main Business Reasons for Adoption
Traditional business intelligence (BI) projects often deliver insights too late to be actionable [5]. With nearly half of digital workers (47%) struggling to find the information they need [8], these delays are more than frustrating - they’re expensive.
Self-service platforms eliminate bottlenecks by giving users the ability to act on insights immediately [2][9]. A finance director can run "what-if" scenarios on regional revenue, while a sales manager can dive into customer segments - all without filing a support ticket. This agility enables teams to respond to opportunities or challenges while they’re still relevant.
Another advantage is the boost in data literacy across the organization. As employees regularly interact with data through user-friendly tools like drag-and-drop interfaces or natural language queries, they gain a deeper understanding of metrics and how they’re calculated [5][1]. This creates a culture where decisions are grounded in evidence, and teams speak the same "data language" using shared, reliable metrics.
IT teams also benefit by shifting their focus from repetitive reporting tasks to more strategic initiatives, such as integrating new data sources, developing advanced analytics models, or enhancing data quality [1]. Instead of acting as gatekeepers, IT becomes a collaborative partner, providing a secure and governed environment for business users [7].
Beyond improving speed and insights, these platforms are designed to meet the high standards of scalability, security, and governance that enterprises demand.
What Enterprises Need from These Platforms
Enterprises require platforms that can scale effortlessly, operate in the cloud, and integrate with modern data warehouses like Snowflake and BigQuery [9][6].
Security and governance are non-negotiable, especially in industries like fintech and e-commerce where compliance is critical. Features like row-level security ensure employees only access data relevant to their roles. For example, a regional sales manager shouldn’t have visibility into global financial data [1][4].
Governance tools also prevent "report sprawl", where different departments create conflicting versions of the same metric [5][4]. A strong semantic layer ensures that everyone interprets metrics like cart abandonment rates or customer lifetime value in the same way [9][4]. This consistency is vital for making informed decisions.
Finally, enterprises need platforms that balance simplicity with advanced capabilities. While marketing teams may prefer straightforward dashboards to track campaign performance, data analysts need tools that allow for complex queries and sophisticated modeling. The best platforms cater to both groups without sacrificing usability [4].
Core Features of Enterprise Self-Service Analytics Platforms
For enterprises, having analytics platforms that can handle thousands of users simultaneously, integrate seamlessly with existing data systems, and maintain strong security measures - while still being easy to use - is essential.
What sets enterprise-grade platforms apart from basic BI tools? Three standout features: AI-powered interfaces that eliminate technical barriers, robust data connectivity that unifies diverse data sources, and governance frameworks that ensure security and consistency at scale. These elements form the backbone of scalable, secure analytics that empower teams to work smarter.
AI-Powered Insights and Natural-Language Queries
Imagine being able to ask a complex business question in plain English and getting a detailed visual answer instantly. That’s the power of Natural Language Processing (NLP). For example, a marketing manager could type, "Which products have declining margins in the Northeast despite increasing sales?" and receive a clear, actionable visualization within seconds. This capability eliminates the need for IT assistance or SQL expertise, making data more accessible to non-technical users.
While basic systems rely on keyword matching, advanced platforms take it further with Natural Language Understanding (NLU) and Natural Language Generation (NLG). These technologies interpret user intent and transform raw data into insights that are ready for action.
Beyond answering questions, AI can also work proactively. Modern platforms can detect anomalies, spot emerging trends, and even recommend visualizations. For instance, they might flag a sudden spike in churn rates or highlight inventory shortages before they become major issues.
But here’s the catch: these AI-driven insights are only as good as the semantic layer they’re built on. This layer ensures that key metrics - like "churn" - are defined consistently across the organization. Without it, different teams might calculate the same metric differently, leading to conflicting results and confusion.
Data Connectivity and Integration
Enterprises often juggle data from a variety of sources, including cloud warehouses like Snowflake and BigQuery, SaaS tools, and even older on-premise databases. The best platforms provide native connectors to these sources, allowing users to access and analyze all their data in one place - no need to jump between tools [4].
A strong semantic layer plays a key role here too, ensuring that metrics are aligned across all data sources. This prevents issues like report sprawl, which can undermine trust in the data.
Modern platforms also take advantage of cloud data warehouses by running queries directly at the source. This approach keeps data secure, reduces infrastructure demands, and leverages the processing power of the data warehouse itself.
Security, Governance, and Scalability
For enterprises, trust in data starts with strong governance. Features like Row-Level Security (RLS) ensure that employees only see the data relevant to their roles, minimizing risk and maintaining compliance with regulations like GDPR and HIPAA. Detailed audit trails and integration with identity management systems, such as Single Sign-On (SSO) and Role-Based Access Controls (RBAC), add additional layers of security.
Scalability is equally important. Can the platform handle thousands of users querying massive datasets without slowing down? Advanced features like in-memory processing and live query optimization ensure that performance remains smooth, even as data and user numbers grow.
A real-world example of this comes from PepsiCo’s Collaborative Planning, Forecasting, and Replenishment (CPFR) team. By moving from manual tools like Excel and Access to a modern, governed analytics platform, they cut their analysis time by 90% [10]. This transformation highlights how the right platform can enable faster, smarter decision-making across the enterprise.
How to Choose the Right Platform for Your Enterprise
When it comes to picking the best platform for your enterprise, the stakes are high. A well-suited platform can streamline operations and empower smarter, faster decisions across your organization. On the flip side, the wrong choice can lead to wasted resources, frustrated teams, and poor adoption. The key is finding a platform that aligns perfectly with your needs, infrastructure, and goals.
Matching Platform Features to Your Use Cases
Start by understanding the specific tasks and roles within your organization. Different teams will have different needs. For instance, visual-heavy analysts who thrive on deep data exploration require tools that offer advanced visualization capabilities. Meanwhile, Excel-centric users might prioritize straightforward reporting tools that are easy to navigate.
Think about what empowers your teams the most. Does your organization need a platform with built-in governance to ensure data security and compliance? Or would a more flexible system, where governance is managed internally, work better for your team? The answer depends on your internal processes and the level of autonomy your teams need.
Another factor to consider is your analytics maturity level. Teams with advanced technical skills might benefit from features like Git integration or version control for dashboards, which ensure clear audit trails. For less technical teams, platforms with intuitive interfaces and natural language querying could be a better fit, as they minimize the need for complex SQL knowledge.
Finally, integration with your existing systems is crucial.
Integration with Your Current Data Stack
Your platform should work seamlessly with the technology you already have in place. Avoid platforms that require costly, custom-built integrations. Instead, look for options that align naturally with your current setup.
Consider your cloud ecosystem and data connectivity needs. For example, if your organization relies on Google Cloud and BigQuery, look for a platform optimized for that environment. Similarly, if you're using Azure, a platform that connects natively with Synapse and other Microsoft tools will save time and effort. Some platforms offer live connections that query your database in real time, ensuring up-to-date information, while others rely on import modes, trading real-time access for faster performance.
Don't forget about workflow integration, either. If your teams use tools like Microsoft Teams, Slack, or Excel daily, a platform with strong native integrations can boost adoption and make workflows smoother.
Once you've ensured compatibility, it's time to think about the financial side.
Understanding Total Cost of Ownership
The price tag on the software license is just the beginning. To understand the full financial commitment, you need to look at the total cost of ownership (TCO).
Initial costs can include far more than just the software itself. You’ll likely need to budget for data migration, security checks, quality assurance testing, and the time your team spends on setup and configuration. Some platforms, especially those requiring specialized modeling languages, may also demand significant development effort upfront before you see any real value.
Ongoing costs are another major consideration. These might include salaries for administrators, regular training for new features, software updates, performance monitoring, and even license audits to ensure you're not paying for unused seats. As Adam Greco, Former Product Evangelist at Amplitude, pointed out:
The amount spent on a digital analytics program should be much more considerable than the licensing cost. It isn't free even if you use a free version [12].
Hidden costs can also add up quickly. For example, employees often spend a large chunk of their time - sometimes over 50% - on data cleaning and validation. In the U.S. alone, this inefficiency costs an estimated $3.1 trillion annually [13].
When comparing platforms, it's important to look beyond the surface-level numbers. For instance, Power BI Pro costs about $14 per user per month, while Tableau Creator is priced around $75 per user per month [4]. However, these prices don’t account for additional expenses like infrastructure, training, or the administrative burden of managing the platform’s governance model.
A solution that seems cheap at first can become expensive later. This can happen because of high maintenance needs or poor integration options. - OTRS [11]
To avoid surprises, conduct multi-year TCO analyses - ideally for five and ten years. This will help you account for future growth in data volume and user numbers. Many platforms base their pricing on these factors, so costs are likely to increase as your organization scales. Understanding this trajectory upfront will help you plan your budget more effectively.
How to Implement and Govern Self-Service Analytics in Enterprises
Three-Tier Governance Model for Enterprise Self-Service Analytics
Rolling out a self-service analytics platform isn’t just about buying the right software - it’s about planning a strategy that balances user autonomy with data accuracy, security, and trust. Around 80% of self-service analytics projects fail when treated as mere software purchases rather than carefully executed initiatives [15]. The key to success lies in thoughtful implementation and governance.
A phased rollout strategy works best. Begin with a "Lighthouse Project" in the first 8 weeks, targeting a motivated team that can deliver quick wins. From weeks 9-20, expand cautiously while refining governance practices. Once these steps are complete, scale up to an enterprise-wide rollout. This approach allows you to adapt based on real-world usage patterns. A well-structured semantic layer is essential for maintaining consistency and trust in your metrics.
Building a Governed Semantic Layer
The semantic layer is the backbone of reliable self-service analytics. It acts as a translator, converting complex database structures into business-friendly terms, ensuring metrics like "revenue" or "churn" are calculated uniformly across teams [15]. Without it, conflicting metrics and semantic layer definitions can create confusion and erode trust in your data.
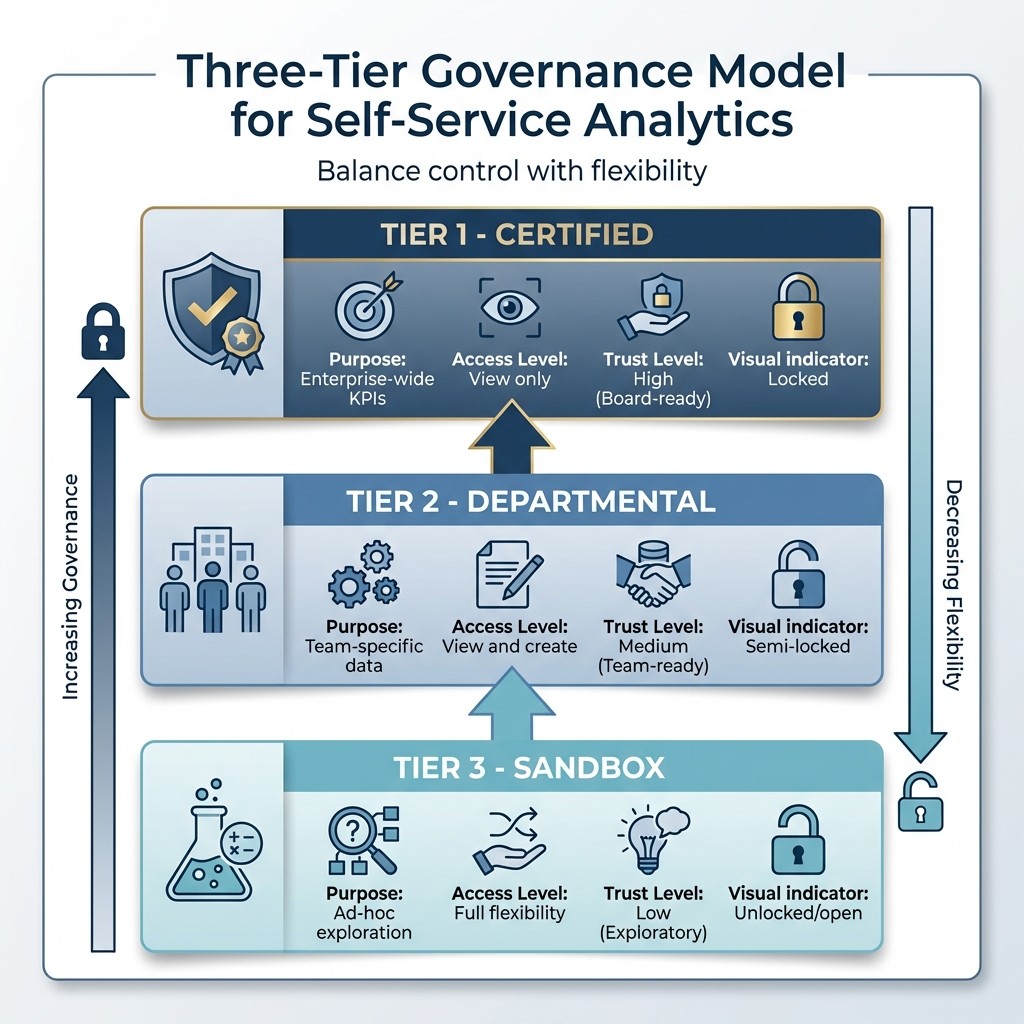
A three-tier governance model is often the most effective way to balance control and flexibility [15]:
Governance Tier | Purpose | Access Level | Trust Level |
|---|---|---|---|
Certified | Enterprise-wide KPIs | View only | High (Board-ready) |
Departmental | Team-specific data | View and create | Medium (Team-ready) |
Sandbox | Ad-hoc exploration | Full flexibility | Low (Exploratory) |
This structure ensures standardized enterprise metrics while allowing teams the freedom to explore data in sandbox environments. As Daniel Trimmer of Abercrombie explained:
Our definition of governance, of how we look at data, has altered in a way. It used to be self-service - get whatever data you want, but we can't guarantee where it came from - to now building standards and consistency around it [16].
Governance involves two key components: data governance, which ensures the accuracy of the data itself, and content governance, which manages dashboards and reports - how they’re shared, discovered, and retired [14][16]. Both require distinct processes and ownership.
To maintain trust, use automated tools to monitor data quality. These tools can check for data freshness, volume, and schema changes, alerting IT to potential issues before users encounter errors [15]. Additionally, regularly clean up your content by archiving dashboards that haven’t been accessed in 90 days. This keeps the platform uncluttered and user-friendly [15].
Increasing User Adoption and Data Literacy
Getting users on board goes beyond training - it’s about shifting your organization’s mindset toward data-driven decision-making. The goal is to empower non-technical users while maintaining data integrity.
Identify champions within departments. These are analytically inclined individuals, like a marketing manager skilled in Excel, who can receive advanced training and mentor their peers [15]. They act as advocates, helping others understand the platform’s potential.
PepsiCo provides a great example. In 2020, their CPFR team transitioned from Microsoft Access and Excel to a modern analytics platform, consolidating data and slashing analysis time by 90% [10]. They achieved this by offering sandbox environments where users could safely experiment before finalizing their work [10].
Prebuilt templates and reports can also lower the learning curve for non-technical users [5]. These resources provide a starting point and demonstrate best practices for analysis and visualization.
Training should be tailored to roles and ongoing. Administrators should focus on optimization and security, while business users need training in data discovery and visualization [5]. Use a mix of video tutorials, workshops, support chats, and FAQs to cater to different learning preferences [5].
Governance should be seen as empowering, not restrictive. Sriram Belur of JPMorgan Chase highlights this balance:
Allowing self-service in one of the most highly regulated spaces - having the standard platform, the right data controls and the right governance in the tool that captures metadata and provides lineage of it in Tableau - users love it because they don't have to wait for IT and IT loves it because they have happy users [16].
Maintaining Security and Compliance
Once user adoption is underway, safeguarding data becomes a priority. Enterprises need robust security measures to protect sensitive information while ensuring legitimate access. Start with role-based permissions to control who can view, edit, and export data. These permissions should align with your governance tiers but remain simple for administrators to manage.
Centralized data access via a secure server eliminates the need for local database drivers or direct credentials, giving IT full visibility into data usage while maintaining a seamless user experience [17].
Enterprise deployments also benefit from single sign-on (SSO) integration, which simplifies user management and enforces consistent access policies. It minimizes risks like credential sharing or unauthorized access.
For industries handling sensitive data, compliance with standards like SOC 2 Type II is crucial. This demonstrates that your platform meets strict security and privacy requirements, especially for managing financial or personal data [1].
Finally, automated tools for usage monitoring and auditing can help track platform activity, flag potential security concerns, and optimize performance [3]. Security and compliance aren’t static - they require constant updates to keep pace with evolving data, users, and regulations.
Conclusion
The advantages of self-service analytics stand out clearly. These platforms remove IT bottlenecks, enabling teams to access critical business insights in real time. Instead of waiting on IT tickets, departments like finance, marketing, HR, and operations can independently gather and analyze data. As Mike Chen from Oracle highlights, this technology shifts the power from traditional gatekeepers to tools that allow nonexperts to work with data directly [1].
When implemented effectively, self-service analytics can reduce decision-making time by 50% [18] and increase active data usage by 85% [18]. This shift helps organizations transition from intuition-based decisions to strategies grounded in reliable, consistent data. With every department - from sales to supply chain - relying on the same metrics and definitions, businesses can move faster and with greater confidence.
Creating a data-driven culture requires more than just technology; it calls for strong governance, ongoing training, and a focus on improving data literacy. The rewards are substantial: companies that embrace data-driven strategies are 23 times more likely to attract new customers and 6 times more likely to retain existing ones [18]. In today’s fast-paced environment, the ability to analyze data, test ideas, and adapt to market changes in real time has become essential.
The key lies in choosing platforms that balance user independence with governance. The most effective tools empower users to explore data freely while ensuring security, compliance, and data accuracy. Features like AI-driven insights, natural language queries, and governed semantic layers help bridge the gap between business questions and actionable solutions. By adopting such platforms, organizations position themselves for a future where data-driven decisions are both agile and secure.
FAQs
What is a semantic layer, and why does it matter?
A semantic layer takes complex data and makes it easier to understand by translating it into terms that align with business language. It also creates a unified set of metrics, ensuring everyone interprets data the same way. This approach allows business users to explore insights on their own, without constantly needing IT support. By cutting through the complexity, it helps teams make better, data-driven decisions.
How do we prevent “report sprawl” as usage grows?
Preventing "report sprawl" starts with having a solid governance framework in place. IT teams play a crucial role here - they need to define certified datasets, keep track of data lineage, and implement access controls. These steps ensure the data remains consistent and trustworthy.
But it’s not just an IT task. Collaboration between IT and business units is essential. IT provides the infrastructure and tools to govern the data, while business users create reports within the guidelines. This partnership ensures everyone stays aligned.
To keep things running smoothly, standardized processes, clear best practices, and automation are key. These measures help maintain data quality and prevent an overload of unnecessary reports.
What’s the best way to roll this out without breaking governance?
To introduce self-service analytics while maintaining governance, it's crucial to set up clear boundaries. This includes implementing role-based access controls, monitoring data lineage, and automating compliance checks. Encouraging collaboration between IT and business teams is also key - provide them with reliable data sources and keep communication channels open.
Begin with smaller, high-impact projects to test the waters. Use robust controls to safeguard data and focus on training users to strike the right balance between flexibility and governance. This approach not only promotes agility but also lays the groundwork for scaling analytics efforts effectively.
Related Blog Posts


