Business Intelligence
Moving Off Power BI: A Data Team's Migration Guide
Treat a BI platform move as a governance and dependency project: inventory assets, map metrics and security, pilot, and cut over in waves.

If you’re leaving Power BI, don’t start with dashboards. Start with inventory. In many teams, about 30% of reports go unopened for 12 months, which means part of your estate may not need to move at all. And for a 50–100 report setup, a move often takes 8–12 weeks. Larger estates can take months.
If I were planning this move, I’d keep the plan simple:
- List every asset first: reports, semantic models, refreshes, gateways, role-based security, subscriptions, embeds, and service accounts
- Score each item by usage, business impact, security risk, and rebuild effort
- Map logic before rebuilds: DAX, calculated columns, fiscal calendars, joins, and metric rules
- Pick the target setup after discovery, not before
- Run a small pilot first: one dashboard, one metric area, and one secured workflow
- Cut over in waves, test parity, and retire Power BI only after sign-off
The main idea is simple: this is not a dashboard redesign project. It’s a move of logic, access, refresh behavior, and downstream usage. If you skip that work, you risk broken metrics, bad permissions, and users landing on dead links.
A short way to think about it:
| Step | What I’d focus on |
|---|---|
| 1 | Inventory everything tied to Power BI |
| 2 | Remove old or unused assets from scope |
| 3 | Document metric logic, model rules, and security |
| 4 | Choose the replacement setup based on facts |
| 5 | Pilot and compare numbers, access, and refresh timing |
| 6 | Move by business domain and shut down in stages |
Bottom line: I’d treat the migration as a governance and dependency project first, and a reporting project second.
::: @figure 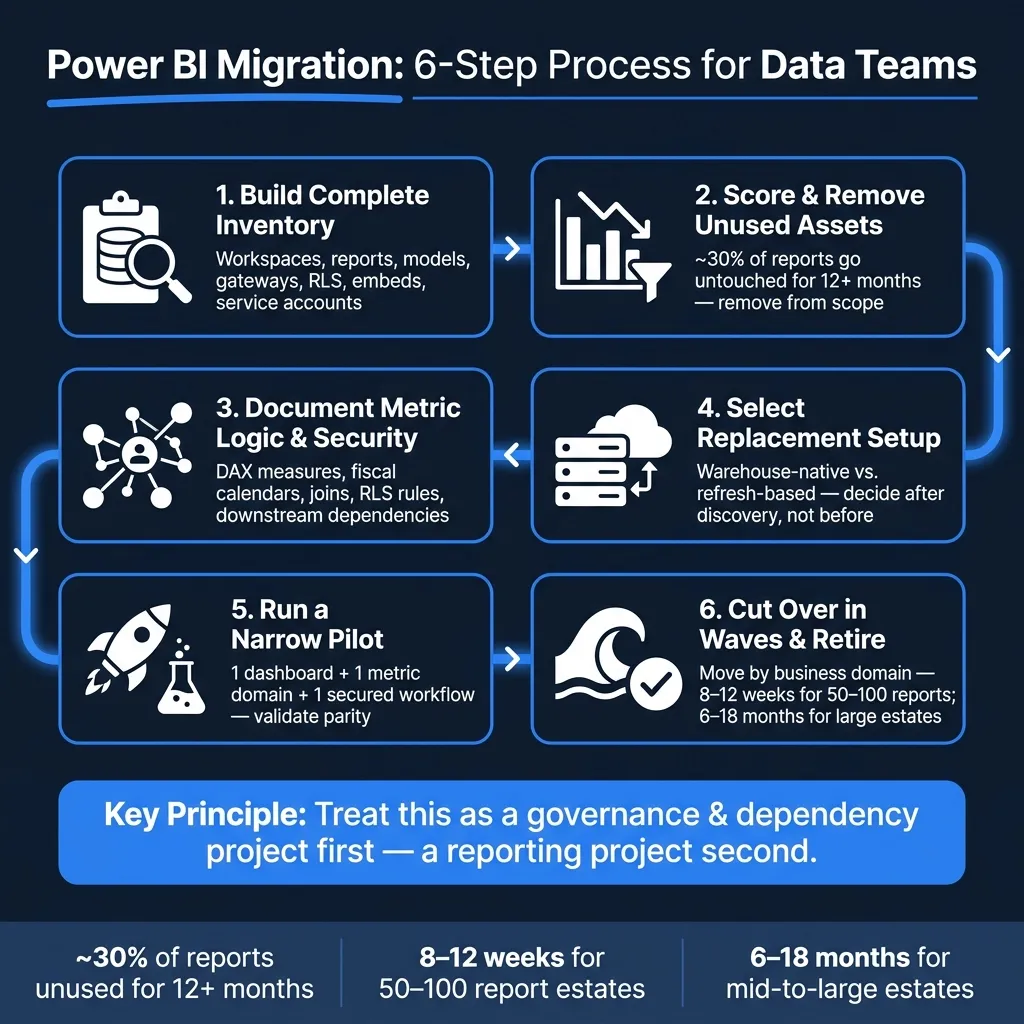 {Power BI Migration: 6-Step Process for Data Teams}
:::
{Power BI Migration: 6-Step Process for Data Teams}
:::
Power BI to AI BI: The Migration Shortcut You Need
::: @iframe https://www.youtube.com/embed/AK3XbJ00aHE :::
Build a complete inventory of Power BI assets and dependencies
Start by pulling workspaces, reports, refresh history, and usage counts from the Power BI Admin API and activity logs. That lets you audit the estate without combing through the portal by hand. Then add a structured manual review for the gaps automation won't catch, like paginated reports, dataflows, and embedded surfaces inside internal apps.
As you log each item, tag it in one of three states: automatically discovered, manually confirmed, or unknown. That simple habit makes confidence gaps obvious before you make any migration calls.
Work through the asset audit across:
- Workspaces, reports, dashboards, and paginated reports
- Semantic models, dataflows, and DAX measures and calculated columns
- Data sources, gateway clusters, and stored credentials
- Refresh schedules
- RLS roles and their membership mappings
- Subscriptions, sharing links, and public links
- Embedded reports and their iframe or SDK configurations in app surfaces
- Service accounts and their permissions
For every item, record four things: who owns it, who uses it, when it was last opened, and how much it matters to a business decision. If any of those answers are missing, mark the asset unknown and flag it for manual follow-up before it moves into a migration wave.
Score each asset by usage, risk, and migration effort
Once the inventory is done, sort each asset by risk and effort. Look at usage and unique users over time. An executive pipeline dashboard opened every day by 15 people belongs in a very different tier from a quarterly finance report opened twice a year by one analyst.
Then add four more signals: criticality (does a VP or C-suite rely on it?), semantic model complexity (how many DAX measures, relationships, and calculated columns are in play?), security sensitivity (does it use RLS to limit data by region, role, or entity?), and downstream dependencies (does anything else pull from the dataset?). If an asset scores high across all four, it belongs in the last migration wave, not the first.
| Asset | Owner | Consumers | Last Used | Criticality | Complexity | Security Sensitivity | Proposed Action | Wave |
|---|---|---|---|---|---|---|---|---|
| Revenue Dashboard | Finance Lead | 22 | Sep 2026 | High | High | RLS by region | Rebuild + validate | 3 |
| Marketing Spend Report | Marketing Ops | 8 | Jul 2026 | Medium | Medium | None | Rebuild | 2 |
| HR Headcount Summary | HR Analyst | 3 | Jan 2026 | Low | Low | RLS by department | Retire or merge | 1 |
| Embedded ARR Widget | RevOps | 14 | Sep 2026 | High | Medium | None | Rebuild + embed test | 3 |
| Quarterly Board Deck | CFO | 5 | Jun 2026 | High | High | None | Rebuild + parity check | 3 |
If an asset has no owner, no clear usage pattern, and no live source connection, leave it out of the first migration wave. Roughly 30% of a typical report estate goes untouched for over 12 months [1], so there's a good chance part of your inventory doesn't belong anywhere near an early-wave move.
Find the dependencies that usually get missed
The dashboard people see is rarely the part that breaks during cutover. The trouble usually comes from hidden dependencies, the stuff nobody wrote down.
Common problem areas include shadow spreadsheets pulling from exported Power BI data into a separate finance model, emailed exports that get forwarded across teams, Slack or Teams links to reports, and embedded report surfaces inside customer portals or internal ops tools with hardcoded report IDs. These are exactly the kinds of dependencies that need manual review.
Gateway-bound refreshes cause problems too. Gateway registrations and stored credentials are tenant-specific and must be recreated in the target environment [2]. That means every gateway cluster and every service account tied to a data source needs a manual inventory.
The best way to catch this is a dependency interview with every named business owner on your asset list.
Does anything downstream consume this report's output outside of Power BI?
That one question tends to surface the hidden dependencies teams miss on their own.
Use the inventory to map each asset's logic, refreshes, and security before you rebuild anything.
Map semantic models, metrics, and security before rebuilding anything
The biggest migration risk usually isn't the charts. It's the business logic tucked inside semantic models: measures, date rules, relationships, and aggregation logic. That's the stuff people stop noticing because "it just works" - until a migration breaks it.
Use your asset inventory to pull the exact models, measures, and RLS rules that need to be rebuilt. For each shared model, document:
- source tables
- join keys
- cardinalities
- calculated columns
- measure logic
Do the same for date rules. Fiscal year start dates, week numbering, and time zone handling need to be rebuilt on purpose in the warehouse. A dbt date dimension is often the cleanest place to handle that. Then use everything you've documented to build a feature-mapping table before you rebuild anything.
Build a feature-mapping table for logic, refreshes, and RLS
Once the logic is documented, map each Power BI feature to its replacement design. This table becomes your migration contract. It shows engineers and analysts what must be rebuilt, what can be simplified, and what can be retired.
| Power BI Feature | Required Behavior | Replacement Design | Migration Action |
|---|---|---|---|
| Shared Semantic Models | Centralized logic reused across reports | Warehouse-native dbt models | Equivalent |
| DAX Measures | Business metric definitions | SQL or Python in semantic layer | Manual/AI rewrite |
| Import Refreshes | Scheduled data freshness | Scheduled warehouse loads or dbt runs | Redesign - retire refreshes |
| DirectQuery Patterns | Near-real-time data | Live warehouse connection | Equivalent |
| Calculated Columns | Row-level derived logic | Upstream SQL/dbt transformations | Redesign |
| Date/Fiscal Calendars | Fiscal year, week, and time zone logic | dbt date dimension models | Manual recreation |
| Row-Level Security | Governed data access by role or region | Warehouse-native RLS or RBAC | Manual recreation |
| Dataflows | ETL/ELT preprocessing | dbt models or ELT pipeline | Convert to dbt |
The point of this step is simple: figure out what has a straight replacement and what needs an actual architecture call. RLS almost always falls into the second group. User-to-attribute mappings and filter predicates have to be rebuilt directly in the target setup. They don't just come along for the ride.
Once the mapping is done, use it to pick the first pilot dashboard, metric domain, and secured workflow.
Move core metrics into a governed context layer
The main governance risk is metric drift. One team's revenue metric starts to differ from another team's revenue metric, and suddenly every meeting turns into a math debate.
To avoid that, write down the source-of-truth definitions for core metrics like revenue, bookings, churn, gross margin, and active customers in SQL or Markdown before rebuilding dashboards. If your team uses dbt, this fits neatly next to your dbt models in the same repo. That gives you one governed metrics layer that can work across tools.
Querio's context layer stores metric definitions, joins, and trusted queries as editable SQL, Markdown, or Python files in Git alongside dbt, so the governance layer stays inspectable and reusable. That gives you a governed metric layer to pilot before cutover.
Choose the replacement architecture and run a pilot
The main decision is simple: should the new platform query your warehouse directly, or should it copy data into a separate storage layer and rely on scheduled refreshes?
That choice shapes almost everything that comes next. Use your inventory and feature map to figure out which setup can actually replace what you have today. For governed analytics teams, warehouse-native is usually the better default.
Use decision criteria that match how your data team actually works
The right setup for a 150-person B2B SaaS company will not look the same as the right setup for a 400-person healthcare organization operating under HIPAA. So treat the table below as a decision checklist, not a product shootout. Fill in the Target Design column based on your stack, your security needs, and your compliance rules.
| Requirement | Why It Matters | Current Power BI Implementation | Target Design (Warehouse-Native) | Owner |
|---|---|---|---|---|
| Metric Logic | Prevents conflicting numbers across teams | DAX measures inside .pbix files |
Centralized dbt models or semantic layer | Analytics Lead |
| Data Freshness | Critical for real-time GTM and ops decisions | Scheduled refreshes (Import Mode) | Live warehouse connection (Snowflake, BigQuery, Redshift) | Data Engineer |
| Security & Compliance | HIPAA, SOC 2, and audit requirements | Workspace-level permissions | RBAC + SSO + warehouse-native RLS | Security / IT |
| Change Control | Auditability and rollback | Manual versioning / PBI Service history | Git-based version control (dbt / YAML / SQL files) | Analytics Engineer |
| Cost Control | Avoids surprise cloud bills | Fixed license costs (Pro / Premium) | Usage-based compute monitoring with spend caps | Finance / Data Lead |
| Self-Serve Access | Reduces analyst ticket queue | Pre-built dashboards only | Natural-language querying + notebooks | Product / Ops |
If your compliance team can't see how a number was produced and verify who can access it, then your audit trail is incomplete. That's a red flag.
And if you're running on Postgres or Redshift with strict data residency rules, check the deployment model and security controls before cutover. This is the kind of detail that can trip up a migration late in the process.
Querio connects live and read-only to Snowflake, BigQuery, Redshift, ClickHouse, and Postgres. It keeps query logic in inspectable SQL or Python during the migration, so nothing turns into a black box during cutover.
Pilot one dashboard, one metric domain, and one secured workflow
Once the target design is locked in, prove it with a narrow pilot. Keep it tight. The point of the pilot is parity: the same numbers, the same access controls, and the same freshness guarantees.
Migrate these three pieces in the pilot:
| Pilot Component | Implementation Detail | Success Criteria |
|---|---|---|
| One Dashboard | Executive Revenue Scorecard | 100% data parity with legacy Power BI totals |
| One Metric Domain | Fiscal Calendar & Revenue (MRR/ARR) | Logic validated in inspectable SQL/Python |
| One Secured Workflow | RLS enforced in the warehouse and verified through SSO/RBAC | Verified SSO/RBAC propagation to warehouse |
Start by tracing the DAX measures and source tables from the feature-mapping work. Then rewrite that logic in SQL or Python and compare the results against the Power BI version before sign-off.
After that, test row-level security with real production roles. In a warehouse-native setup, RLS has to be enforced in the warehouse, then checked through SSO and RBAC propagation. Use the same roles you expect in production. If the security review fails, stop there and fix it before moving ahead.
Validate parity, cut over in waves, and retire Power BI safely
Once the pilot is green, move by business domain instead of raw report count. That approach keeps the blast radius smaller if something goes wrong [2].
Run both systems side by side for one full reporting cycle. Then redirect users only after the headline metrics line up within the agreed tolerance. Before any redirect happens, check the rebuilt metric layer, security, and refresh behavior.
Test data parity, security, and operations before each wave
Bring the pilot checks into every wave. That means metric parity, security checks, and data freshness checks all carry forward. Use the mapped metric logic and security rules as the baseline each time. And before users move over, each wave needs a signed-off parity checklist.
| Test Case | Power BI Result | Target Result | Tolerance | Evidence | Owner | Status |
|---|---|---|---|---|---|---|
| Row Counts | 1,250,400 | 1,250,400 | 0% | SQL Query Log | Data Eng | Pass |
| Total Revenue | $4.2M | $4.2M | <0.01% | Finance Export | Finance Lead | Pass |
| RLS - Regional | View: West | View: West | 0% | User Impersonation | Security Admin | Pass |
| Refresh SLA | 15 mins | 12 mins | N/A | Refresh History | Data Eng | Pass |
| Fiscal Period | Q3-2026 | Q3-2026 | 0% | Report Screenshot | Metric Owner | Pass |
Don’t stop at a config review. Verify Row-Level Security (RLS) memberships and workspace permissions through user impersonation. That’s the only way to confirm people see what they’re supposed to see - and nothing else.
If the RLS rules don’t match the target model or any sensitive data is exposed, stop the wave.
Migration rules that prevent breakage
After a wave is stable, move from validation into legacy cleanup. Archive reports that haven’t been used for 60 to 90 days. For assets that pass parity, set the matching Power BI dashboards to read-only and stop all new development for those assets in Power BI.
Then set a firm sunset date 30 days out. Share that date clearly with named business owners, and keep the legacy versions archived until formal sign-off comes in.
Only decommission Power BI Pro licenses and Premium capacity after comparing alternative analytics platforms and ensuring three things are done:
- All waves are stable
- All report URLs are redirected so users don’t land on broken links
- Business owners sign off in writing
As a planning guide, expect 8 to 12 weeks for a 50 to 100 report estate, and 6 to 18 months for mid-size to large estates.
FAQs
::: faq
How do I know which Power BI reports not to migrate?
Run a usage audit with Power BI Service metrics to spot reports that haven’t been opened in the past 12 months. Then cut the clutter: retire reports with no clear business purpose, no assigned owner, or overlapping metrics that leave teams second-guessing what to trust.
Put your migration effort into high-signal assets that support critical decisions. That way, you move what matters and leave the dead weight behind. :::
::: faq
What usually breaks first during a Power BI migration?
The first things that usually break sit under the report layer: tenant boundaries, gateway registrations, semantic model bindings, and row-level security. Those pieces don’t move over on their own, and that’s where trouble starts. After cutover, teams often run into broken credentials, stale data, or the wrong access settings.
Complex DAX measures and hardcoded workarounds also tend to fail. That’s especially true when they rely on very specific filter contexts or proprietary logic that doesn’t map cleanly to a warehouse-native setup. :::
::: faq
How should I test metric and security parity before cutover?
Run a pilot that compares your legacy system and new platform side by side using the exact same date ranges, filters, and datasets. Then review the key metrics line by line. If something doesn’t match, trace it back to the source. In most cases, the gap comes from a transformation error, definition drift, or a filter that was applied the wrong way.
For security, make sure row-level security memberships and workspace access permissions carry over correctly to the target model. Don’t stop at visual checks alone. A dashboard can look fine and still expose the wrong data, so test access rules across user groups and confirm they’re enforced the same way every time. :::