Business Intelligence
natural language analytics self service dashboards
Use natural language analytics and self-service dashboards to query live data in plain English — faster decisions, consistent metrics, and real-time visual insights.
Natural language analytics and self-service dashboards are reshaping how businesses use data. Instead of relying on technical experts, anyone can now ask questions in plain language and get immediate, clear answers. This shift empowers teams to make faster decisions, access real-time data, and collaborate more effectively - all without needing to learn complex tools or coding.
Key Takeaways:
Natural language analytics allows users to query data conversationally, like asking, "What were our top-selling products last quarter?"
Self-service dashboards eliminate delays by letting teams analyze data directly, without waiting for reports.
Core technologies include natural language processing (NLP), a semantic layer for self-service BI to translate technical data into business terms, and live querying for real-time insights.
Benefits include easier data access, faster decision-making, and improved team alignment.
By combining these tools, businesses can democratize data access and foster a more data-driven approach across all departments.
Text to SQL: Building an LLM-Powered Analytics Dashboard for Your Company
Core Components of Natural Language Analytics
Natural language analytics brings together several advanced technologies to turn conversational queries into actionable insights. By understanding these components, it becomes clear how this system delivers such smooth, user-friendly experiences and why it represents a shift from self-service BI tools.
Natural Language Processing and Understanding (NLP/NLU)
At the core of natural language analytics are NLP and NLU - technologies designed to interpret user questions and convert them into precise data queries. For instance, when someone asks, "Show me sales trends for the Northeast region", the system identifies intent, key metrics, and filters to generate the correct query.
Here’s how they differ: NLP focuses on the structure of language, handling grammar, identifying parts of speech, and recognizing entities like dates, locations, or product names. NLU goes deeper, interpreting context and intent. It understands that "last quarter" refers to the most recent three-month period ending at a quarter close, not just any random 90 days. Similarly, it knows that "top performers" means sorting and limiting results, and "compare" suggests a need for side-by-side analysis.
The system also tackles ambiguity. If a user asks about "customers" without specifying whether they mean total customers, new customers, or active customers, it can either infer the intent from context or ask for clarification.
In multi-turn conversations, it maintains context. For example, after asking, "What were our Q3 sales?" a user can follow up with "Break that down by product category", and the system will apply the new dimension without requiring the user to restate the timeframe or metric.
This language understanding lays the groundwork for the next step: translating data into terms that make sense for business users.
Semantic Layer for Business Context
Building on the language understanding capabilities, the semantic layer acts as a translator, converting technical data into user-friendly business terms. For example, while a database might store customer data in tables like "cust_acct_master" with fields such as "acct_create_dt", business users think in terms of "customers" and "signup date." The semantic layer bridges this gap.
It serves as a shared dictionary, ensuring consistency across the organization. For instance, when marketing asks about "customer acquisition cost" and finance refers to "CAC", the semantic layer recognizes both as the same metric and calculates it using the same formula. This eliminates confusion caused by inconsistent definitions across teams.
The semantic layer also encodes business rules and relationships. It knows that revenue excludes returns and refunds, understands that "active customers" refers to accounts with at least one transaction in the past 90 days, and recognizes hierarchies like products rolling up into categories, which roll into divisions and business units. So, when someone asks about "West Coast sales", it automatically includes California, Oregon, and Washington without requiring manual input.
Additionally, it handles calculated metrics and aggregations. Users don’t need to know that gross margin is calculated as revenue minus cost of goods sold, divided by revenue - they simply ask for "gross margin", and the system performs the calculation. It also understands which metrics should be summed (like revenue), averaged (like satisfaction scores), or require more complex logic (like weighted averages or unique counts).
As the organization evolves - whether through new products, expanded regions, or updated metrics - the semantic layer adapts. Updates to this layer automatically reflect across all dashboards and queries, sparing users the need to learn new terms or adjust their questions.
Once data is contextualized, the next step is delivering insights through live querying and visualization.
Live Querying and Visualization
After interpreting the question and mapping it to the business context, the system constructs optimized queries to retrieve live data and present it in relevant visual formats. This process happens in seconds, providing instant answers.
Live querying ensures users access the most up-to-date information. For example, when a sales manager checks "today's pipeline value", they see deals updated just minutes ago, not yesterday’s totals. This real-time access supports quick decision-making, empowering teams to respond to issues or opportunities as they arise.
The system also selects appropriate visualizations automatically. Trend-related questions generate line charts, category comparisons produce bar charts, and questions about proportions result in pie charts or stacked bars. Geographic queries trigger map visualizations. While users can customize these visualizations, the default choices often eliminate the need for extra formatting.
Behind the scenes, performance optimizations ensure speed. The system aggregates data at the right level, uses pre-computed summaries when possible, or caches frequently requested results. These efficiencies ensure even large datasets return answers fast enough to maintain the conversational flow.
Together, these three components - language understanding, business context, and live querying with visualization - create a system where asking about data feels as natural as searching online or chatting with a colleague. The technical complexity stays hidden, allowing users to focus on insights instead of the mechanics.
Benefits of Natural Language Analytics in Self-Service Dashboards
Switching from traditional dashboards to those with natural language capabilities brings quicker insights, wider data accessibility, and better teamwork. These benefits grow as more people feel confident engaging with data.
Here’s how these advantages take shape:
Making Data Exploration Easier for Everyone
Natural language analytics opens up data to everyone, even those without technical expertise. Whether it’s a marketing manager or a sales rep, users can ask questions in plain English - no need to learn complicated query languages or navigate complex dashboards. For instance, a sales director trying to figure out why sales dipped in a specific region can simply ask and get a clear breakdown of the reasons.
This simplicity helps new team members hit the ground running, analyzing data right away. Meanwhile, data experts are freed up to focus on strategic projects rather than building analyst-grade dashboards for basic queries.
Faster Access to Insights
Natural language analytics doesn’t just make data easier to explore - it speeds up decision-making too. Getting accurate, timely insights is crucial for making smart decisions, but traditional workflows often involve multiple steps that slow things down. With natural language analytics, users get instant answers, allowing them to refine their questions and dig deeper into the data.
This quick turnaround means managers and executives can test ideas and make decisions in real time. It creates a more dynamic environment where organizations can quickly adapt to new opportunities or challenges.
Boosting Team Collaboration
Quick insights also improve collaboration by ensuring all teams are working with the same definitions and metrics. Without a shared understanding, departments can end up misaligned, causing confusion. Natural language analytics solves this by standardizing definitions, eliminating discrepancies, and improving communication across teams.
Additionally, the ease of sharing insights enhances teamwork. When team members can share the exact query they used, others can replicate, verify, or even build on the analysis. This shared approach simplifies cross-functional projects and strengthens a data-focused company culture.
Implementing Natural Language Analytics with Querio
Once you grasp the potential of natural language analytics, the next step is choosing a platform that delivers on that promise. Querio is built to simplify natural language analytics for organizations of all sizes. It integrates smoothly with your existing data systems while prioritizing strong governance and security practices.
Querio's Key Features for Natural Language Analytics
Querio connects directly to your data warehouse - whether that's Snowflake, BigQuery, or Postgres - without needing to copy or move data. This ensures you’re always working with the latest information while keeping your data securely in its original location.
The platform’s semantic layer brings consistency to your data operations. Data teams can define table joins, business metrics, and glossary terms once, making these definitions accessible across the entire organization. For example, if a marketing manager asks about "customer acquisition cost" and a finance analyst asks the same question, both receive results based on identical calculations.
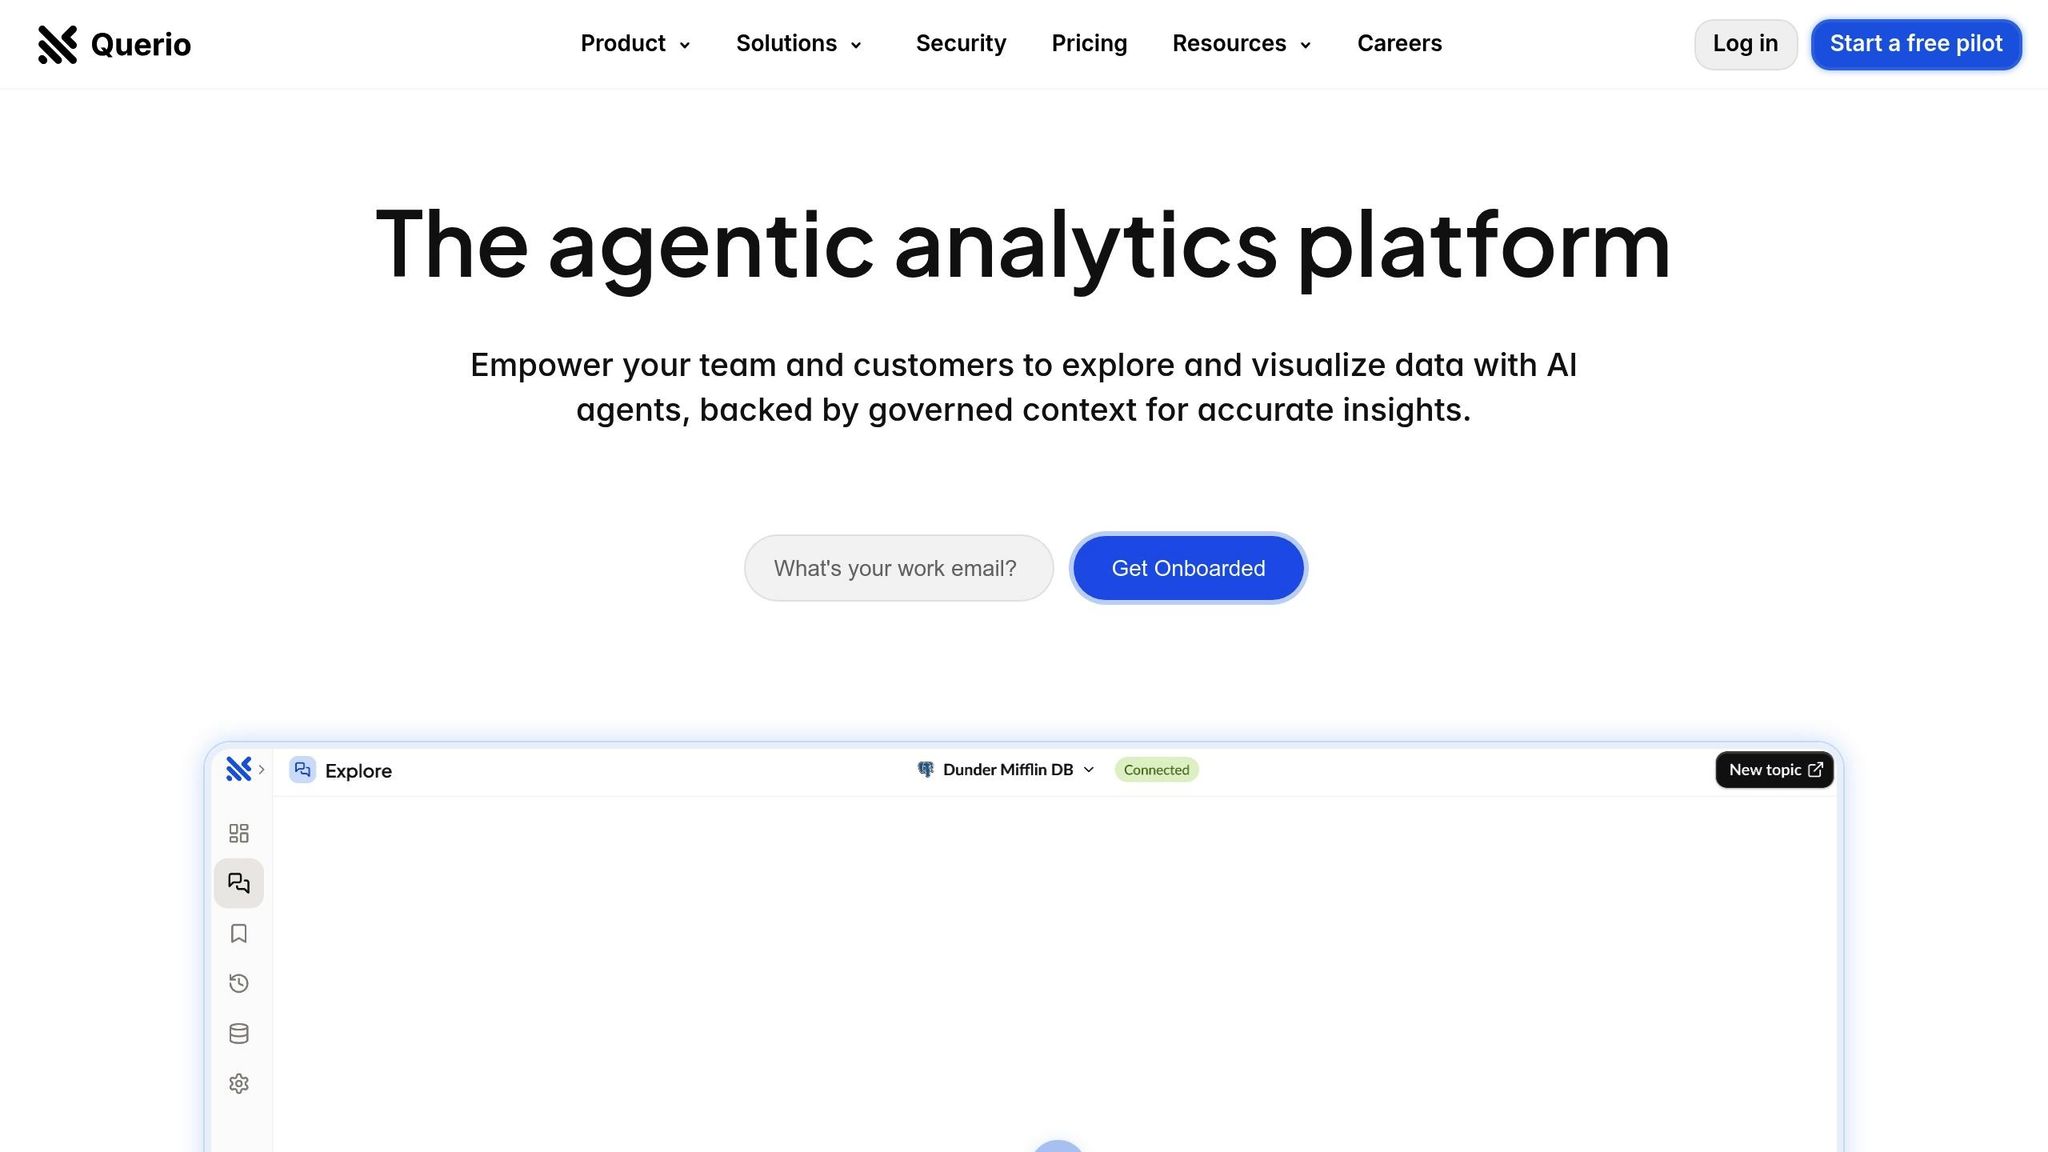
Querio makes querying data straightforward with its AI-driven natural language interface. Users can ask questions in plain English and instantly see accurate visualizations - no SQL or complicated dashboards required. A product manager might type, "Show me sign-ups by region for the last 90 days", and get an immediate chart. They can then refine the query, such as breaking it down by pricing tier, with results updating in real time.
For more advanced users, Querio offers a Python notebook environment with built-in AI support. Analysts can write SQL or Python code with AI assistance, all while working on the same governed data that powers natural language queries. This creates a seamless collaboration space for both technical and non-technical users.
Querio also supports embedded analytics tools, enabling you to provide the same natural language experience directly within your product. This means your customers can gain insights without needing a separate reporting system.
Additionally, the platform’s drag-and-drop dashboards make it easy to track KPIs and share insights across teams. Scheduled reports ensure executives stay informed without needing to log in, and unlimited viewer access allows data to be shared broadly across the organization.
All of these features are built on a foundation of strong security measures.
Governance and Security for Reliable Analysis
Reliable insights depend on solid governance and security. Querio is SOC 2 Type II compliant and provides a 99.9% uptime SLA, ensuring your data is secure and consistently available. Encrypted, read-only connections protect your data from accidental changes, while the centralized semantic layer ensures consistent governance of key metrics. Any updates to critical calculations are automatically applied across all queries, ensuring accuracy and alignment throughout your organization.
Steps to Roll Out Natural Language Dashboards
Implementing natural language dashboards requires careful planning to ensure your team can quickly start asking questions and receiving answers. At the same time, you're laying the groundwork for broader adoption across your organization.
Assess Data Readiness
Before launching dashboards, make sure your data is in good shape. Start by reviewing your data warehouse setup. Platforms like Snowflake, BigQuery, or Postgres are excellent choices since they support live connections. The focus should be on ensuring your tables are well-organized and that relationships between datasets are clearly defined.
The real work happens in building a semantic layer that understands your business. This is where you map out how tables connect, define key business metrics, and establish consistent terminology. It’s essential to document frequently used metrics and common queries from each department to maintain clarity and consistency.
Address any issues like missing data, inconsistent formatting, or outdated records. For example, standardizing currency formatting can prevent confusion during queries. Tackle these problems upfront to avoid disruptions later.
Once your data and semantic definitions are in good shape, you’re ready to test the dashboards with a smaller group.
Pilot and Iterate with Key Teams
Rolling out dashboards to the entire company right away can be overwhelming. Instead, start with a few pilot teams that represent different use cases. For instance, you might choose a product team, a finance team, and a customer success team, as they work with diverse datasets and have varying needs.
Provide these teams with access to Querio and let them explore the tool for two to four weeks. Encourage them to ask the kinds of questions they encounter in their daily work. This hands-on experience will quickly highlight any gaps in your semantic layer or areas where definitions need fine-tuning.
Hold weekly check-ins with the pilot users to address any issues and refine the system. Pay attention to queries that return unexpected results or take too long to process. If people are phrasing similar questions differently, update your glossary to include those variations.
This phase is also an opportunity to build internal advocates. For example, if someone on the finance team successfully uses the tool to answer a complex question without needing help from a data analyst, they’ll likely share their success with others. These early adopters can help train colleagues and provide valuable feedback on features that matter most.
Document the most common questions and successful use cases during the pilot. This creates a resource for new users when you expand access, helping them understand how to use natural language analytics effectively.
Use the insights from the pilot to establish performance benchmarks and guide future optimizations.
Measure and Optimize for Continuous Improvement
After launching the dashboards, track usage patterns to identify what’s working and where adjustments are needed. Monitor query volume, team activity, and how users interact with the tool. Look for queries that are abandoned or rephrased multiple times, and refine your semantic layer to improve accuracy. Querio’s governance tools ensure that updates to definitions are applied consistently across all future queries.
If you notice a high volume of queries about the same metric, consider adding it to a shared dashboard. This makes it easily accessible and reduces repetitive questions, keeping teams aligned on critical performance indicators.
Regularly collect user feedback through surveys or informal conversations. Ask whether they’re finding answers faster and if they trust the results. Trust is crucial - if users doubt the accuracy of the queries, they’ll revert to relying on data analysts for reports.
Measure the time savings across your organization. For example, if your sales team previously waited 24 to 48 hours for custom reports but now gets answers in seconds, that’s a clear win. Similarly, if product managers are making quicker decisions because they can validate assumptions immediately, make a note of those successes.
Plan quarterly reviews of your semantic layer to keep it up to date. As your business evolves, new metrics will become important, and old ones may no longer be relevant. Adjust definitions, add new table joins, and retire outdated terms to ensure the dashboards remain accurate and useful.
Pay attention to advanced users who start combining queries or creating more complex analyses. These power users often uncover opportunities to improve your data model or add new features. Their feedback can help prioritize updates that benefit everyone. By continuously refining the system, you’ll ensure your natural language dashboards stay agile and user-focused.
Conclusion
Natural language analytics is changing the way teams interact with data by removing the technical hurdles that once kept insights out of reach. Paired with self-service dashboards, this technology allows everyone in your organization to ask questions, spot trends, and make decisions without relying on data analysts or learning SQL.
Key Benefits Recap
Switching to natural language analytics brings three major advantages that can transform how businesses operate.
Simplified data exploration: With this approach, data becomes accessible to all users, regardless of their technical expertise. For example, a marketing manager can ask, "What’s our customer acquisition cost this quarter?" and receive an accurate answer in seconds - no need for SQL or understanding complex schemas. This puts insights directly into the hands of every team member.
Faster decision-making: Instead of waiting days for reports, teams can get answers instantly. Product teams can validate ideas on the spot, sales leaders can adjust strategies in real time, and finance teams can address budget questions without needing to create custom reports. What used to take 48 hours now takes seconds.
Improved collaboration: When everyone speaks the same "data language", sharing insights becomes seamless. Teams can confidently discuss metrics, share dashboards, and align on key performance indicators without needing technical mediation. A consistent metrics layer vs semantic layer ensures that terms like "revenue" mean the same thing across departments, from finance to sales to the executive team.
These advantages pave the way for a modernized approach to analytics.
Next Steps for Businesses
Now is the time to rethink your analytics processes. If your teams are still waiting on report requests or struggling with outdated BI tools, it’s worth asking: why should getting an answer take days or require specialized skills?
Start by identifying where your organization loses time in the analytics workflow. Are teams waiting too long for insights? Are the same questions being asked repeatedly? Do nontechnical users hesitate to explore data on their own? Pinpointing these pain points will highlight areas for improvement.
To take advantage of natural language analytics, evaluate your current tools and consider platforms like Querio. Querio connects directly to your data warehouse - whether it’s Snowflake, BigQuery, or Postgres - without duplicating your data. This ensures security while enabling natural language queries across your datasets. Its semantic layer guarantees accuracy and governance, while unlimited viewer access allows you to scale insights across your organization without worrying about extra costs. With SOC 2 Type II compliance and a 99.9% uptime SLA, Querio combines enterprise-level reliability with cutting-edge AI features.
You might start with a pilot program involving a few teams to see how this approach integrates into your workflows. Measure the impact in terms of time saved, questions answered, and decisions made faster. The results will make it clear whether natural language analytics can elevate your analytics strategy and unlock the full potential of your data.
FAQs
How does natural language analytics help teams make better decisions faster?
Natural language analytics makes decision-making easier by letting users work with data through plain, everyday language. This removes the need for specialized technical skills, allowing teams to access insights more quickly and without hassle.
With instant analysis and user-friendly data exploration, natural language analytics helps organizations make smarter, faster decisions based on data. It enhances productivity while encouraging a more inclusive and collaborative environment across teams.
How does the semantic layer help maintain consistent data across departments?
The semantic layer serves as a link between raw data and business users, offering a unified model that standardizes how information is defined and understood. For instance, terms like “sales” or “top customers” are interpreted the same way across all departments, cutting down on confusion and miscommunication.
By standardizing data definitions and metrics, the semantic layer ensures consistency in reports and analytics. This allows teams to make precise, informed decisions based on data, all without needing advanced technical knowledge.
What steps should businesses take to prepare their data for using natural language analytics in self-service dashboards?
To get your data ready for natural language analytics and self-service dashboards, the first step is to organize and clean your datasets. This involves tasks like removing duplicate entries, addressing missing values, and ensuring formats are consistent across the board. Well-labeled and properly structured data is essential for accurate natural language processing (NLP).
Once your data is clean, store it in a centralized, easily accessible location - such as a cloud-based platform. This ensures smooth integration with AI-powered tools. Additionally, establish clear data governance policies to maintain both consistency and security. These steps lay the groundwork for using NLP effectively, making your dashboards more intuitive and easier to navigate.
Related Blog Posts