Business Intelligence
Migrating from Tableau to an AI-Native Stack
Audit Tableau assets, centralize metrics in dbt and a governed semantic layer, run systems side-by-side, and retire dashboards in waves.

You do not need to replace Tableau all at once. I’d keep stable dashboards, move repeated ad hoc questions first, and shift metric logic out of workbooks into the warehouse, dbt, and a governed semantic layer.
Here’s the short version:
- I’d audit every workbook, data source, extract, permission, and subscription
- I’d sort each asset into retain, retire, consolidate, or rebuild
- I’d move shared KPI logic into dbt models and semantic metrics
- I’d rebuild high-use workflows as live dashboards, notebooks, and chat-based analysis
- I’d run Tableau and the new stack side by side until numbers and access match
- I’d cut over team by team and archive Tableau only after sign-off
The core idea is simple: stop storing business logic inside Tableau workbooks. Put metric definitions and access rules in one governed layer, then let dashboards, notebooks, and AI tools query that layer.
A few points stand out:
- Low usage does not mean low importance. A dashboard with few views may still feed a board deck, alert, or export.
- Reusable calculated fields should move first. That is where metric drift often starts.
- Permissions need to be rebuilt before rollout. Row-level security and group access are high-risk checks.
- Parallel validation matters. Compare daily, weekly, and monthly totals before retiring anything.
- A practical target is when about 70% of ad hoc questions are answered by the AI layer instead of going to the data team.
::: @figure 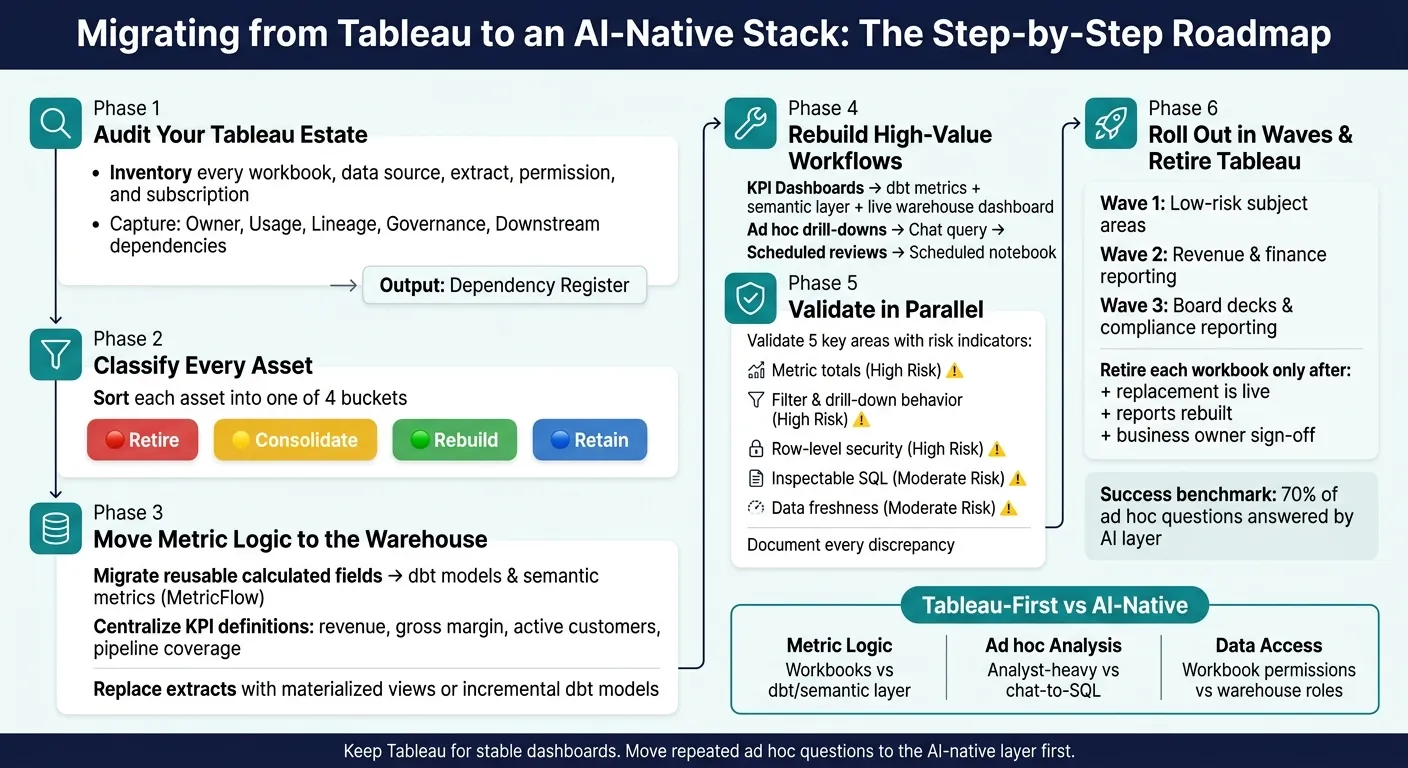 {Tableau to AI-Native Stack Migration: Step-by-Step Roadmap}
:::
{Tableau to AI-Native Stack Migration: Step-by-Step Roadmap}
:::
Migrate from Power BI, Tableau & Qlik to AI-Ready Analytics
::: @iframe https://www.youtube.com/embed/iyfhhZtgBqc :::
Quick comparison
| Area | Tableau-first setup | AI-native setup |
|---|---|---|
| Metric logic | Spread across workbooks and data sources | Centralized in dbt and semantic models |
| Ad hoc analysis | Analyst-heavy, filter-driven | Chat to SQL to notebook |
| Data access | Workbook and project permissions | Warehouse roles, group access, row-level rules |
| Refresh pattern | Often extract-based | Live warehouse queries plus caching or materialized models |
| Migration path | Rebuild dashboard by dashboard | Move workflows by business use case |
If I were doing this today, on September 26, 2026, I’d start with the teams that ask the same metric questions every week, prove parity, then shrink Tableau in waves instead of forcing a full cutover.
Audit Your Tableau Estate and Define the Target Stack
Start with a full inventory of every Tableau asset and dependency before you pick the target stack. The goal is a dependency register, not just a list of dashboards.
Inventory Workbooks, Data Sources, and Business Dependencies
Pull the inventory from Tableau administrative views for content, usage, lineage, refreshes, permissions, and users. For each asset, capture these five categories:
- Owner: Business owner, technical owner, and department
- Usage: Last viewed date, view frequency, and unique users
- Lineage: Underlying databases, tables, joins, calculations, filters, parameters, and custom SQL
- Governance: KPI definitions, row-level security rules, and user-group dependencies
- Downstream dependencies: Subscriptions, alerts, exports, embedded views, and recurring business reviews
A workbook with low view counts can still matter a lot if it feeds a subscription, an embedded app, or a regulatory process. Retire it without that context, and you can break a process nobody ever wrote down.
Once you have the inventory, score each asset on business criticality, usage, governance risk, and migration complexity. A low-view workbook tied to a board meeting or a compliance process may still need to be rebuilt early, even if only a few people touch it.
Map Tableau Concepts to Warehouse-Native Components
Next, map each asset to its warehouse-native owner: warehouse, dbt, semantic layer, AI assistant, and governed dashboard or notebook.
Don’t do a one-for-one rebuild. Match each Tableau asset to the component that best handles the same business job.
Calculated fields that hold reusable business logic, like revenue, gross margin, active customers, or pipeline coverage, should move into dbt models or a governed semantic layer through MetricFlow. Calculated fields used for one-off analysis or display logic can stay local to a dashboard, notebook, or ad hoc analysis.
Extracts also shouldn’t just turn into live queries by default. First, figure out why the extract exists. If it was a performance fix, a materialized view or incremental dbt model in Snowflake or BigQuery is often the right swap. If it served as a historical snapshot, you need an append-only model, not just a live connection.
Subscriptions should move to Slack, Teams, or email automations only after the replacement asset has been checked and access has been confirmed.
Tableau Assets vs. AI-Native Replacements: Side-by-Side Comparison
| Tableau Asset | AI-Native Replacement | Migration Effort | Governance Implication | Recommended Timing |
|---|---|---|---|---|
| Workbook / dashboard | Governed dashboard, notebook, or AI-assisted analytic workspace | Medium | Define the approved metrics, filters, and audience | Rebuild early for high-value, stable workflows |
| Published data source | dbt model, warehouse view, or governed semantic model | Medium–High | Centralize ownership, lineage, tests, and metric definitions | Address before dependent dashboards |
| Calculated field (reusable) | dbt model column or semantic metric via MetricFlow | Low–High | Prevents metric drift across teams | Migrate reusable logic first |
| Calculated field (presentation) | Local dashboard, notebook, or ad hoc analysis expression | Low | Keep local; not a company-wide definition | Migrate with the workflow |
| Extract (.hyper / .tde) | Materialized view, incremental dbt model, or cached query | Medium | Set freshness, cost, and performance expectations | Replace when source data is reliable |
| Parameter / filter | Semantic-layer dimension, dashboard control, or agent constraint | Low–Medium | Define allowed values; prevent ambiguous AI interpretation | Migrate with the workflow |
| Subscription | Email, Slack, Teams, workflow automation, or agent-triggered notification | Low–Medium | Preserve recipient authorization and sensitive-data controls | After successor is validated |
| Tableau project permissions | Identity-provider groups, warehouse roles, row-level policies, semantic-layer access rules | Medium–High | Reproduce least-privilege access before production rollout | Design before any rollout begins |
| Story / executive presentation | Governed dashboard, scheduled report, notebook, or generated briefing | Medium | Validate narrative consistency and snapshot requirements | Rebuild based on audience needs |
Classify every asset into one of four buckets: retire, consolidate, rebuild, or retain.
The map is done only when every asset has:
- a source
- a governed definition
- a replacement workflow
Once each asset is bucketed, use that map to rebuild the highest-value workflows in the next stage. With the target stack defined, the next step is to rebuild the highest-priority Tableau workflows as governed dashboards, notebooks, and chat-based analysis.
Rebuild Common Tableau Workflows in an AI-Native Model
Once the target stack is set, rebuild the workflows people use every day: KPI dashboards, ad hoc drill-downs, and scheduled business reviews. Use the asset map to tackle the highest-volume, highest-risk workflows first. That’s where mistakes hurt most, and where a clean rebuild pays off fastest.
Each workflow needs a different migration path.
Move KPI Dashboards to Governed Metrics and Live Dashboards
A common mistake is rebuilding a Tableau dashboard one-for-one in a new tool. Don’t do that. Start with the metric definitions behind the dashboard, not the visual layout.
Take a revenue KPI dashboard. Move reusable metric logic out of published data sources and into dbt plus the governed semantic layer. That gives each metric one version-controlled definition that any dashboard, notebook, or chat query can use. The live dashboard then queries Snowflake or BigQuery directly through the semantic layer.
Run the new dashboard in parallel with the Tableau original before cutover. Compare the outputs closely. When numbers don’t match, the problem is often filter logic or a calculated field that was doing two jobs at once. It’s much better to catch that during the parallel run than after the workbook is retired.
Turn Ad Hoc Drill-Downs into Chat and Notebook Analysis
Once the metric layer is set, analysts can reuse it in chat and notebooks. In Tableau, filters and parameters give analysts a structured way to slice data. In an AI-native setup, that same workflow starts with a plain-English question in Slack, Microsoft Teams, or Querio.
The agent uses approved metric definitions and joins from the context layer, returns inspectable SQL, and lets analysts continue in a notebook. The SQL stays visible and editable. That part matters. Analysts can open the notebook, refine the query, and update the charts without starting from scratch.
Keep a small set of standing dashboards for executive and recurring operational reviews, and send the long tail of one-off analysis to chat [1].
Tableau Workflows vs. AI-Native Workflows: Side-by-Side Comparison
| Workflow | Tableau Approach | AI-Native Replacement | Governance Controls Preserved | Validation Before Cutover |
|---|---|---|---|---|
| KPI dashboard | Calculated fields in published data source, extract refresh | dbt metrics + semantic layer, live warehouse dashboard | Metric definitions, row-level security, access groups | Parallel run until outputs match |
| Ad hoc drill-down | Filters, parameters, drag-and-drop exploration | Chat query → inspectable SQL/Python in notebook | Approved context layer, permissions | Spot-check common queries against Tableau outputs |
| Scheduled business review | Subscription or dashboard export | Scheduled notebook or agent-run report delivered to stakeholders | Recipient authorization, sensitive-data controls | Verify metric alignment and narrative consistency before first live delivery |
Every answer stays auditable because it’s backed by SQL. After each workflow matches Tableau outputs, move on to permission checks and wave-by-wave cutover.
Validate, Roll Out, and Retire Tableau in Waves
Once the rebuilt workflows are running in parallel, validate metric totals, permissions, and query output before cutover. This is where small issues can slip through and cause quiet mistakes later. Pay close attention to metric logic, filter behavior, row-level security, and the shape of the SQL.
| Validation Aspect | What to Check | Risk Level |
|---|---|---|
| Metric totals | Compare daily, weekly, and monthly aggregates | High |
| Filter and drill-down behavior | Match Tableau filter outputs against chat/notebook results | High |
| Row-level security | Confirm warehouse-native RBAC/RLS surfaces only authorized data | High |
| Inspectable SQL | Only approved tables and definitions appear | Moderate |
| Data freshness | Confirm live warehouse connections reflect current data, not stale extracts | Moderate |
Document every discrepancy. If Tableau calculated fields don’t match a dbt metric definition, that often points to a deeper issue: the original logic may not have been consistent in the first place. Fix the definition in dbt, log the change, and keep going.
When the highest-risk checks are clear, move the first low-risk subject area into production.
Roll Out by Subject Area and Team Readiness
Use the validation results to decide the rollout sequence by subject area. Based on the dependency register, start with the lowest-risk, highest-value areas first. That gives the team a cleaner path and builds confidence early.
Then move into revenue and finance reporting. These areas tend to involve precise, repeated questions, so they benefit a lot from a governed semantic layer and consistent metric definitions. Leave board decks and compliance-heavy reporting for the final wave, where there’s less room for surprises.
After each wave settles down, retire the old workbook only for that subject area.
Retire Tableau Deliberately and Keep an Audit Trail
Retire a workbook only after the replacement is live, scheduled reports have been rebuilt, and the business owner has signed off. Treat semantic models and permissions as the highest-risk assets. Dashboards and historical exports are usually simpler to retire in waves. If compliance or audit rules require historical exports, keep them.
After those conditions are met, disable the Tableau extract refresh jobs and archive the workbook. Don’t delete it until retention requirements are cleared. Store versioned dbt YAML and semantic-layer configs with the matching semantic-layer config and dbt model so the audit trail links straight back to the new metric layer.
Conclusion: The Fastest Path to a Working Replacement
The fastest path to replacing Tableau isn't a full cutover. In most successful migrations, teams keep a small set of executive dashboards in Tableau while moving repeated ad hoc questions to the AI-native layer [1].
After that first wave is proven out, the path is pretty direct: inventory the estate, define governed metrics in dbt and a semantic layer, connect live to Snowflake, BigQuery, or Redshift, rebuild the highest-value workflows, validate parity and permissions, and retire Tableau in waves.
Tableau still has a place. It continues to work well for stable dashboards. The AI-native stack starts to pull ahead on repeated ad hoc questions, analyst-led drill-downs, and metrics that drift across workbooks.
A useful benchmark is when about 70% of ad hoc questions are answered by the AI layer instead of being escalated to the data team [1]. That level of adoption is realistic when semantic context is governed, the SQL and Python are inspectable, and the warehouse connection is live instead of backed by stale extracts.
Keep Tableau where it still does the job, and move the rest to a governed, warehouse-native layer.
FAQs
::: faq
How long does a Tableau migration usually take?
A realistic Tableau-to-AI-native migration usually takes 30 days to reach a defensible decision and kick off a parallel pilot. Full decommissioning usually takes one quarter.
The first setup phase often takes 1–3 weeks. But if your semantic layer or core modeling is weak - or missing altogether - the timeline can stretch to 4–9 weeks or longer. :::
::: faq
What should stay in Tableau during the transition?
Keep a small, curated set of high-value dashboards in Tableau for executive reporting, especially if your team relies on dashboard-first workflows, proactive metric digests, or anomaly alerts.
During the transition, stay selective. Audit your reports and move only the dashboards people actively use. For executive reporting, keep the most critical Tableau dashboards in place until the numbers have been checked through a full reporting cycle.
It also helps to run both systems in parallel for a while. Compare the numbers side by side before retiring any Tableau assets. That extra step can save you from awkward surprises in leadership meetings. :::
::: faq
How do we validate metric parity before cutover?
Run the new platform and the legacy tool side by side for one full reporting cycle. Compare recurring metrics every week, log each mismatch, and put dashboard logic into one governed semantic layer so both systems calculate the same values the same way.
Use 30 real questions from the previous month, including two that the data can't answer. Review results line by line, inspect SQL for critical metrics, and reconcile top-line numbers like revenue and active users down to the penny before retiring legacy reports. :::