Business Intelligence
The End of the Monthly Reporting Deck (And What Replaces It)
Replace monthly decks with governed live metrics, AI-assisted investigations, and one-page decision briefs with named owners.

I’d replace routine monthly decks with current metrics, checked AI-assisted analysis, and short decision briefs - not cancel the reviews where decisions get made. Start with one shared metric, assign owners, and test the replacement alongside your old report for 30 days before retiring slides.
Here’s what I’d keep in the workflow:
- Numbers you can check: Shared definitions, data-load timestamps, and quality checks.
- Analysis you can inspect: Reusable investigations with analyst review. An AI explanation is not proof of cause.
- Actions you can track: A brief that links the findings to a named owner, deadline, and decision record.
- Records you can recover: Dated snapshots for board reporting, financial close, budgets, and forecasts.
In the article’s invented example, $430,000 in new ARR bookings versus a $500,000 baseline means a 14% shortfall. That starts an investigation - not an automatic conclusion about recognized revenue.
My rule: retire the slide only when its replacement preserves the context, lets another analyst reproduce the number, and shows who owns the next step. Querio supports warehouse access and inspectable analysis; your team still owns data checks, access controls, costs, and follow-through.
AI Analysts vs Dashboards: What Role Does Each Play?
::: @iframe https://www.youtube.com/embed/mVEdzqFP0yk :::
1. Monthly Deck-Based Reporting
| Dimension | Monthly decks | Continuous reporting |
|---|---|---|
| Metric freshness | Month-end snapshot | Current metric with timestamp |
| Metric definitions | May vary by team | Shared, governed definitions |
| Analyst workload | Manual retrieval and slide assembly | Reusable investigations |
| Ownership | Often implicit | Named metric and action owners |
| Decision record | Slides plus scattered approvals | Linked analysis and decision log |
Metric Timeliness and Consistency
Monthly reporting starts with a frozen deck. Continuous reporting starts with the metric itself. Deck snapshots become stale when the month changes, so the metric’s definition and timestamp matter more than the slide.
A shared snapshot is not the same as a shared definition. Record each KPI’s definition and timestamp so readers can tell whether the number is current.
Investigations and Analyst Workload
Analysts spend time pulling numbers, reconciling definitions, and rebuilding slides. Investigating revenue takes more than ARR or MRR. Coverage gaps and win-rate drag help narrow the search, while average contract value helps isolate the driver.
Make those calculations reusable so a revenue-decline alert kicks off a live investigation - not another round of month-end slide assembly.
Leadership Visibility and Action Ownership
A red KPI doesn’t tell anyone who needs to respond. Name both the metric owner and the action owner, and spell out the decision the slide should drive. The handoff is metric owner → action owner → decision record. If the decision is unclear, remove the slide.
After assigning ownership, record the decision - not just the slide.
Decision Records and Audit Trails
An archived deck shows what leadership saw, but not necessarily what it approved. When approvals, due dates, and follow-up outcomes sit in Slack or email, the record gets scattered.
Link the archived deck to a decision log that includes the analysis, approved action, owner, due date, and follow-up outcome.
2. Continuous Metrics, AI Investigations, and Decision Briefs
A revenue decline alert starts a clear workflow: alert → investigation → one-page brief → assigned action. The workflow needs to run continuously, not just when the monthly reporting deck is due.
Metric Timeliness and Consistency
Live does not mean real-time. Warehouse-connected reporting pulls current data from Snowflake or BigQuery, but that data is only as current as the latest warehouse load. Use one governed definition of revenue, and display the last successful load and any failed checks beside the metric. Hold back decision-ready answers until freshness and completeness checks pass. [5][1][7]
Once those checks pass, the workflow can help explain why revenue moved.
Investigations and Analyst Workload
A revenue decline alert should trigger an AI-assisted first-pass investigation, not a final explanation. In Querio, analysts can inspect and edit SQL/Python, check warehouse health signals, and review the evidence. That review helps separate a true driver from a plausible hypothesis - and shifts the team's work from producing slides to investigating and reviewing findings. [6][1][7]
The findings then become a brief leaders can act on.
Leadership Visibility and Action Ownership
For the revenue decline alert, replace the slide narrative with a one-page decision brief covering what changed, why it matters, and who owns the next step. Link the underlying numbers so leaders can check the findings. Assign one owner and one next action to move the brief into execution. [9][2][8]
Decision Records and Audit Trails
After approval, save the decision separately from the live metric. Link the reviewed evidence to the action and record its owner. Live analysis keeps teams informed as metrics change; a lasting decision record keeps accountability intact. Together, live metrics, a verified investigation, and an action-focused brief replace the monthly reporting deck. [8][2]
From a Revenue Alert to an Assigned Action
::: @figure 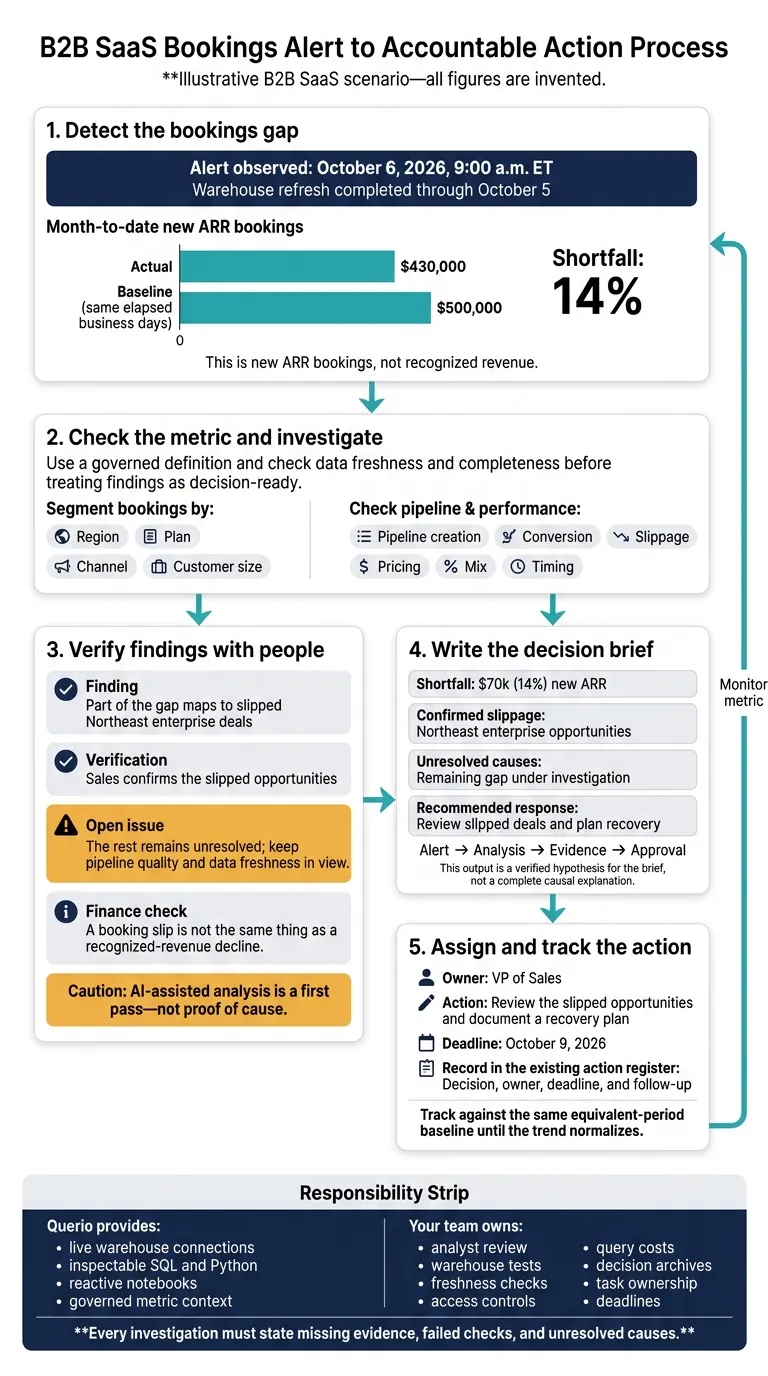 {From Revenue Alert to Accountable Action}
:::
{From Revenue Alert to Accountable Action}
:::
Here’s how the workflow moves from an alert to a task with an owner.
Illustrative B2B SaaS scenario - all figures are invented. On October 6, 2026, at 9:00 a.m. ET, month-to-date new ARR bookings total $430,000, below the $500,000 baseline for the same elapsed business days, after the warehouse refresh through October 5 finishes. The governed definition keeps new ARR bookings separate from recognized revenue, so Finance and Sales are looking at the same metric instead of debating labels. [1][6]
Investigate the Gap and Check the Findings
The analyst segments bookings by region, plan, channel, and customer size, then checks pipeline creation, conversion, slippage, pricing, mix, and timing. In this example, part of the gap maps to slipped Northeast enterprise deals; Sales confirms the slipped opportunities before the team accepts the finding. The rest remains unresolved and keeps pipeline quality and data freshness in frame. Using the equivalent-period baseline keeps the comparison period consistent and makes the drop easier to isolate. Finance confirms that a booking slip is not the same thing as a recognized-revenue decline. The output is not a final answer yet; it is a verified hypothesis for the brief.
Write the Brief and Assign an Owner
The decision brief records the shortfall, confirmed slippage, unresolved causes, and the recommended response. The VP of Sales owns reviewing the slipped opportunities and documenting a recovery plan by October 9, 2026. The brief links the alert, analysis, evidence, and approval. Track the issue against the same equivalent-period baseline until the trend normalizes. In the organization’s action register, record the decision, owner, deadline, and follow-up.
The example separates what the platform provides from what the team must manage.
What Querio Provides - and What Your Team Must Manage
This workflow depends on live warehouse access, editable analysis, and governed metric context. Querio gives analysts live warehouse connections, inspectable SQL and Python, reactive notebooks, and governed metric context. Analyst review still decides whether a finding is ready for action. [1]
Your team still owns warehouse tests, freshness checks, access controls, query costs, and decision archives. Require every investigation to state missing evidence, failed checks, and unresolved causes. Keep task ownership and deadlines in your existing action register. Use analytics to support decisions, not to replace task ownership.
Which Slides to Retire and Which Reviews to Keep
Once the action has an owner, check which recurring slides still earn their place.
Retire the Slides, Preserve Their Purpose
Check each recurring slide: does it support a decision, have a named owner, or repeat another report? Stop assembling it manually only when its replacement keeps the context people need. Store metric definitions in governed models, such as dbt, rather than slide footnotes.
| Recurring slide | Replacement | What must survive |
|---|---|---|
| KPI overview | High-signal dashboard or metric view | Stable definition, named owner, last-updated timestamp |
| Trends | Live dashboard or time-series view | Comparable periods, date logic, historical snapshots |
| Change commentary | AI investigations / decision briefs | Verified drivers, business context, links to analysis people can inspect |
| Regional appendices | Filtered owner views | Consistent regional definitions, row-level security, detail people can inspect |
| Functional updates / action trackers | Action register + Slack alert | Relevant metrics, named owner, deadline, status, audit trail |
| Data appendices | Notebooks people can inspect + live warehouse access | SQL, lineage, versioned models, quality checks |
| Forecasts | Live forecasts with dated snapshots | Assumptions, transaction-date logic, version used for approval |
Understand the Trade-Offs
Live reporting helps teams intervene. Frozen reporting proves what was known when a decision was made.
| Need | Deck-based reporting: benefit / limitation | Continuous reporting: benefit / limitation |
|---|---|---|
| Leadership visibility | Curated narrative / can lag between meetings | Current signals / depends on up-to-date data and clear priorities |
| Analyst workload | Predictable delivery cycle / repeated assembly | Less routine assembly / requires model upkeep and quality checks |
| Accountability | Visible at review time / follow-up can drift | Persistent owner views / requires explicit ownership |
| Decision record | Fixed reference / evidence can become detached | Linked evidence / needs dated snapshots and reviewed briefs |
Keep the Decision Forums
Some decisions still need a live review. Keep the forums where people make those decisions - not the ones that simply repeat status.
Retain board and investor communication and financial close reviews, using approved snapshots and reviewed explanations. Keep forecast, budget, quarterly strategy, and resource allocation reviews focused on assumptions, spending, and trade-offs. A live forecast should not overwrite the snapshot used to authorize a budget.
Keep risk and audit, cross-functional commitment, and metric-governance reviews focused on evidence, dependencies, definitions, ownership, and proposed changes. Review the meeting catalog quarterly and retire forums that only repeat status.
Conclusion: Replace the Reporting Cycle, Keep the Discipline
The workflow replaces the monthly deck only when teams can repeat it, follow governance rules, and assign a named owner. Keep formal reviews and dated decision records for budget, pricing, and forecast decisions.[1][9]
For the revenue-decline workflow, pilot one governed revenue metric in the semantic layer. Set a single alert threshold, route anomalies through one reusable investigation, and attach each result to a brief with a named owner.[7][3][2][5][8]
Map each recurring slide to its replacement, then run a 30-day shadow period. Retire the old slide only after the new certified model matches the governed metric and analysts stop using the legacy report.[5][10]
Keep the old report until a leader can see what changed, why it matters, and who owns the next action - and a second analyst can reproduce the metric from the warehouse. If the leader cannot trust the metric, trace the analysis, and recover the decision, keep the old report.[9]
FAQs
::: faq
How do we set alerts without creating noise?
Build alerts around decisions, not just thresholds. Retire any alert that doesn’t have a clear response and a named owner. Use a governed semantic layer to keep alerts tied to consistent, trusted definitions - not inferred logic.
Save urgent notifications for critical issues that need immediate action. Send lower-severity changes, such as pipeline movement or data quality checks, in a weekly digest. :::
::: faq
How do we measure success during the 30-day pilot?
Track fewer ad hoc data requests and analyst hours saved. Successful teams often reclaim an average of 10 hours per week [1]. Also measure how long it takes to move from a revenue decline alert to an action with an assigned owner. Aim to replace three-week reporting cycles with 30-minute workflows [1].
Make sure teams can inspect generated SQL or Python. Use a governed semantic layer to keep metrics consistent across dashboards and notebooks [2][3][4]. :::
::: faq
What if analysts disagree with an AI finding?
Treat disagreement as a cue to check the logic - not as a system failure. Querio provides SQL and Python you can inspect for every AI-generated answer. Analysts can check for missing joins, incorrect filters, or logic that conflicts with the governed semantic layer.
If the code checks out but the result is unexpected, confirm that the semantic layer’s metric definitions and table relationships match the company’s source of truth. :::