Business Intelligence
AI in Customer Analytics: Real-Time Anomaly Detection Explained
AI-driven real-time anomaly detection turns streaming customer data into instant, actionable alerts that prevent fraud, fix issues, and reduce alert fatigue.

Real-time anomaly detection is transforming customer analytics by identifying unusual patterns or behaviors in data as they happen. This AI-driven approach is faster and more precise than older methods, enabling immediate responses to issues like fraud, sudden demand spikes, or technical glitches. Here's what you need to know:
- How it works: AI models analyze streaming data against historical baselines, flagging deviations with high confidence levels (e.g., 95% or 99% thresholds).
- Key benefits: Faster issue resolution, improved fraud prevention, and reduced manual monitoring save time and costs. For example, Shopify Protect cut chargebacks by 75%, saving $350 million annually.
- Applications: Detecting fraud, monitoring customer behavior, improving checkout processes, and managing inventory in real-time.
- Tools and setup: Systems like Querio connect directly to live data platforms (e.g., Snowflake) for instant insights. Configuring detection thresholds and integrating alerts into tools like Slack or Jira ensures smooth workflows.
This approach helps businesses shift from reacting to problems to preventing them, ensuring smoother operations and better customer experiences.
When Seconds Cost Millions: Streaming Data for Instant Anomaly Detection
::: @iframe https://www.youtube.com/embed/01UaIdibrkw :::
This real-time approach complements how AI powers anomaly detection in BI dashboards to provide a comprehensive view of data health.
How AI-Powered Anomaly Detection Works
::: @figure 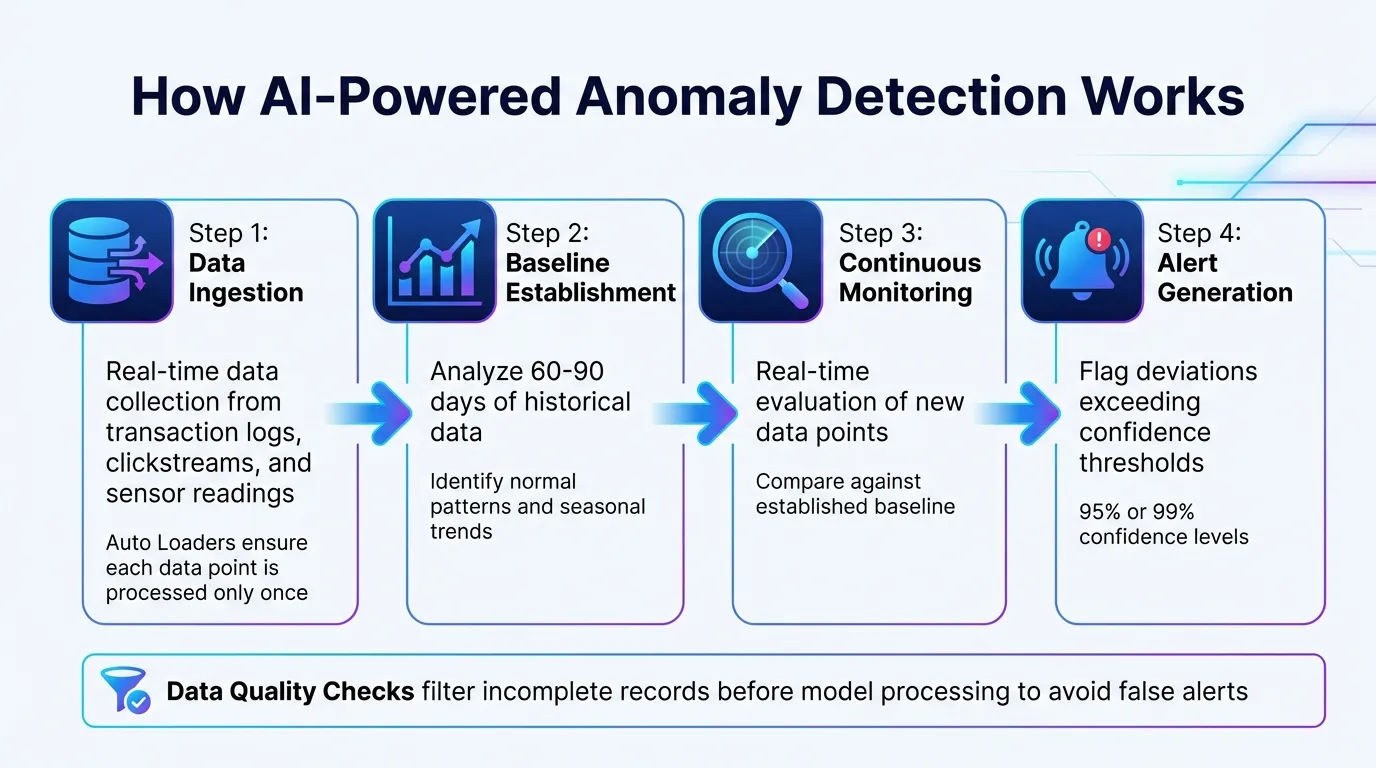 {How AI-Powered Real-Time Anomaly Detection Works: 4-Step Process}
:::
{How AI-Powered Real-Time Anomaly Detection Works: 4-Step Process}
:::
Core Mechanisms of AI Anomaly Detection
AI-powered anomaly detection follows a four-step process that converts raw data into meaningful alerts. Here's how it works:
- Data ingestion: Information from sources like transaction logs, clickstreams, and sensor readings is collected in real-time. Tools such as Auto Loaders ensure each data point is processed only once [2].
- Baseline establishment: Historical data, typically spanning 60–90 days, is analyzed to identify normal patterns and seasonal trends.
- Continuous monitoring: Each new data point is evaluated against the established baseline in real-time.
- Alert generation: Deviations from the norm that exceed confidence thresholds - commonly 95% or 99% - are flagged [4].
Modern systems also include data quality checks to filter out incomplete records to improve data quality before they reach the model, avoiding unnecessary alerts [2]. This streamlined approach enables dynamic learning, allowing models to adjust as customer behavior changes.
Dynamic Learning and Adaptation
One of AI's standout capabilities is its ability to adapt to shifting customer behaviors. By continuously retraining on new data, the models stay relevant and address concept drift, which occurs when patterns evolve over time [5].
Large language models (LLMs) add another layer of intelligence by enabling contextual reasoning. For example, they can differentiate between anomalies caused by data errors and those triggered by events like holidays or viral campaigns [6]. Incorporating a human-in-the-loop process - where experts review flagged anomalies - further minimizes false positives and enhances accuracy [5]. This collaboration ensures the system generates alerts that align with real-world business priorities.
Real-Time vs. Batch Detection: Key Differences
Deciding between real-time and batch detection depends on your operational needs. Real-time systems process data as it comes in, allowing for immediate action [7]. In contrast, batch detection processes data at scheduled intervals, such as every 10 minutes, hourly, or daily, focusing on historical trends [2].
| Feature | Real-Time Anomaly Detection | Batch Anomaly Detection |
|---|---|---|
| Data Handling | Continuous streaming data | Historical data blocks/collections |
| Primary Goal | Immediate response and prevention | Trend analysis and long-term insights |
| Latency | Near-zero | Scheduled intervals |
Real-time detection demands robust infrastructure capable of millisecond-level response times. Streaming frameworks like Delta Live Tables in Continuous Mode support this need [2] [7]. This is especially critical for industries like fintech, where detecting fraudulent transactions instantly is non-negotiable, or e-commerce, where checkout issues must be resolved before they escalate.
"The core value of real-time anomaly detection is its ability to catch unusual patterns instantly. This lets you fix issues like equipment malfunctions or supply chain hiccups before they turn into expensive failures" [7].
Batch detection, on the other hand, is ideal for less time-sensitive tasks like monitoring inventory or analyzing long-term trends, where a slight delay is acceptable.
Key Benefits of Real-Time Anomaly Detection for Businesses
Faster Problem Resolution
Real-time anomaly detection allows businesses to move from reactive to proactive monitoring and reporting. Instead of waiting on delayed reports or relying on manual oversight, AI systems flag irregularities the moment they happen [1][9]. For instance, a sudden drop in payment gateway approval rates triggers immediate alerts, giving teams the chance to address issues before they snowball into major revenue losses. These systems can also differentiate between various types of anomalies, ensuring responses are precise and targeted [9].
Better Fraud Detection and Prevention
Traditional fraud detection systems often depend on rigid "if-then" rules that can be easily bypassed. AI-powered solutions, however, continuously learn from evolving data patterns, offering better protection against new threats [10]. By incorporating context engineering - which combines short-term session data with long-term user behavior - these systems can tell the difference between legitimate actions (like a customer making purchases abroad) and fraudulent activities [10].
Take Shopify Protect as an example. It analyzed over 10 billion transactions to maintain a 99.7% approval rate, cut fraud chargebacks by 75%, and saved $350 million annually. On top of that, it reduced manual fraud reviews by 60% [8]. Users have praised the system for clearly explaining the risk factors behind its decisions [8].
In North America, the cost of fraud is staggering - every dollar lost costs financial firms an estimated $4.41 in fees, fines, and operational expenses. Meanwhile, lender exposure to synthetic identity fraud in the U.S. hit $3.2 billion in the first half of 2024. Real-time detection systems can deliver risk scores in under 50 milliseconds, fast enough to block fraudulent transactions without disrupting customer experiences [10].
"The ability to act in real-time is what separates prevention from simply recording a loss." - Redis [10]
Increased Efficiency and Cost Savings
Automating anomaly detection eliminates the need for teams to manually monitor vast amounts of data, allowing analysts to focus on strategic work instead of combing through dashboards. By moving away from traditional batch processing and adopting top AI tools for direct-connect analytics, businesses also reduce infrastructure costs, removing the need for pricey data replication pipelines like Kafka or Flink.
Beyond labor savings, real-time detection minimizes revenue leakage by quickly identifying technical failures, such as sudden drops in payment processing rates. Rapid alerts empower teams to act immediately - whether by troubleshooting issues or switching providers - helping to avoid costly transaction failures. This combination of reduced manual effort, lower infrastructure expenses, and swift problem resolution often delivers a measurable return on investment within just a few months. Together, these advantages illustrate how real-time detection enhances business agility while paving the way for broader applications in customer analytics.
Applications of Anomaly Detection in Customer Analytics
Customer Behavior Insights and Segmentation
Anomaly detection in real time takes customer segmentation to the next level. Instead of relying on static data snapshots, it enables dynamic updates. For example, if a high-spending customer suddenly reduces their activity, combining historical RFM (Recency, Frequency, Monetary) data with live behavior signals can trigger immediate alerts. This allows businesses to address potential account issues quickly [11][12].
These systems integrate historical RFM models with live metrics like page views, cart additions, and purchases [12]. This approach helps identify "High Potential" leads in the moment. Imagine a user browsing heavily or adding items to their cart but rarely making purchases - they can instantly receive tailored offers to encourage conversion. Similarly, "Churned" users can be detected and removed from costly retargeting campaigns, saving on ad spend [12].
"In e-commerce, the window of opportunity is measured in seconds." - RisingWave Labs [12]
By enabling this level of proactive engagement, businesses can make their analytics workflows more responsive and customer-focused. Beyond segmentation, this technology also plays a critical role in monitoring technical performance, ensuring smooth customer interactions.
Performance Monitoring for Customer Touchpoints
AI-driven anomaly detection is a game-changer for identifying technical issues before they snowball. Whether it’s a sudden spike in API latency, an increase in error rates, or a drop in session duration, these systems catch problems early [11]. For instance, if app crashes rise by 10% after a deployment, the system can immediately trigger a rollback [11]. Similarly, live monitoring of conversion paths can highlight drops in checkout completions, often signaling payment gateway issues or other glitches [11].
Customer support also benefits from this technology. By tracking spikes in ticket volumes for specific features, teams can prioritize fixes or release self-help resources before complaints pile up. What’s more, these alerts often include detailed explanations of the root causes behind the changes [3]. Companies leveraging AI-driven root-cause analysis report cost savings that are 40 to 50 times higher compared to traditional methods [3].
This level of monitoring not only ensures a seamless customer experience but also sets the stage for smarter inventory and demand management.
Demand Forecasting and Inventory Management
Anomaly detection also excels at spotting sudden spikes in demand for specific products [1]. Acting on these insights helps businesses avoid stock shortages and the expenses tied to overstocking. By identifying unusual purchasing patterns as they happen, companies can leverage Hybrid BI for inventory management, reroute shipments, or investigate pricing issues before they lead to lost revenue or unhappy customers.
Implementing AI Anomaly Detection in Your Workflow
Choosing the Right Tools and Infrastructure
Getting started with anomaly detection means ensuring your system has direct access to live data. This requires connecting to platforms like Snowflake, BigQuery, or Postgres in real time, rather than relying on outdated copies of your data. Tools like Querio (https://querio.ai) are designed for this - they securely connect to your data warehouse using read-only credentials. With Querio, anyone on your team can ask plain-English questions about customer behavior, which the AI then translates into SQL queries. This approach ensures you receive precise answers rooted in your actual data, avoiding the pitfalls of black-box outputs.
Before selecting your tools, it's critical to define your goals and key performance indicators (KPIs). Are you looking to detect fraud, identify revenue drops, or track churn? Once your goals are clear, focus on consolidating your data. Bring together information from ERP, CRM, and log systems into a single, reliable source [14]. For example, Mastercard's Decision Intelligence platform processes an astounding 160 billion transactions annually, delivering fraud detection results in under 50 milliseconds. This system has achieved a 300% improvement in fraud detection and an 85% drop in false positives [14].
After setting up your infrastructure, adjust the system's sensitivity to align with your business needs.
Configuring Detection Sensitivity and Alerts
Fine-tuning your detection thresholds is the next step. This helps reduce unnecessary alerts and avoids overwhelming your team. For instance, setting a higher probability threshold (like 0.95) can significantly cut down on false positives [18]. Striking the right balance is essential, especially since 53% of security professionals report that over half of their alerts are false positives [14]. Too many false alarms can lead to alert fatigue, causing teams to overlook critical issues.
It's also important to factor in seasonality and context. For example, if your system flags Black Friday sales spikes or weekend patterns as anomalies, you'll waste valuable time investigating normal fluctuations [15][16]. Use statistical methods like Z-scores or Interquartile Range (IQR) detection to define what’s typical for your business. As customer behavior changes, retrain your models regularly [7]. Start small by focusing on a single high-risk area or customer segment, then expand to other parts of your organization [17].
Integrating Alerts with Response Systems
Once your alert thresholds are set, make sure they integrate smoothly into your existing workflows. Alerts should connect directly to tools your team already uses, such as Slack, email, Jira, PagerDuty, or Microsoft Teams. This ensures that your team can act quickly when an anomaly is detected [19][20].
Establish clear response timelines based on the priority of the alert. For example, critical alerts should be addressed within one hour, while lower-priority ones can be handled within 72 hours [20]. Prioritize alerts by scoring anomalies based on their severity, confidence level, and potential business impact [20]. Additionally, gather feedback from resolved alerts to improve your system over time. Labeling false positives, for instance, can help refine your detection model [20].
A great example of this in action is Express Fulfillment’s partnership with RTS Labs. By implementing AI-driven predictive analytics and real-time routing, they achieved 25% lower transportation costs and 50% faster order processing [14]. The key to their success was integrating alerts directly into their existing workflows, ensuring that the system worked seamlessly with their operations.
Reducing Alert Fatigue and Prioritizing Actionable Insights
Cutting down on alert fatigue is critical for turning real-time anomaly detection into a practical tool for quick and informed decision-making. By ranking anomalies based on severity and tying them to business context, teams can zero in on what matters most and address pressing issues without delay.
Classifying Anomalies by Severity and Impact
Not all anomalies are created equal, and classifying them by severity helps teams focus on the most pressing ones. Many systems rely on Z-scores to gauge how far a data point deviates from expected behavior. For instance, a Z-score of 4.7 indicates a much more urgent situation compared to a score of 2.1 [7][13].
Take BigQuery ML as an example - it detected significant deviations with high Z-scores that required immediate intervention [13]. The trick is ensuring the model learns regular patterns while leaving true anomalies untouched, avoiding overfitting to historical data.
Adding a human-in-the-loop (HITL) step further sharpens alert accuracy. This process trains the AI to better differentiate between genuine threats and false alarms, improving the system's reliability [5].
Contextual Alerts and Root Cause Analysis
Severity classification is just the start. Adding context to alerts makes them both meaningful and actionable. Alerts become much more useful when tied to real-world events like marketing campaigns, supply chain hiccups, or predictable seasonal trends. For example, if a system flags a traffic surge during a planned product launch, that’s not something worth investigating - it’s expected [13][1].
Root cause analysis (RCA) takes this a step further by pinpointing the source of a problem and its related dependencies [16]. AI-powered RCA can slash problem resolution times by up to 45%, enabling teams to resolve issues faster and prevent them from escalating [14]. Instead of combing through logs and dashboards, teams receive alerts that directly identify the cause - whether it’s a failed API, database lag, or a sudden shift in user behavior.
These systems also account for recurring patterns and seasonal changes, ensuring alerts focus on true anomalies rather than predictable fluctuations like weekend traffic dips or holiday shopping spikes [21][16]. This approach lays the groundwork for moving from reactive troubleshooting to proactive monitoring.
From Reactive to Predictive Monitoring
The ultimate strength of AI-driven anomaly detection is its ability to shift teams from reacting to issues to anticipating and preventing them. Traditional dashboards show what’s already happened, but AI-powered systems predict future issues and alert teams before they disrupt customers [1][14].
Predictive monitoring identifies potential problems in service dependencies before they snowball into major disruptions [16]. For example, if a payment gateway starts showing unusual latency, the system can flag it before checkout errors increase. This kind of foresight helps prevent revenue losses and keeps the customer experience intact.
"AI is the most important technology of our time, and the companies that harness it will define the future." [14]
Wrapping It Up
This guide has explored how real-time AI anomaly detection is changing the game for customer analytics. By moving from manual dashboard monitoring to instant alerts with detailed explanations, businesses can now pinpoint why metrics deviate - be it a coding error, fraud activity, or unexpected customer behavior.
Highlights of AI-Powered Anomaly Detection
The benefits of AI-driven anomaly detection are hard to ignore. Automated root-cause analysis simplifies complex data patterns into easy-to-understand insights, saving analysts from tedious manual work [3]. Companies adopting these tools report cost reductions of 40 to 50 times compared to older methods [3]. Beyond cost savings, this approach enhances fraud detection, speeds up issue resolution, and uncovers subtle problems that static thresholds would completely miss [22].
This shift to predictive monitoring empowers teams to fix problems before customers even notice. Mona Rakibe, CEO of Telmai, sums it up perfectly:
"The unknown unknowns will always be unpredictable. We need to accept that data will be unpredictable. And when it's unpredictable, can we get enough insights to make sure we find the root cause quickly and react before there's an impact?" [22]
Steps to Get Started
To begin, identify key challenges like slow response times, customer churn, or revenue dips. Start with high-priority datasets to quickly showcase value. Ensure your setup includes secure, read-only connections to live data platforms like Snowflake, BigQuery, or Postgres.
For teams wanting to integrate natural-language queries with real-time anomaly detection, tools like Querio (https://querio.ai) provide an intuitive workspace. With features like automated SQL generation, built-in governance, and instant visualizations, Querio makes it easier for anyone to ask questions about live data and understand its business impact - no technical expertise required.
FAQs
::: faq
How do I choose the right anomaly thresholds?
To set the right anomaly thresholds, you'll need to decide between static and dynamic thresholds, depending on how your data behaves.
- Static thresholds rely on fixed values, like the 99th percentile, and work well for stable data. However, they can fall short when your data fluctuates or changes over time.
- Dynamic thresholds, on the other hand, adjust to trends and seasonal patterns, making them more effective for handling evolving data. They can help improve detection accuracy and cut down on false alarms.
The key is finding the right balance between false positives and false negatives. Adjust your thresholds to match the specific needs of your application, whether it's fraud detection, system monitoring, or another use case. :::
::: faq
How can I cut false positives and alert fatigue?
To cut down on false positives and reduce alert fatigue in AI-driven real-time anomaly detection, consider using dynamic thresholds. These thresholds adjust automatically based on data variability, helping fine-tune the system's sensitivity to anomalies. Striking the right balance between detection speed and false alarm rates ensures that alerts remain useful and actionable.
By applying these strategies - particularly with tools like Querio - you can keep alerts relevant, reduce unnecessary noise, and boost efficiency in customer analytics workflows. This approach supports better decision-making and ensures your team focuses on what truly matters. :::
::: faq
What data do I need before going real-time?
To make real-time AI-powered anomaly detection work effectively, start with clean and well-prepared data. This means tackling issues like missing values, duplicates, and outliers. You'll also need to label your data for training purposes, which is a key step in building accurate models.
Next, pick the algorithm that fits your specific needs. For example, time series data and high-dimensional data often require different approaches. Once you've chosen an algorithm, validate your models using methods like cross-validation to ensure they're reliable.
By focusing on solid preparation and validation, you'll set the stage for dependable real-time anomaly detection. :::