Guide
Data and Intelligence: A Self-Serve Analytics Guide
Explore a practical framework for data and intelligence that makes self-serve analytics accessible and actionable for your organization in 2026.
Most advice about data and intelligence starts in the wrong place. It tells you to buy a better dashboard, add an AI assistant, or migrate to a more modern warehouse. That sequence produces more software, not necessarily better decisions.
The problem I see after moving teams off legacy BI tools is usually organizational. A business user asks a question in Slack, an analyst translates it into SQL, turns the result into a chart, revises the chart after a follow-up, and becomes the company's human API. The warehouse may be reliable. The dashboard may be attractive. The operating model still makes every question depend on a specialist.
The useful question isn't which analytics product has the longest feature list. It's who can ask a trusted question of company data without filing a ticket, and who owns the answer when the definition is disputed? That answer determines whether your data stack creates an advantage or another queue.
Table of Contents
- Why Data and Intelligence Is an Operating Model Choice
- The Four Layers of Data and Intelligence Explained
- Comparing BI, Analytics, Data Intelligence, and AI Insights
- KPIs That Show Data and Intelligence Is Working
- Roles, Stack, and Workflow for Operational Intelligence
- Startup and Mid-Market Use Cases in Practice
- How Querio Fits Against Hex, Looker, and ThoughtSpot
- A 90-Day Plan to Move From Human API to Self-Serve
Why Data and Intelligence Is an Operating Model Choice
A software purchase can't fix unclear decision rights. If product owns activation, marketing owns acquisition, finance owns revenue recognition, and nobody owns the definition of a retained customer, every dashboard becomes a negotiation. The visualization layer only makes the disagreement easier to distribute.
This is why I treat data and intelligence as an operating model choice. Leaders need to decide which questions business users can answer independently, which metrics require certification, which teams own source data, and where analysts should spend their time. A self-serve model doesn't mean everyone gets unrestricted access to every table. It means people can work from trusted entities, definitions, and workflows without waiting for a custom translation each time.
The historical pattern supports this broader view. The term business intelligence was used by Richard Millar Devens in 1865 to describe Henry Furnese's systematic collection and analysis of market information, while John Graunt's recorded statistical analysis of London mortality records dates to 1663. TechTarget's history of big data places these milestones before modern computing, reinforcing the point that intelligence begins with disciplined collection, interpretation, and action, not with a dashboard vendor.
Practical rule: If a recurring business question still requires an analyst to translate it, answer it, format it, and explain it, you haven't built self-serve analytics. You've built a request service.
Design the access model before choosing the interface
Start with a decision inventory. List the questions leadership, sales, product, finance, and customer success ask repeatedly. Separate them into three groups:
- Self-serve questions: Safe to answer from certified metrics and governed models.
- Analyst questions: Require exploration, statistical judgment, or a new model.
- Controlled questions: Affect compliance, financial reporting, pricing, or other decisions that need explicit review.
Then assign ownership. The data team should own the infrastructure, model quality, and metric definitions. Business leaders should own the decisions those metrics support. Analysts should help teams learn the system, not permanently sit between every employee and the warehouse.
A practical guide to enterprise data strategy in the AI era is useful background for making those ownership boundaries explicit. The central recommendation is simple: design the workflow around decisions first, then select tools that make the workflow possible.
The Four Layers of Data and Intelligence Explained
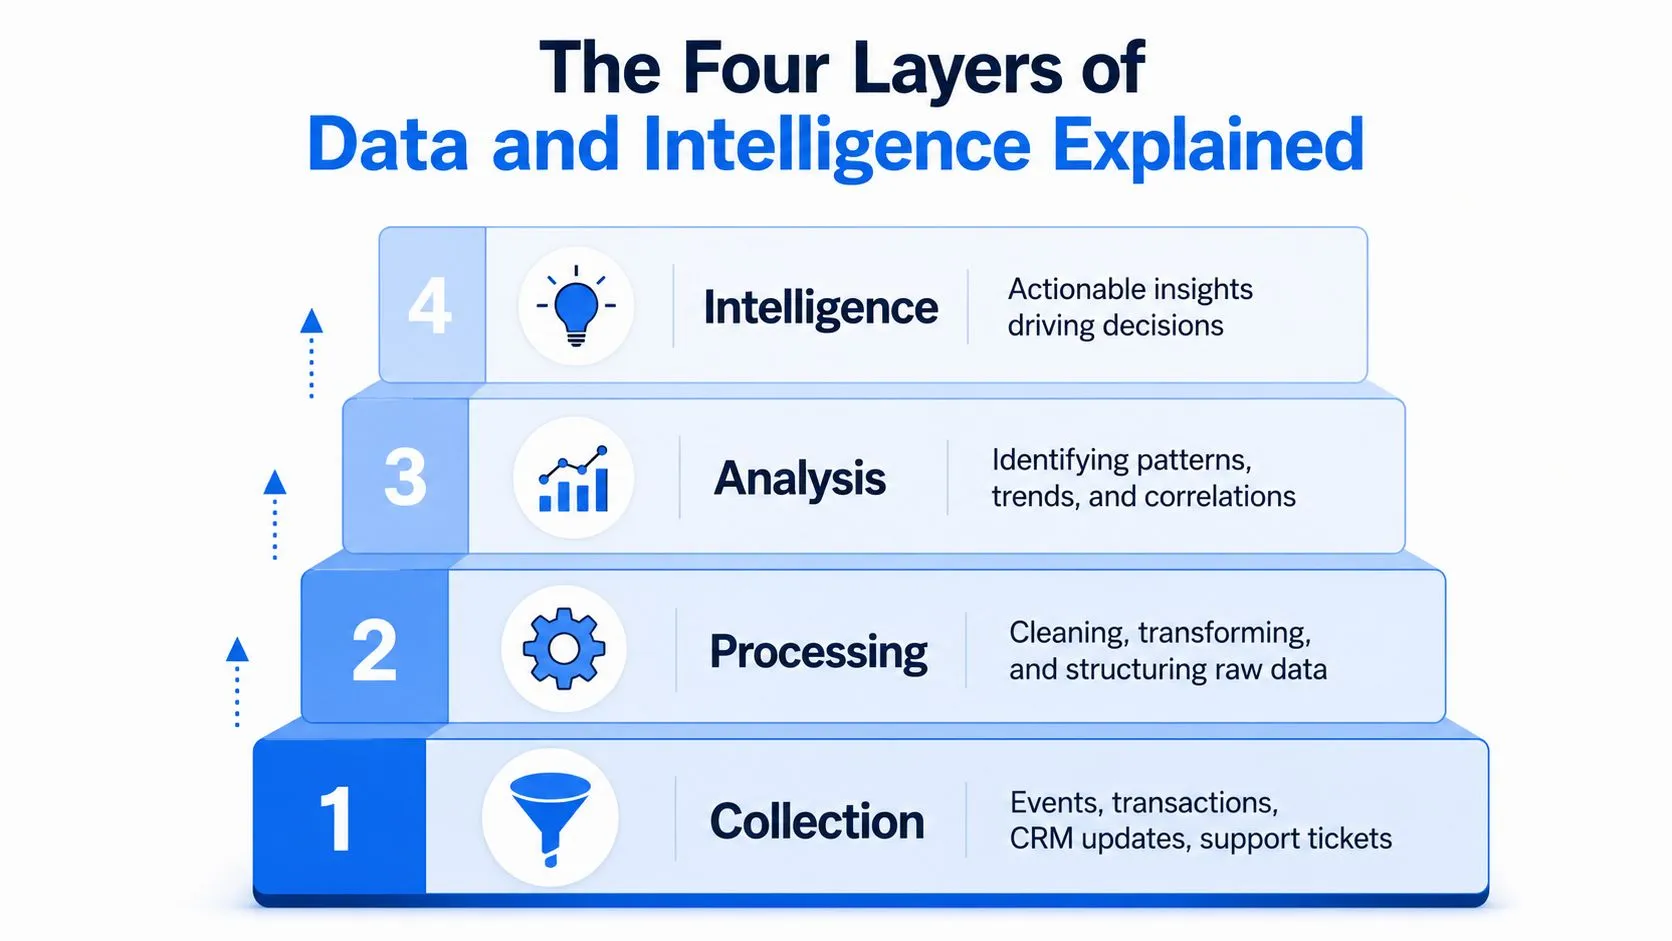
Data and intelligence is a stack, not a single product. Each layer has a different owner, failure mode, and job. When teams collapse the stack into a BI tool, the person who builds the dashboard often becomes the accidental owner of business meaning.
Collection
The base layer captures events, transactions, CRM updates, support tickets, product usage, and third-party records. The important work isn't merely moving rows into Snowflake, BigQuery, or another warehouse. It's assigning ownership, documenting source behavior, and preserving the keys that let teams connect a customer, subscription, opportunity, or incident across systems.
A missing event can distort an activation funnel. A duplicated CRM record can inflate pipeline. Collection is therefore a business control, not just an engineering concern.
Processing
Processing turns raw data into consistent structures. Analytics engineers use SQL transformations, dbt or an equivalent framework, tests, and version control to create reusable entities such as customer, account, subscription, order, and revenue.
This layer should answer, “Can another person reproduce this table and understand where it came from?” If the answer is no, downstream users will compensate with private spreadsheets and copied dashboard logic.
Analysis
Analysis gives the organization a shared language for interpreting processed data. It includes metrics, cohorts, funnels, KPIs, dimensions, and semantic mappings. A metric catalog can record the definition of activation, the source models behind it, the valid filters, and the owner responsible for changes.
The semantic layer matters because two accurate queries can produce different answers when they use different populations or time windows. Semantic layers and their practical benefits offers a useful framework for keeping definitions separate from presentation.
Intelligence
Intelligence turns interpretation into action. It includes dashboards, notebooks, embedded analytics, anomaly alerts, natural-language questions, and AI-generated explanations. The output isn't just a number. It might be a prioritized churn list for customer success, a product funnel diagnosis, or a pricing experiment hypothesis.
The stack works when each layer remains visible. Collection creates evidence, processing creates usable entities, analysis creates shared meaning, and intelligence puts that meaning into a decision workflow.
Comparing BI, Analytics, Data Intelligence, and AI Insights
Vendor language often collapses distinct jobs into one category. That is a procurement mistake. Choose the capability based on the decision workflow, not the demo.
| Capability | Primary User | Primary Output | Latency | Failure Mode |
|---|---|---|---|---|
| BI | Executives and operating teams | Governed dashboards and recurring reports | Scheduled or near-real-time | A trusted-looking view uses stale or disputed definitions |
| Analytics | Analysts, product managers, and operators | Exploratory queries, cohorts, funnels, and investigations | Interactive | A correct analysis remains trapped with its author |
| Data intelligence | Data and platform teams | Quality signals, lineage, freshness alerts, and trust controls | Continuous or event-driven | Broken data reaches downstream consumers before anyone intervenes |
| AI insights | Business users and decision owners | Natural-language answers, anomaly explanations, and recommended next actions | On demand or proactive | The system produces a plausible answer without sufficient context or control |
BI serves leadership's stable operating view. Analytics explains why a metric moved through queries, cohorts, funnels, and investigations. Data intelligence monitors whether the underlying data remains trustworthy. AI insights shorten the path from a question to a next action, but they still depend on governed definitions and relevant context.
That distinction is also an organizational design decision. Traditional BI creates a human API bottleneck: business users wait for analysts to translate questions, joins, and definitions into reports. Notebook platforms in the Querio style reduce that handoff by keeping exploration, context, and reusable analysis closer to the teams making decisions. The trade-off is clear. Teams need governance and shared definitions, not unrestricted self-service.
For a broader explanation of the category, see business intelligence and analytics.
Teams building a stronger exploratory practice should also review data analysis techniques for growth, especially when product, marketing, and revenue teams need to move beyond top-line reporting.
Procurement should test the failure mode, not just the interface. Ask who operates the product, which business definitions it supports, how joins are controlled, and what happens when its answer is wrong. A dashboard may leave data quality unmonitored. A natural-language interface may fail on business-specific joins. A notebook may offer flexibility while requiring stronger analyst enablement.
KPIs That Show Data and Intelligence Is Working
A data program needs an operating dashboard of its own. Don't measure success by the number of dashboards published or the number of queries executed. Measure whether people can trust the data, find answers, and turn those answers into operating changes.
The first group covers the foundation:
- Pipeline freshness: Track how closely source data arrives to its agreed schedule. A missed refresh can invalidate a morning revenue or usage review.
- Schema-break rate: Record changes that interrupt models or alter meaning. A lower rate indicates stronger coordination between source owners and consumers.
- Source coverage: Identify which critical systems have monitored, documented connections. A customer health view built without support data has limited decision value.
The modeling layer needs different measures. Track the number of governed metrics, the reuse of certified models, and the proportion of recurring reports that rely on shared definitions instead of copied logic. A high metric-to-source ratio can signal that teams are repeatedly rebuilding the same concept from different tables. A rising query reuse rate suggests that useful analysis is becoming infrastructure rather than disposable work.
| Layer | Primary KPI | Target Range | Red Flag |
|---|---|---|---|
| Collection | Freshness and monitored source coverage | Set against each source's agreed service expectation | Critical sources regularly arrive late or lack ownership |
| Processing | Tested model reliability and schema-break rate | Stable enough for recurring operational use | Frequent failures force manual extracts |
| Analysis | Governed metric count and query reuse | Shared definitions appear across teams and workflows | Every team maintains its own version of core metrics |
| Intelligence | Median time-to-insight and decision adoption | Questions move from request to action without repeated analyst translation | Backlog grows and analysts spend increasing hours on recurring reports |
At the delivery layer, measure median time-to-insight, active use of certified notebooks or dashboards, and the share of important decisions backed by a documented analysis. Tie those measures to revenue, retention, or operational efficiency. For example, a churn investigation matters when customer success changes outreach, not when someone saves a chart.
AI needs action metrics, not novelty metrics. Track the time between an AI-generated hypothesis and a tested experiment, the number of approved recommendations acted on, and the business outcome attached to each intervention. Use a practical KPI measurement framework to keep definitions and owners visible.
Roles, Stack, and Workflow for Operational Intelligence
Operational intelligence needs named owners. Without them, the data team inherits every request, business users create shadow definitions, and AI gets deployed before anyone decides who can stop it.
Assign ownership by decision stage
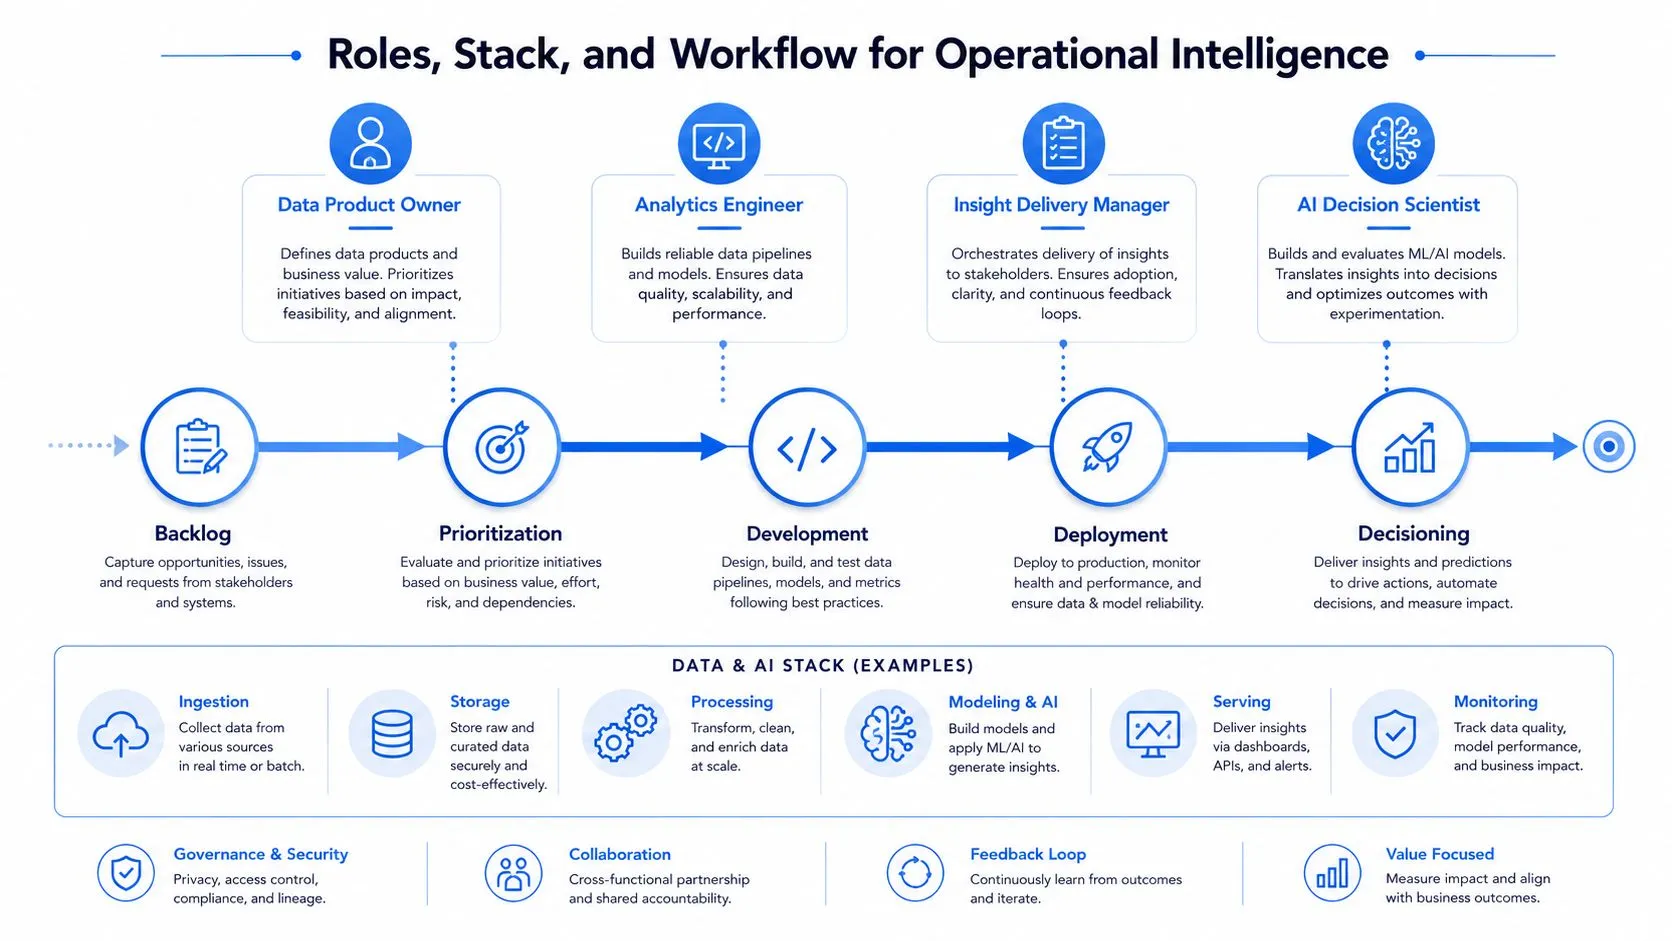
The analytics engineer owns reliable models, tests, lineage, and reusable entities. The data product owner prioritizes demand and decides which recurring questions deserve a maintained product. An insight delivery manager makes answers usable in dashboards, notebooks, CRM workflows, or collaboration tools. An AI decision scientist, where the team has that capability, defines how generated insights are evaluated, approved, monitored, and connected to action.
These roles don't always require four hires. In a startup, one person may hold several responsibilities. The boundaries still need to exist.
The stack should follow the same logic:
- Ingestion brings in operational data from product systems, CRM, billing, support, and external sources.
- Warehouse storage provides a governed place to retain and query data.
- Transformation and semantics create tested entities and shared metric definitions.
- Exploration and delivery let users investigate, publish, and consume answers.
- AI assistance translates questions into queries, analysis, explanations, or workflow actions under defined controls.
Replace the ticket queue with a learning loop
A self-serve workflow starts with a metric catalog and certified notebooks. A user searches for an approved definition, runs an analysis against governed data, and publishes the result with context. Other users can reuse it, challenge the assumptions, or request a model change.
That workflow changes the data team's job. Analysts still handle novel questions and difficult causal work, but recurring questions become reusable assets. Office hours, review rules, and feedback capture prevent self-serve from becoming unmanaged self-service.
A useful maturity ladder looks like this:
- Request-driven: Analysts answer most questions manually.
- Report-driven: Teams consume recurring dashboards but rarely explore independently.
- Model-driven: Certified entities and metrics support consistent analysis.
- Workflow-driven: Insights reach decisions inside operating tools.
- Controlled intelligence: AI assists with analysis and action while owners can inspect, constrain, and audit behavior.
Operational control matters more as systems become autonomous. A 2026 security-focused report found that 63% of organizations cannot enforce purpose limitations on AI agents, 60% cannot terminate a misbehaving agent, and only 43% have a centralized AI data gateway. The report on AI data governance and agent control shows why governance must include runtime controls, not only written policy.
Startup and Mid-Market Use Cases in Practice
A Series A startup and a mid-market company shouldn't build the same data organization. The startup needs a thin foundation that keeps product and revenue questions moving. The mid-market company needs stronger semantic governance because more teams are making decisions from shared metrics.
Consider a product-led startup using BigQuery or Snowflake, dbt, product event instrumentation, Stripe or another billing system, a CRM, and support software. A notebook front end sits above the warehouse. Each week, the growth lead reviews activation, funnel progression, expansion signals, and accounts showing declining usage. The workflow is direct: ingest events and commercial records, transform them into customer and subscription entities, define the core funnel, generate a growth brief, and send a reviewed churn-risk list to customer success.
The startup should track activation progression, conversion through the product funnel, expansion activity, support burden, and time from insight to experiment. It doesn't need a large center of excellence. It needs clear definitions and a repeatable weekly operating rhythm.
A mid-market company might add a governed semantic layer, a metric catalog, CRM synchronization, collaboration alerts, pricing data, and cohort retention models. Its workflow starts with certified revenue and customer entities, monitors anomalies, routes an alert to the accountable team, investigates the cause in a notebook, and records the resulting pricing, product, or retention action. The important output is not another dashboard. It's a traceable chain from metric movement to owner to intervention.
| Dimension | Series A Startup | Mid-Market Company |
|---|---|---|
| Core sources | Product events, billing, CRM, support | Product, billing, CRM, support, finance, pricing, external sources |
| Data model | Small set of reusable customer and revenue entities | Governed semantic layer with documented cross-functional metrics |
| Delivery | Weekly growth briefs, churn reviews, exploratory notebooks | Alerts, cohort analysis, pricing experiments, CRM and collaboration workflows |
| Ownership | One data lead with shared business ownership | Data product owners aligned to major operating domains |
| Main risk | Decisions rely on incomplete instrumentation | Teams use competing definitions across departments |
The shared pattern is more important than the tooling. Both organizations need a thin center of excellence, a broad self-serve front, and intelligence connected to the next action. AIDABench evaluates this end-to-end ambition across more than 600 tasks spanning question answering, visualization, and file generation, illustrating why useful analytics must extend beyond returning text. The AIDABench benchmark provides a practical way to think about complete analytical workflows.
How Querio Fits Against Hex, Looker, and ThoughtSpot
Choose the platform based on team shape and operating ambition, not vendor category. Hex fits analyst-heavy organizations that want collaborative, code-first notebook work. Looker fits enterprises that need a well-governed semantic model and centralized control. ThoughtSpot fits teams that prioritize search-first exploration over governed metrics.
A Querio-style platform sits between those patterns. It combines notebook-oriented analysis, warehouse-connected querying, dashboards, and AI assistance so business users can investigate without routing every question through an analyst. Querio's stated product model uses AI coding agents directly on warehouse data and supports custom Python notebooks, with query logic that users can inspect. That approach is most relevant to mid-market teams that need more flexibility than fixed BI reports but don't want to build a semantic platform from scratch.
| Platform | Best Fit | Self-Serve Depth | Governance Model | Time to First Insight |
|---|---|---|---|---|
| Querio | Mid-market teams combining technical and non-technical users | Natural-language questions, SQL, Python notebooks, dashboards, and AI analysis | Warehouse-connected, inspectable workflows with governed definitions | Fast when core warehouse connections and metrics are ready |
| Hex | Analyst and data science teams | Deep code-first exploration and collaborative notebooks | Strong through authored projects and review practices | Fast for teams with technical users |
| Looker | Large enterprises with strict centralized governance | Broad consumption with governed exploration | Semantic modeling and centralized administration | Dependent on model and governance setup |
| ThoughtSpot | Search-first business users | Natural-language exploration over governed metrics | Governed search and metric definitions | Fast for common questions |
The trade-off is clear. Looker wins when centralized governance is the primary constraint. ThoughtSpot wins when non-technical search is the dominant need. Hex wins when analysts want maximum code flexibility. Querio is a reasonable middle path for teams trying to remove the human API bottleneck while preserving inspectable analysis and notebook depth.
A 90-Day Plan to Move From Human API to Self-Serve
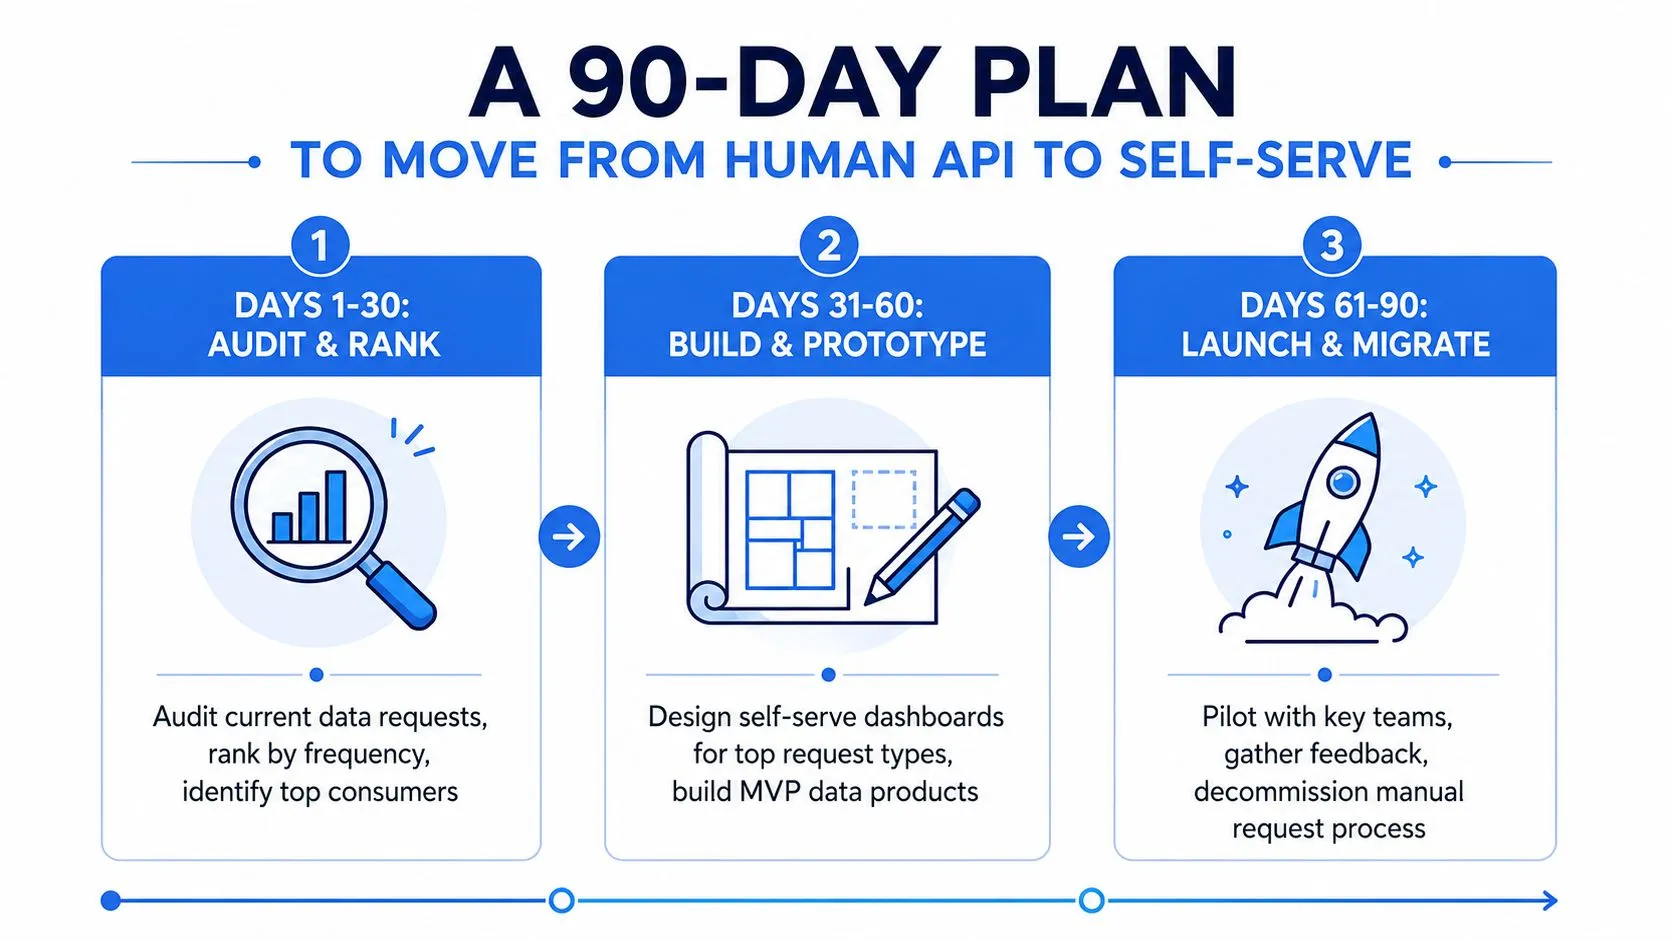
Start Monday by exporting the data request queue. Include Slack messages, tickets, recurring executive reports, spreadsheet refreshes, and analyst calendar time. Rank each request by frequency, business impact, and repeatability. Identify the top five questions consuming analyst time, then record the current definition, source tables, output format, and owner.
Days 1 through 30
Create a baseline for analyst hours per recurring report, request backlog, median response time, and data-quality incidents affecting those answers. Don't optimize the entire stack. Pick the questions that recur often and have clear decision owners.
Document the current metric definitions and mark disputes instead of hiding them. A disputed metric is a prioritization signal.
Days 31 through 60
Build the smallest governed semantic layer that supports the top five questions. Create certified entities, tests, ownership metadata, and reusable notebook or dashboard workflows. Pilot Querio or an equivalent environment with two business users, one from an operating team and one from a function that regularly creates requests.
The pilot should test more than query generation. Ask whether users can find the right metric, inspect the logic, explain the result, and publish a reusable answer.
Days 61 through 90
Measure ticket-queue reduction, recurring-report effort, adoption by the pilot teams, and the quality of answers produced without analyst intervention. Set a 50% reduction in analyst hours per recurring report within 90 days as the expansion target, and expand only if data quality scores remain above 90%, using the team's documented scoring method. These thresholds are operating gates for the program, not externally reported benchmarks.
Hold weekly office hours after launch. The data team should teach users how to choose a metric, inspect a query, and frame a decision. It shouldn't answer the same question on demand every week.
The case for this discipline is stronger as AI adoption expands. Stanford HAI's 2025 AI Index Report reports that 78% of organizations said they were using AI in 2024, compared with 55% the year before, while global private investment in generative AI reached $33.9 billion in 2024, up 18.7% from 2023. The adoption curve is moving faster than most data operating models. A separate 2026 report says nearly half of surveyed organizations still can't fully rely on their data for decisions, and most report that their data isn't ready for AI. The 2026 modern data report captures the execution gap directly.
Querio provides a warehouse-connected workspace where teams can use natural-language questions, inspect generated SQL and Python, and build reusable notebook-based analysis without routing every request through an analyst. If your team is stuck maintaining dashboards instead of enabling decisions, visit Querio and evaluate it against the self-serve workflow described here.