Guide
Self Service Data Analytics Platform Guide for 2026
Discover how a self service data analytics platform helps startups and mid-market teams ship faster. Learn benefits, governance, and how Querio compares
A growth lead asks for a funnel breakdown for the fourth time this week. The answer already exists across three dashboards, but the requested cut needs a new dbt model, a review from analytics engineering, and another ticket in the queue. Two days later, the opportunity has moved on, the lead has copied partial figures into a spreadsheet, and the data team has spent its time translating questions into SQL.
That pattern isn't a dashboard problem. It's an operating-model problem. A self service data analytics platform should move routine question-answering out of a serialized ticket queue and into a governed workflow where domain teams can explore trusted data themselves. The data team still owns the foundation, but it no longer acts as a human API for every follow-up question.
This guide focuses on the parts that determine whether self-service survives contact with production data: semantic definitions, federated governance, warehouse-native exploration, AI reliability, and rollout discipline. It won't pretend that adding a search box to a legacy BI tool solves metric drift. It also won't treat AI-generated SQL as trustworthy just because it runs successfully.
Table of Contents
- The Analyst Bottleneck Self Service Is Built to Solve
- What a Self Service Data Analytics Platform Actually Is
- Why Startups and Mid Market Teams Are Adopting Them
- Governance and Security Without Killing Speed
- A Practical Rollout for Your First Ninety Days
- How Querio Compares to Traditional BI Tools
- Choosing the Right Platform for Your Team
The Analyst Bottleneck Self Service Is Built to Solve
The first symptom is usually Slack. A product manager asks for weekly active users by acquisition channel. Revenue asks for pipeline coverage by segment. Finance wants the same revenue number with a different date boundary. Each request sounds small, yet each one competes with model maintenance, quality checks, executive reporting, and infrastructure work.
Treating analysts as a human API creates a predictable cascade:
- Slower decisions: Business teams wait for an answer instead of testing a decision while the context is still fresh.
- Stale metrics: Analysts prioritize visible executive requests, while operational questions age in the queue.
- Shadow analysis: Users copy dashboard exports into spreadsheets or Notion pages, then add logic nobody else can inspect.
- Lower trust: Leaders see conflicting numbers and start questioning the dashboard layer instead of the underlying business process.
Self-service changes the path. A user asks a question inside the analytics product, selects an approved metric, applies a permitted dimension, inspects the logic, and saves the result for reuse. The analyst builds the model and guardrails once. The business user handles the next question without creating another bespoke request.
Practical rule: If every follow-up question still requires an analyst, you haven't deployed self-service. You've deployed a more attractive request form.
This matters in revenue operations as much as product analytics. Teams building a repeatable approach to sales forecasting for startups still need consistent definitions for pipeline, conversion, and expected revenue. A polished forecast built on privately altered spreadsheet logic only moves the bottleneck somewhere else.
The practical shift is simple: analysts stop measuring their value by the number of ad hoc answers they deliver and start measuring it by the number of reliable questions the organization can answer without them. The case for removing the data team bottleneck is therefore stronger than a productivity argument. It is a capacity and trust argument.
What a Self Service Data Analytics Platform Actually Is
Think of a modern restaurant kitchen. The warehouse is the pantry, holding the raw ingredients. The semantic layer is the standardized recipe, defining what “revenue,” “active customer,” or “retained account” means. The analytics platform is the prep station where users combine approved ingredients. Business users are line cooks. They can assemble useful dishes without recreating the supply chain or rewriting every recipe.
Traditional BI often provides the dining room menu, not the kitchen. A centralized team publishes a fixed collection of dashboards, and every question outside that menu becomes a ticket. Users can filter what exists, but they can't safely extend the model when the business asks a new question.
A genuine platform has four connected layers:
- Governed warehouse or lakehouse: Data stays in the controlled analytical environment, with permissions, quality checks, and freshness monitoring close to the source.
- Reusable semantic model: Metrics, dimensions, joins, time logic, and business rules have named owners and inspectable definitions.
- In-product exploration: Users can filter, pivot, calculate, join approved data, and investigate follow-up questions without leaving the governed workspace.
- Policy controls: Identity-based access, lineage, audit history, and usage monitoring constrain what users can see and publish.
The category is no longer a niche workflow. One industry estimate placed the global self-service analytics market at USD 4.82 billion in 2024 and projected it to reach USD 17.52 billion by 2033, with a projected 15.9% CAGR from 2025 to 2033. The same report estimated that North America represented 37.4% of global revenue in 2024, indicating strong adoption in the largest enterprise data market. See the self-service analytics market analysis for the methodology and assumptions.
The historical sequence explains why the category still feels fragmented. Self-service BI was largely IT-controlled in 1999. Tableau 1.0 appeared in 2004, AWS launched in 2006, Power Pivot entered Excel in 2010, Power BI launched in 2015, and augmented analytics began reshaping BI in 2016. By 2012, tools led by Tableau and Qlik had helped open analytics to non-technical users, shifting the experience from request-based reporting toward user-driven exploration. The timeline of self-service analytics development documents those milestones.
Querio's notebook-on-the-warehouse approach treats these layers as one working surface. Users can ask questions in natural language, review generated notebook cells, and build analysis on connected warehouse data, while the underlying model and access rules remain part of the platform rather than scattered across dashboard copies. The definition of self-service data analytics is useful here because it separates an accessible interface from an actual operating capability.
Why Startups and Mid Market Teams Are Adopting Them
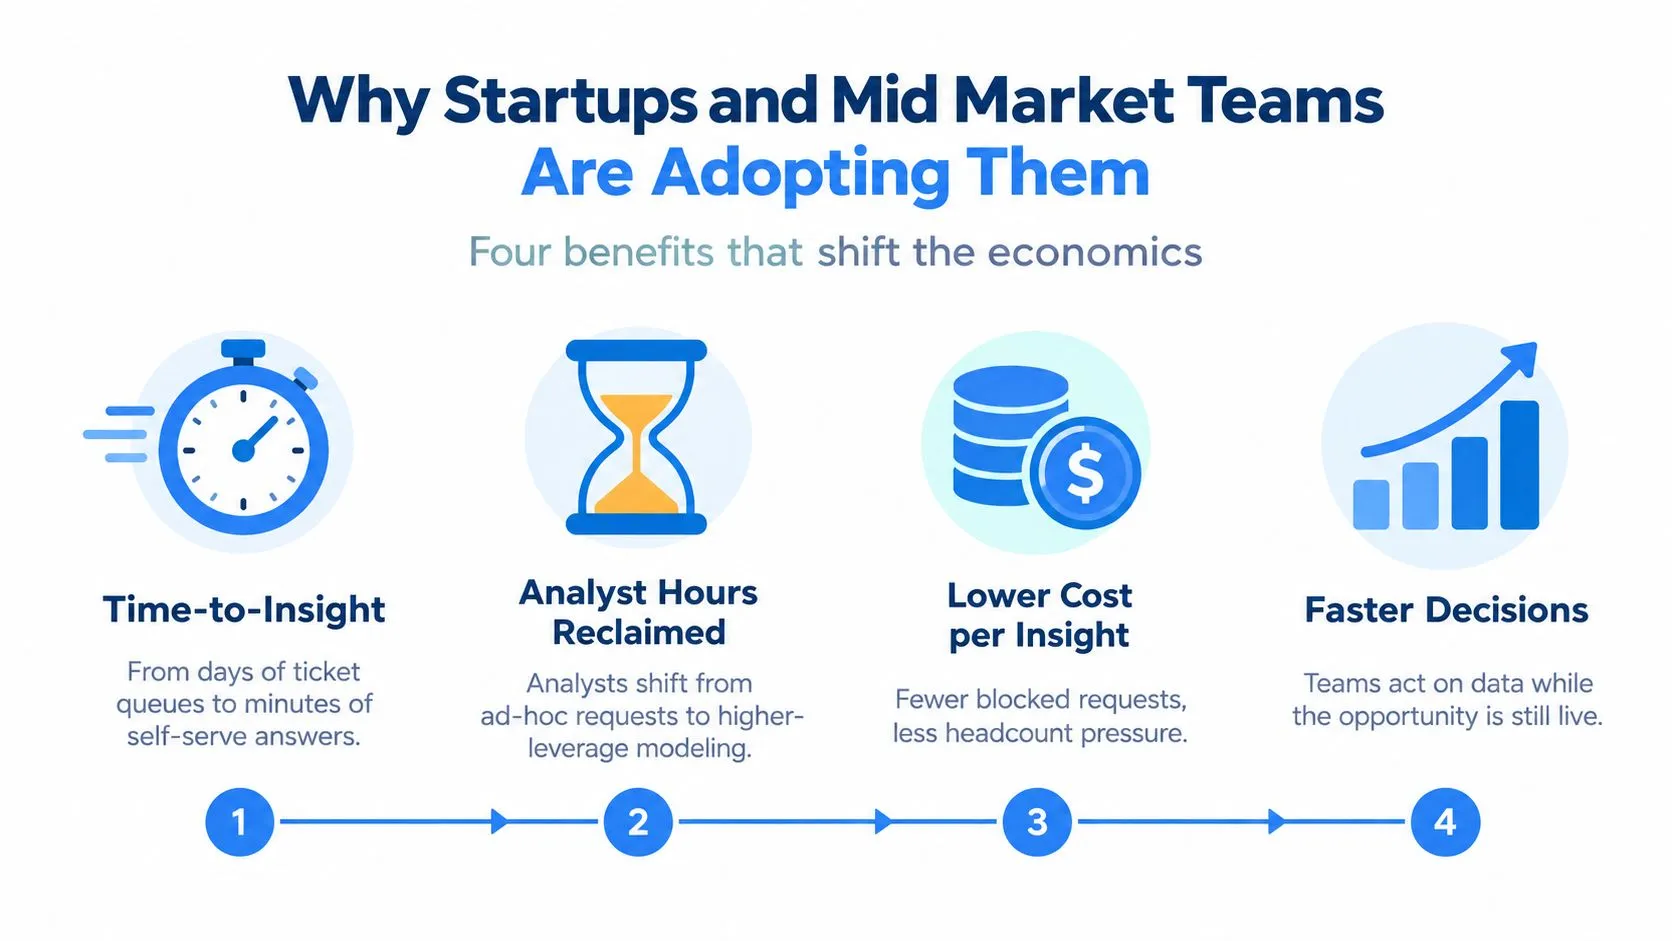
The economic case changes as a company grows. Early teams feel the pain as waiting time. Later teams feel it as inconsistent definitions, duplicated logic, and governance debt. The platform needs to address all four stages, not just help someone make a chart.
Speed arrives first
A small company usually doesn't need another executive dashboard. It needs a product manager to answer a question before the sprint ends, or a founder to compare segments without interrupting the only analyst. Self-service reduces the distance between a question and a governed exploration.
That speed isn't permission to let everyone query everything. It means users get fast access to an approved analytical surface, while the data team decides which models, fields, and policies are safe to expose.
Metric drift follows growth
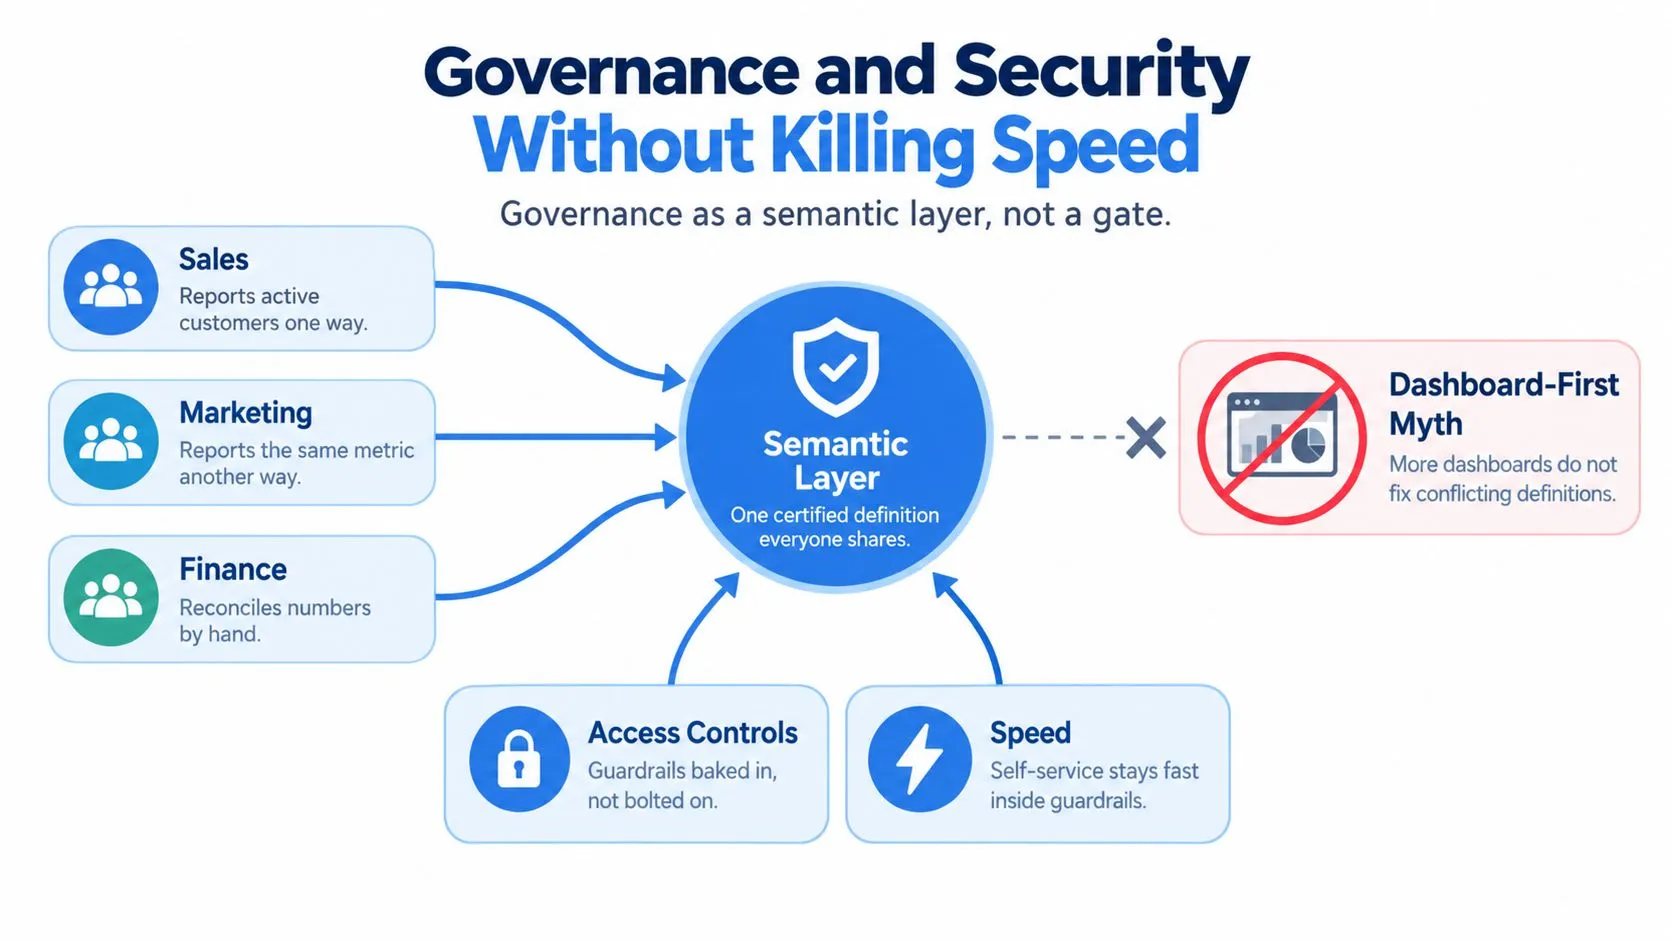
As revenue, product, and finance teams mature, they often build local interpretations of the same terms. One team counts an account when a contract is signed. Another counts it after activation. A third reconciles the figure at month-end. More dashboards won't resolve that disagreement. A shared semantic definition can.
Governance debt becomes visible later
Federated ownership lets domain teams own data products while a central platform enforces access, lineage, quality, and compliance policies. That model reduces dependence on a central data team because the platform applies guardrails automatically instead of routing every decision through manual approval. The data mesh operating model from AWS provides the relevant architectural context.
A useful maturity timeline looks like this:
- Early stage: Speed matters most. Users need answers without adding another analyst to every workflow.
- Scaling stage: Metric consistency becomes urgent as teams create their own reporting habits.
- Growth stage: Governance debt surfaces through sensitive data, duplicated models, and competing definitions.
- AI-ready stage: Natural-language interfaces and agents require inspectable context before they can produce dependable answers.
AI raises the standard
AI makes the interface easier and the foundation more demanding. A user can ask for “active users by region,” but the platform still needs to know which events count, which identity system is authoritative, and which regions the user may access. If those decisions aren't encoded in the semantic model, the AI can generate plausible SQL that answers the wrong question.
Current industry commentary identifies the same tension across AI-assisted BI: incorrect or inconsistent answers undermine trust, while implementation cost, security, integration, and fragmented data remain material obstacles. The discussion of Alteryx alternatives for AI-era analytics is useful because it treats natural language as one layer of the system, not the system itself.
The investment window is narrowing because teams are being asked to do more with leaner data organizations. Buying a conversational feature without fixing definitions merely accelerates the production of conflicting answers. The better sequence is to make governed models usable first, then let AI make those models easier to query.
Governance and Security Without Killing Speed
Self-service breaks when three teams report three different versions of “active customer.” The dashboard may look consistent, but the underlying business rule has already split. Users then create local calculations to reconcile the disagreement, and every new dashboard carries another copy of the conflict.
The dashboard-first myth assumes governance means controlling what appears on a screen. In practice, governance starts earlier, in the semantic layer and the data access path. A platform should make the correct definition the easiest definition to reuse.
Four controls belong in the foundation
Versioned semantic models give metric definitions an owner, review history, and a clear change path. Code review matters because a seemingly small change to cohort logic or date handling can alter every downstream report.
Identity-based column policies protect sensitive fields independently of connection strings. A user should receive permissions based on identity, role, and context, not because someone placed a shared credential inside a dashboard.
Certified metric libraries give business users a short list of approved measures and dimensions. Certification should include meaning, owner, source, refresh expectations, and known limitations. A label without that context is decoration.
Complete audit logs should capture human-written queries and AI-generated queries alike. Teams need to know who accessed which data, what logic ran, and whether a saved answer became a reusable organizational asset.
Operational guidance reinforces this architecture. Catalogs, semantic consistency, least-privilege access, automated freshness and completeness checks, schema validation, and audit trails belong in the data layer, not as fragile additions after a dashboard is published. The governance guidance for self-service analytics outlines these controls in practical terms.
Federate ownership, centralize policy
Analytics engineers can own the shared model and review new metrics. Domain teams can extend approved models with permitted dimensions and documented local logic. That gives sales, product, and finance room to work without allowing each department to redefine the company's core measures in isolation.
Governance should remove ambiguity, not remove agency.
Traditional BI often creates a central bottleneck because the only safe way to change the model is to ask the BI administrator or analytics engineer. A federated approach keeps policy centralized while distributing responsible exploration.
The risk becomes sharper with AI. Platforms without a real semantic layer leak definitions into prompts, examples, and user habits. That makes governance failures faster to reproduce and harder to detect because the output can look polished while the meaning remains wrong. Teams evaluating controls should also review the practical safeguards in analytics security guidance, especially around identity, query visibility, and sensitive data access.
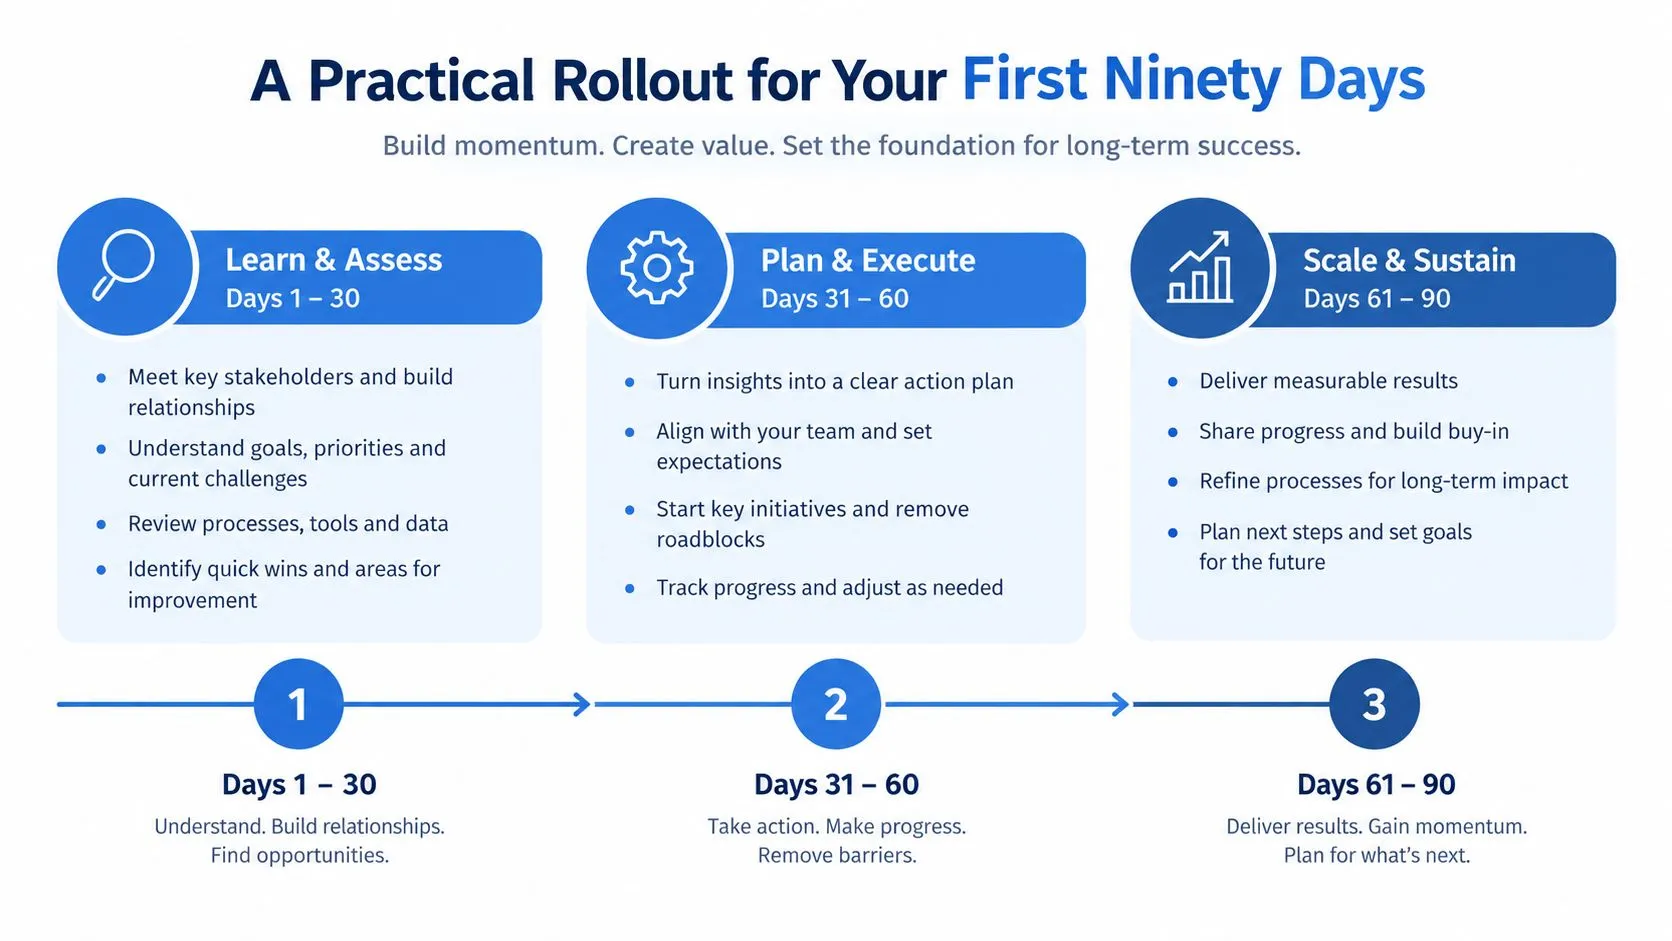
A Practical Rollout for Your First Ninety Days
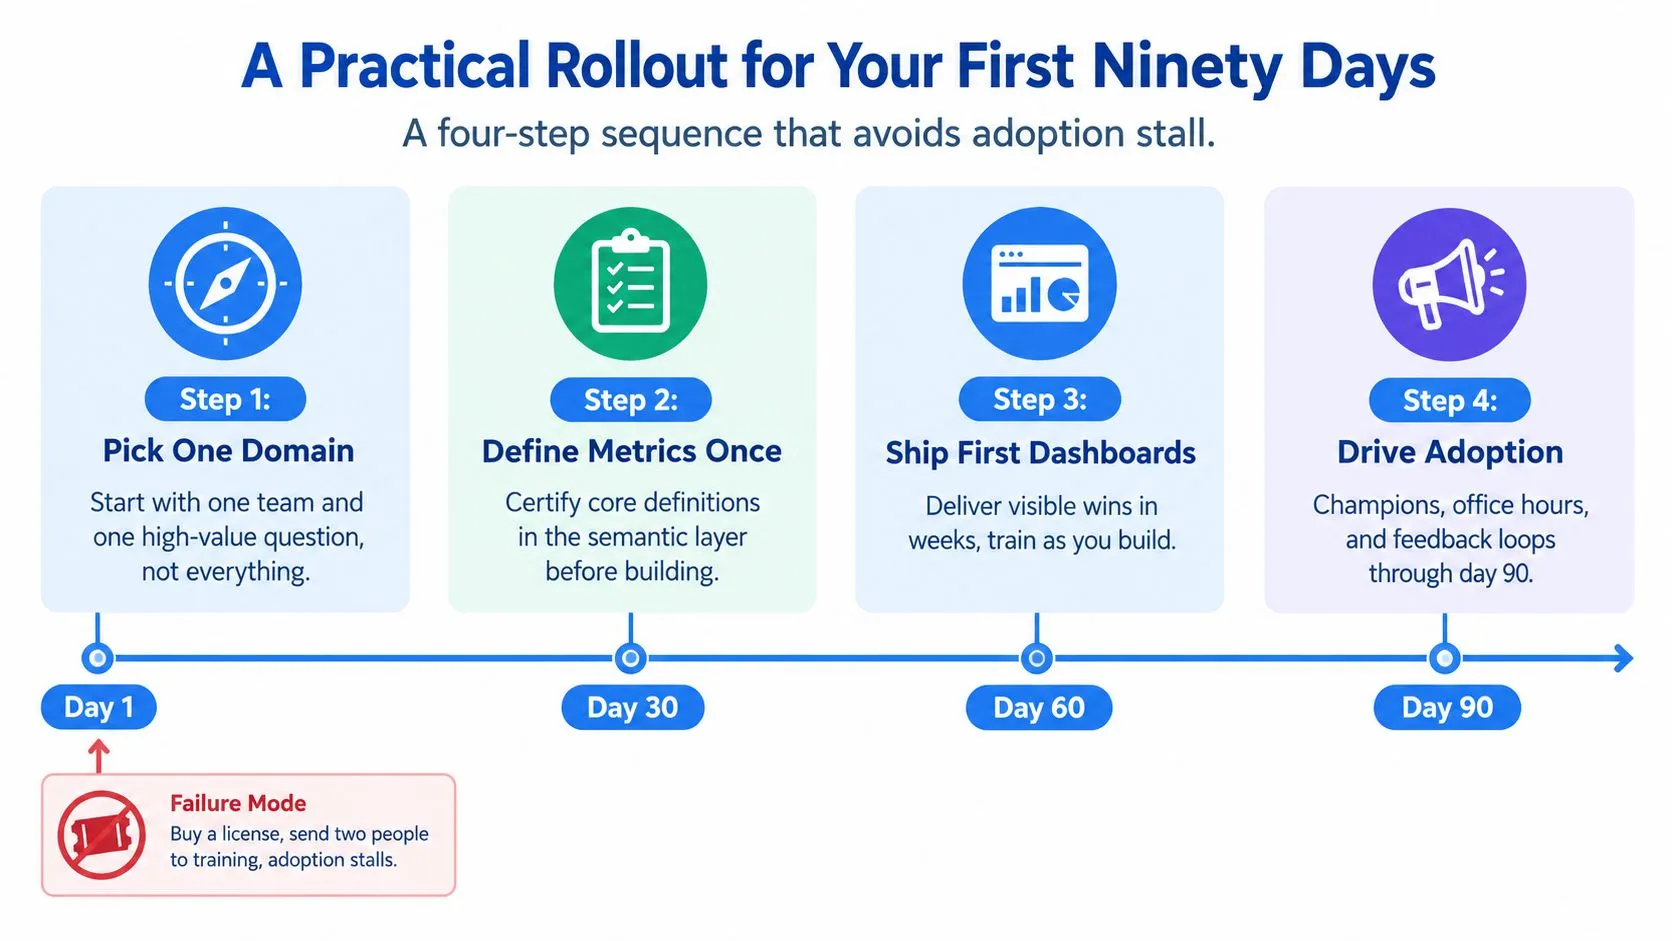
Most rollouts stall because the company buys licenses, trains a small group, and waits for adoption to appear. Users don't adopt an empty workspace. They adopt a place that already answers an important question with definitions they trust.
Days one through fifteen establish the surface
Start with one domain and one high-value question. Don't connect every source or publish every metric. Instrument the warehouse connection, choose a source-of-truth model, and define one core metric per relevant function, such as net new ARR, weekly active users, or pipeline coverage.
Write down the definition, owner, grain, exclusions, and refresh expectation. If the team can't explain why two users should receive the same answer, the metric isn't ready for broad self-service.
Days sixteen through forty-five test real behavior
Recruit a small pilot from revenue, product, and finance. Choose people who ask recurring questions and can describe where current reporting fails. Give them production-like workloads, not a scripted demo.
Watch the questions they ask after the first answer. Those follow-ups reveal whether the platform supports genuine exploration or only polished dashboard consumption. Log failed queries, ambiguous terms, missing dimensions, and requests that require a model change.
Days forty-six through seventy-five turn answers into assets
Create a prompt library for recurring questions, publish certified dashboards where dashboards are still the right format, and establish a lightweight review process for new metrics. The review shouldn't require a committee meeting for every chart. It should determine whether a new definition is local, reusable, or important enough to enter the shared semantic layer.
Use the platform's history to identify which analyses people reuse and which reports nobody opens. Retire redundant content instead of adding another navigation folder.
Days seventy-six through ninety expand with evidence
Extend access after the pilot demonstrates reliable answers and manageable permissions. Retire legacy reports gradually, starting with two reports that duplicate certified analyses and have clear owners. Publish an adoption scorecard that covers active users, recurring questions, unresolved model gaps, stale assets, and access exceptions.
Enable the platform before scaling the audience.
The sequence matters because adoption is a consequence of utility. A larger audience only multiplies confusion when the semantic foundation, permissions, and support loop are unfinished.
How Querio Compares to Traditional BI Tools
The relevant comparison isn't which product makes the prettiest dashboard. It's which product lets a mid-market team answer a new question without sacrificing model integrity.
Querio uses a notebook-on-the-warehouse workflow where SQL, Python, and natural-language requests can coexist in one analytical canvas. That format suits teams that need to inspect generated logic, continue analysis beyond a predefined chart, and preserve the working path behind an answer.
Hex is flexible for notebook-based analysis and collaboration, especially when analysts want to combine code with narrative. Its fit depends on how much semantic governance the team can provide around those notebooks. Looker brings a strong modeling approach through LookML, but the modeling workflow can require specialized technical ownership. ThoughtSpot offers a search-first experience for non-technical exploration, while its usefulness still depends on the quality and completeness of the semantic model underneath.
| Capability | Querio | Hex | Looker | ThoughtSpot |
|---|---|---|---|---|
| Primary workflow | Notebook-native analysis on warehouse data | Collaborative notebooks | Governed explores and dashboards | Search-led analytics |
| Natural-language analysis | Works alongside inspectable notebook cells | Supports assisted analytical workflows | Depends on modeled context and supported features | Central to the user experience |
| Semantic approach | Semantic context connected to the analytical workspace | Governance depends on configured data assets and workflow | Strong, code-based LookML model | Prebuilt semantic model required for dependable search |
| Technical flexibility | SQL, Python, and natural language in one canvas | Strong notebook flexibility | Strong modeling, more structured development | Strong search experience, less notebook-oriented |
| Best fit | Mid-market teams that need flexible self-service analysis | Analyst-led teams combining code and collaboration | Larger organizations with dedicated modeling ownership | Organizations prioritizing search-driven access |
| Main evaluation risk | Verify model depth, permissions, and production controls | Prevent notebook sprawl and duplicated logic | Account for modeling dependency and learning curve | Validate answer quality against real business language |
Power BI and Tableau can remain sensible choices when the organization prioritizes established dashboard workflows, broad ecosystem integration, or polished visual reporting. They fall short when users need to move from a fixed view into a new analytical path without waiting for a model owner.
For a five-person data team at a Series B company, the decisive question is whether the product reduces recurring translation work while keeping the warehouse and definitions central. For a forty-person analytics organization at a public mid-market firm, the decision shifts toward lifecycle management, permissions, lineage, deployment controls, and the ability to support multiple analytical experiences without duplicating logic.
Teams comparing notebook-led and AI-first workflows should also review Querio against Power BI for non-technical teams. Don't select from a feature checklist. Put the same ambiguous business question into each finalist and inspect the generated logic, the model references, the permission behavior, and the effort required to correct an answer.
Choosing the Right Platform for Your Team
Treat vendor evaluation as an operating-model test, not a product tour. A passing platform should make trustworthy self-service repeatable. A weak platform will show a feature flag, a sample dashboard, and a natural-language demo while leaving your team to solve the hard parts manually.
Use these five filters.
Semantic layer maturity
Ask where metric definitions live, who owns them, how changes are reviewed, and whether the same definitions serve dashboards, notebooks, and AI queries. A passing answer includes inspectable logic, named ownership, reusable dimensions, and a clear process for promoting local definitions into shared ones.
Governance flexibility
Check whether access follows identity, whether policies can reach sensitive columns, and whether audit history covers generated queries as well as manual work. A vendor that only demonstrates workspace permissions hasn't answered the fundamental security question.
Warehouse-native architecture
Confirm whether the platform works with your warehouse or lakehouse without forcing a second copy of core business data. Test query behavior, freshness, lineage, and failure handling against production-like schemas. A diagram showing a connector isn't proof of a workable operating model.
AI readiness
Ask the platform to answer an ambiguous question using your own vocabulary. Then inspect the generated SQL or notebook cells, the metric definitions it selected, and the evidence attached to the result. Natural-language access is ready for production only when users can understand, correct, and reuse the logic.
Total cost of ownership
Count more than licenses. Include modeling effort, warehouse consumption, permissions administration, migration, training, support, report retirement, and the time required to maintain definitions. A low entry price can still produce a costly platform if every useful question requires engineering work.
During a thirty-minute finalist call, score each platform from one to five across those filters. Weight semantic maturity and governance more heavily if analyst autonomy is the priority. Weight visual composition and distribution if executive dashboards dominate. Weight embedding, identity propagation, and query isolation if customers will use the analytics experience.
Teams between ten and two hundred people should run a structured two-week pilot with real workloads before signing. Use production-shaped data, real users, ambiguous questions, sensitive fields, and follow-up analysis. Vendor demos hide integration debt. Business users expose it quickly.
Querio provides a warehouse-connected workspace where teams can ask questions in plain English, inspect generated notebook work, and build reusable analyses without routing every follow-up through an analyst. If your current BI stack has become a queue of fixed dashboards and manual metric interpretation, test the workflow with your own questions by visiting Querio.