Business Intelligence
Sigma vs Looker (2026): The Spreadsheet Challenge
Compare Sigma's spreadsheet-style live workbooks and writeback with Looker's LookML-governed BI to decide on governance vs flexibility.
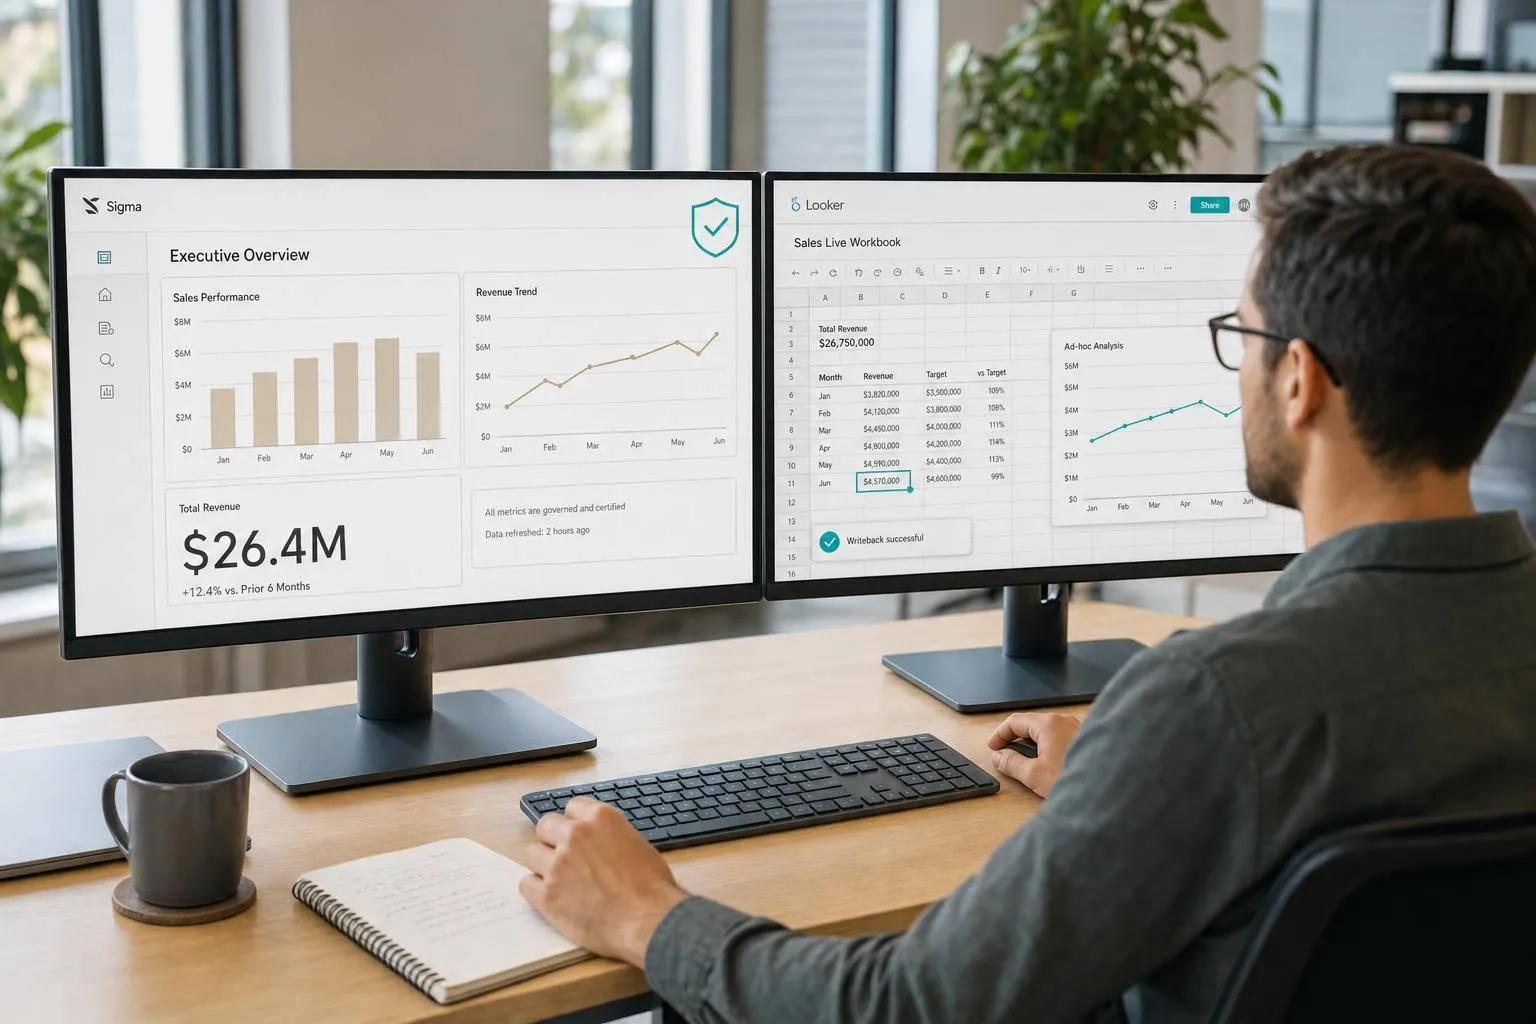
If I had to sum it up in one line: Sigma feels like Excel on top of your warehouse, while Looker feels like BI built around a governed model.
If you want hands-on analysis with live Snowflake, BigQuery, Redshift, or Postgres data, I’d put Sigma first. If you want one place for metric definitions and tighter control across dashboards, I’d put Looker first.
Here’s the short version:
- Sigma is better for spreadsheet-style work, ad hoc analysis, pivots, and finance-style input workflows.
- Looker is better for teams that want metrics controlled in LookML. This approach relies on a robust semantic layer to ensure consistency.
- Both tools run live queries on the warehouse, so performance depends a lot on warehouse design, caching, concurrency, and query complexity.
- Sigma supports writeback through Input Tables; Looker is read-only.
- Looker Developer seats are listed at $1,665 per user per year.
- The tradeoff is simple: Sigma gives more freedom; Looker gives more control.
For most 100–500-employee teams, the choice comes down to one question: Do you want workbook-first analysis, or model-first BI?
::: @figure 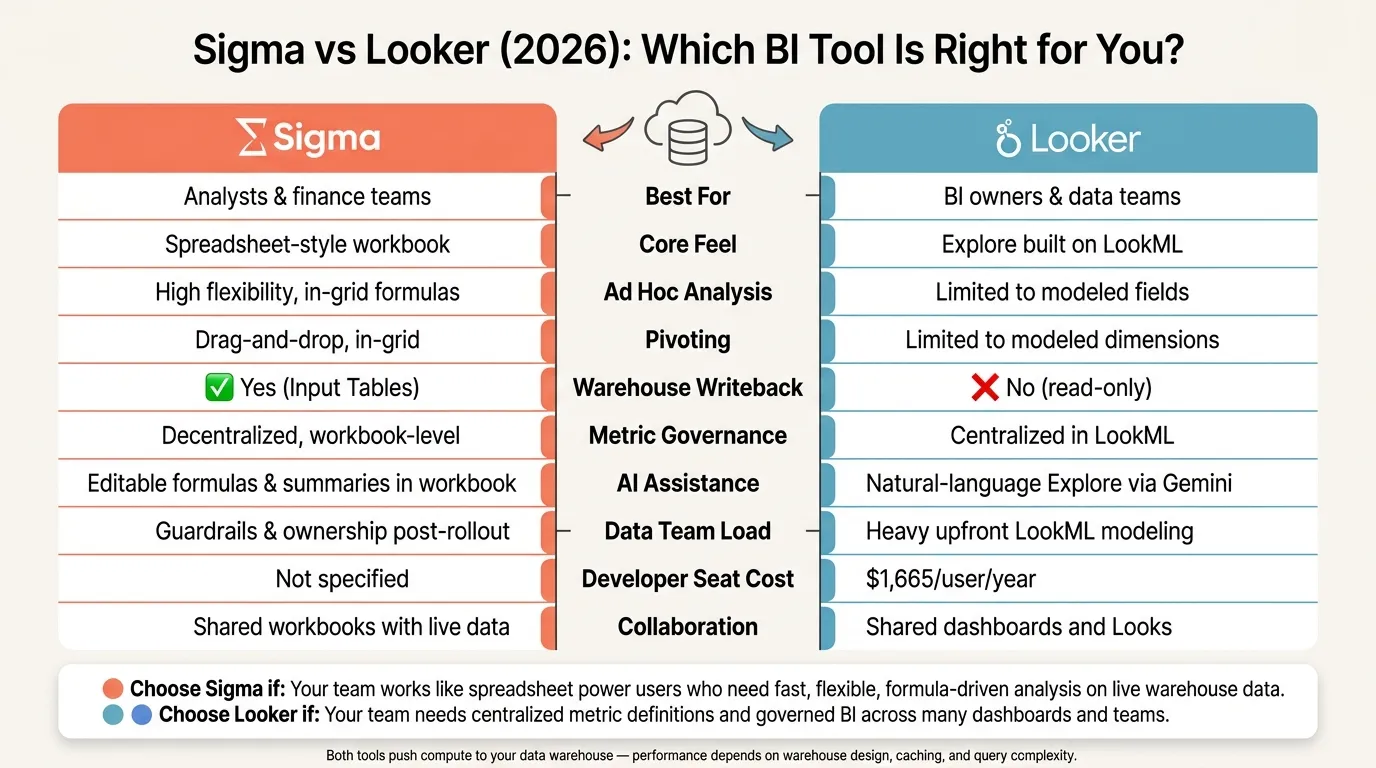 {Sigma vs Looker 2026: Side-by-Side BI Tool Comparison}
:::
{Sigma vs Looker 2026: Side-by-Side BI Tool Comparison}
:::
Why Sigma Tops Looker: Bulky Semantic Layers are the Analytics Bottleneck
::: @iframe https://www.youtube.com/embed/vhieqrnLHIQ :::
Quick Comparison
| Criteria | Sigma | Looker |
|---|---|---|
| Best for | Analysts and finance teams | BI owners and data teams |
| Main feel | Spreadsheet-like workbook | Explore built on LookML |
| Ad hoc work | High | Limited by modeled fields |
| Pivoting | In-grid | Based on modeled dimensions |
| Writeback | Yes | No |
| Governance | Workbook rules and certified sources | Central metric control |
| AI use | Formulas and summaries in workbook | Natural-language help in Explore |
| Data-team load | More guardrails after rollout | More model work up front |
My read is simple: choose Sigma if your team works like a spreadsheet power user for self-service business intelligence; choose Looker if your team works like a governed BI shop. That one split explains almost every difference in the article.
How Sigma and Looker differ at the product level
Sigma exposes warehouse data in a spreadsheet-like grid; Looker exposes only modeled fields through LookML. That one product choice changes a lot: how analysts build calculations, how business users dig into data, and how much control the data team keeps over metric definitions.
Sigma: workbook-first analysis on live warehouse data
Sigma gives analysts a spreadsheet-style grid tied to Snowflake, BigQuery, Redshift, or Postgres. So instead of jumping through a heavy modeling step first, they can work with rows, columns, and formulas while the data stays live in the warehouse. That tends to make things feel faster when analysts need to build, test, and tweak formulas on their own.
Sigma also supports Input Tables, which let users write back to the warehouse. That’s a big deal if your team wants analysis and planning to happen in the same place instead of bouncing between BI and spreadsheets.
Looker: Explore-first analysis through LookML
In Looker, exploration starts only after a developer sets up the model in LookML, a centralized, version-controlled modeling layer. That setup keeps metric logic in one place, so finance and RevOps are looking at the same numbers. If consistency is the main goal, that’s a strong argument for Looker.
The flip side is less freedom for ad hoc work. Users can explore what has been modeled, but they can’t just build from anything in the warehouse on the fly. Looker Developer seats run $1,665 per user per year [1].
What feels like Excel and what does not
| Capability | Sigma | Looker |
|---|---|---|
| Ad hoc formula creation | ✅ Spreadsheet-style, in-grid | ❌ Requires LookML definition |
| Pivoting | ✅ In-grid, drag-and-drop | ⚠️ Limited to modeled dimensions |
| Warehouse write-back | ✅ Input Tables supported | ❌ Read-only |
| Metric governance | ⚠️ Decentralized; logic lives in workbooks | ✅ Centralized in LookML |
| Ad hoc flexibility | High - analysts work freely | Constrained to modeled fields |
| Collaboration | ✅ Shared workbooks with live data | ✅ Shared dashboards and Looks |
| Performance | Pushes compute to warehouse | Pushes compute to warehouse |
| AI-assisted analysis | ✅ AI-generated formulas and summaries | ✅ Looker conversational analytics |
You’ll feel these differences most in revenue, marketing, and finance work. Sigma leans toward speed and hands-on analysis. Looker leans toward control and shared metric logic. The easiest way to spot the tradeoff is to put both tools through the same common BI workflows.
Four workflow tests: revenue, marketing, finance, and dashboard-to-analysis
Ad hoc revenue analysis and marketing pacing
A revenue analyst in Sigma can filter ARR by customer segment, add a net retention formula, and pivot results by month without changing the data model. In that same workbook, they can also test campaign pacing in the same session.
In Looker, the same task starts with whatever has already been modeled. If net retention or a campaign dimension hasn't been set up in LookML, someone needs to add it first. That gap shows up even more in finance, where review and planning often happen in the same file.
Finance variance review and spreadsheet-style inputs
A finance manager doing an actual-vs.-plan variance review in Sigma can work from live Snowflake, BigQuery, Redshift, or Postgres data, add variance percentage columns inline, pivot the view, and enter scenario inputs directly in the workbook. That means plan and actuals can live in one place.
Looker does a good job with actuals when the model is already built. But planning still sits outside that workflow. For month-over-month review, Looker’s modeled dimensions stay consistent - but only if someone has already defined them in LookML. The next test is simple: can a shared dashboard turn into an editable analysis fast enough to answer the next question?
From shared dashboard to editable analysis
In Sigma, a user can open a shared workbook, change a filter or grouping, and keep working on live warehouse data.
In Looker, ad hoc analysis begins with the fields already exposed in LookML. Those guardrails help teams stick to one metrics or semantic layer definition, but they also narrow ad hoc testing.
Sigma vs Looker comparison table: the buying criteria that matter
Use the table below to connect those workflow differences to the buying criteria that matter most.
| Criteria | Sigma | Looker |
|---|---|---|
| Spreadsheet feel | Workbook-first analysis on live warehouse data | Explore-first analysis built on LookML |
| Pivoting | Drag-and-drop, in-grid pivots | Limited to modeled dimensions |
| Writeback/Input support | Input Tables and warehouse writeback | No native writeback |
| Calculation flexibility | Analyst-built calculations at the workbook level | New measures usually require LookML changes |
| Semantic modeling | Workbook-level calculations on top of certified sources | Centralized in LookML with consistent metric definitions |
| Governance | Requires workbook ownership standards and certified data sources | Central metric control through LookML |
| Dashboard-to-analysis workflow | Open a shared dashboard, change filters, and keep analyzing in place | Explore-first analysis from fields already exposed in LookML |
| Collaboration | Shared workbooks with live data | Shared dashboards and Looks |
| Performance | Warehouse-dependent; performance hinges on data design, caching, concurrency, and query complexity | Warehouse-dependent; performance hinges on data design, caching, concurrency, and query complexity |
| AI-assisted analysis | Editable AI-generated formulas and summaries in the workbook | Natural-language help inside Explore, bounded by LookML |
| Data-team overhead | More work around guardrails, certification, and ownership | More upfront modeling and ongoing LookML upkeep |
| Best-fit users | Analysts and finance teams who need flexible workbook analysis on live warehouse data | BI owners and data teams that require centralized metric definitions across dashboards |
Calculation, modeling, and governance tradeoffs
Sigma gives teams a lot of room to work. That sounds great, and often it is. But there’s a catch: someone still has to keep things clean.
Without clear ownership rules and certified data sources, workbooks can pile up fast. Then metric definitions start to drift. At that point, the data team spends less time building models and more time setting guardrails, checking sources, and sorting out whose number is “right.”
Looker has the opposite pull. Its central control is strong, but it can turn into a bottleneck. If a measure doesn’t already exist in LookML, someone on the analytics engineering side usually has to step in. For teams with a small data function, that queue can slow business users down more than they’d like. Still, if metric consistency across many dashboards is non-negotiable, that tradeoff can make sense.
Performance and AI capabilities in 2026
Both tools query your warehouse directly - Snowflake, BigQuery, Redshift, or Postgres. So performance comes down to warehouse design, caching, concurrency, and query complexity, not just the BI layer sitting on top.
AI is moving fast on both sides, too. Sigma generates calculations and summaries inside the workbook, which means the logic stays visible and editable. Looker’s Gemini integration brings natural-language querying into the Explore flow, with field suggestions limited by LookML. Put simply: Sigma keeps the logic editable in the workbook, while Looker keeps it inside LookML.
Those tradeoffs point straight at a bigger question: what kind of operating model does your team want day to day? The next section turns that into a buy-or-migrate decision.
Which tool to choose and what to decide before buying or migrating
Choose Sigma, choose Looker, or evaluate Querio for a different operating model
These choices line up with the workflow tests above. If your team leans toward analyst-led flexibility, that points to Sigma. If you need one place to control metrics across teams, that points to Looker.
Choose Sigma if your analysts and finance teams want spreadsheet-style analysis on live warehouse data. That’s the pattern that came up in the revenue, marketing, and finance tests above: fast formula changes, inline pivots, and variance review without waiting for a model update.
Choose Looker if your organization needs centralized metric definitions across many teams and dashboards, especially on Google Cloud and BigQuery. Looker tends to work best when you can support dedicated LookML ownership. The main question is simple: can your team own the model behind the metrics?
You may also want to evaluate Querio if you’re looking for a different operating model. In that case, the core issue isn’t just what the tool shows on screen. It’s who owns the logic, who keeps it clean, and how people will use it day to day.
Key points before buying or migrating
The interface matters, but ownership matters more. Before you sign anything, check a few things:
- Whether your team has the capacity to maintain LookML over time
- Whether you have clear workbook ownership standards to stop metric drift
- Whether someone will own the context layer behind any AI data analysis platforms
That last point is easy to gloss over, but it matters a lot. Tools can help people move faster, but your team still owns the definitions.
FAQs
::: faq
Which tool is easier for spreadsheet-heavy teams?
Sigma tends to be easier for spreadsheet-heavy teams because its Excel-like grid and workbook setup feels familiar right away. For non-technical users, that matters a lot. They can filter, pivot, and run calculations on live data from Snowflake, BigQuery, Databricks, or Redshift without writing SQL.
Looker, on the other hand, usually feels more developer-heavy because it relies on semantic modeling through LookML. That setup can slow down self-serve work, especially for users who are used to thinking in spreadsheets first. :::
::: faq
How much data-team support does each tool need?
Sigma usually needs less day-to-day help from the data team for spreadsheet-style self-service. That makes it easier for business teams to explore data on their own. But there’s a catch: teams still need clear rules, or metrics can drift across different workbooks.
Looker often needs more ongoing support, including people who can work in LookML. Its governance-first setup tends to take 4–12 weeks and usually calls for continued engineering support to keep metrics consistent and auditable. :::
::: faq
How should we evaluate governance vs. flexibility?
Balance shared metrics against the need for fast, ad hoc analysis. If reports like MRR or finance reconciliations need to match across teams, put a centralized semantic layer first. That helps cut metric drift and keeps everyone working from the same logic.
If your main goal is quick, spreadsheet-style analysis, flexible workbook workflows may be the better fit.
Focus on metric consistency, inspectable SQL or Python, and the way each tool fits your team’s day-to-day work. :::