Business Intelligence
Power BI Copilot Not Working? 7 Alternatives That Ship Answers
When an AI reporting assistant fails, warehouse-native tools with inspectable SQL and a governed metric layer beat black-box answers.

If Power BI Copilot is blocked by Fabric, cost, or weak answer quality, I’d shortlist tools that query the warehouse directly, show the SQL, and stick to your permissions. In this group, the article covers 7 options: Querio, ChatGPT + warehouse, Claude + MCP, Gemini on BigQuery, ThoughtSpot, Tableau Pulse, and Microsoft Fabric Copilots.
Here’s the short version:
- Querio: best for governed warehouse Q&A with visible SQL/Python and GitHub/dbt context
- ChatGPT + warehouse: best for solo SQL drafting, weak for shared KPI control
- Claude + MCP: best for ad hoc root-cause work across systems, weak for team-wide metric consistency
- Gemini on BigQuery: best if your data already lives in BigQuery and metrics are modeled
- ThoughtSpot: best for search-led self-serve on top of a modeled warehouse
- Tableau Pulse: best for KPI monitoring inside Tableau
- Fabric Copilots: best if you already run inside Microsoft Fabric
A few numbers stand out fast:
- Fabric F2 starts at about $9,000/year
- Power BI Pro is $14/user/month
- Querio starts around $4,800–$6,000/year
- ThoughtSpot starts at $25/user/month
- Tableau Creator starts at $75/user/month
- The article says Power BI Copilot scored 4.4/10 in one financial modeling benchmark
- Querio reports 77%–95% accuracy on business questions
The main filter is simple: where your data lives, how strict your metric rules are, and how soon you need answers people can check. If you need one shared number, plain-English Q&A alone is not enough. The metric layer as a data interface matters more than the model chat box.
::: @figure 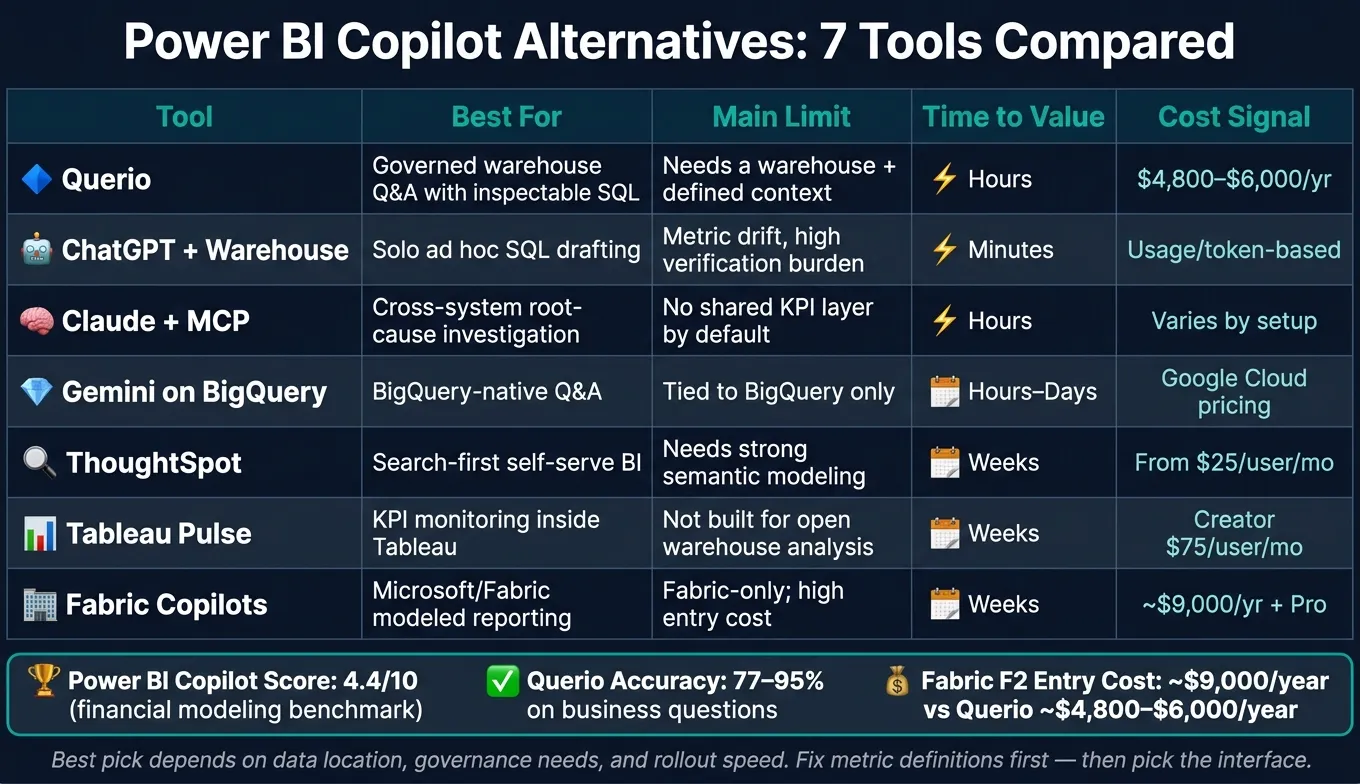 {Power BI Copilot Alternatives: Side-by-Side Comparison 2025}
:::
{Power BI Copilot Alternatives: Side-by-Side Comparison 2025}
:::
Claude Code Just Replaced Power BI Copilot (Here’s Proof)
::: @iframe https://www.youtube.com/embed/VLtHwOO7F0M :::
Quick Comparison
| Tool | Best for | Main limit | Setup speed | Cost signal |
|---|---|---|---|---|
| Querio | Governed warehouse answers | Needs a warehouse and defined context | Hours | $4,800–$6,000/year |
| ChatGPT + Warehouse | Solo SQL drafting | Metric drift, answer checking burden | Minutes | Usage-based/token costs |
| Claude + MCP | Cross-system investigation | No shared KPI layer by default | Hours | Varies by setup |
| Gemini on BigQuery | BigQuery-native Q&A | Tied to BigQuery | Hours to days | Google Cloud-based |
| ThoughtSpot | Search-first BI | Needs good semantic modeling | Weeks | From $25/user/month |
| Tableau Pulse | KPI monitoring in Tableau | Not built for open-ended warehouse analysis | Weeks | Creator $75/user/month |
| Fabric Copilots | Microsoft/Fabric reporting | Fabric-only path, higher entry cost | Weeks | F2 about $9,000/year + Pro |
If I were choosing, I’d start with one test: ask 3–5 weekly business questions, check whether the tool shows the SQL, matches the source of truth, and says “I don’t know” when data is missing.
1. Querio
For teams that already use a data warehouse, Querio is one of the fastest ways to deliver governed answers without rebuilding your BI stack. It connects straight to Snowflake, BigQuery, Redshift, ClickHouse, Postgres, and MySQL, then turns plain-English questions into inspectable SQL and Python inside a notebook.
What It Answers Well
Querio handles the kinds of questions data teams get all the time: KPI lookups like What was ARR last quarter?, drill-downs by segment or region, anomaly checks, and multi-step follow-up analysis. Querio reports an accuracy rate of 77–95% on business questions [1].
Just as important, it only answers from data that actually exists. If the data isn't there, it says so instead of inventing a number. That's a big deal when people are using the output to make decisions.
Where It Falls Short
Querio is built for teams that already run on a proper warehouse. If your data still lives in spreadsheets or scattered SaaS exports, you'll need to move it into a warehouse first.
It's also not the right pick if you need a classic BI suite for managed reporting. Querio is more about governed self-serve answers than full dashboard management.
Setup Requirements
Setup takes minutes. You add a connection string, then define your context layer: metric definitions, joins, and trusted SQL, Markdown, and Python files synced to GitHub with your dbt project.
That context layer stays in GitHub next to your dbt project. Once that's in place, the agent can start answering questions.
Querio's cost floor starts at around $4,800–$6,000 per year, which is roughly half of the ~$9,000 per year Fabric F2 entry point before you add Pro seats [1].
Governance and Team Fit
Querio is SOC 2 Type II certified and supports role-based access control (RBAC) [4]. With OAuth, each agent query inherits the individual user's data permissions, whether the question comes from Slack, Microsoft Teams, or Claude via MCP.
That setup makes Querio a strong fit for 100–500-employee B2B SaaS, healthcare, and finance teams that want governed self-serve analytics with controlled metric definitions.
If your team needs a different interaction model, the next options cover general-purpose assistants, warehouse-native copilots, and dashboard-first tools.
2. ChatGPT Connected to a Data Warehouse
ChatGPT can connect to a warehouse through MCP servers such as DBHub, which expose Postgres, MySQL, or Snowflake as live SQL sources. Set up the MCP server with a connection string and read-only credentials, and ChatGPT can begin drafting SQL against the live schema [4].
What It Answers Well
This setup is a good fit for ad hoc analysis. An analyst can ask a question, review the draft SQL, and then run it. It also helps stakeholders look through raw tables before a metric gets modeled.
That kind of speed is handy for exploration. You can move from question to draft query in very little time. But once several people need the same number, things start to get messy.
Where It Falls Short
The biggest issue is metric drift. Without a shared semantic layer, the model may interpret the same question in different ways, especially in large schemas with undocumented joins [3][4].
And here's the tricky part: a query can run perfectly and still return the wrong number [4].
Without shared metric logic, finance, revenue, and ops teams won't trust the same answer. So while this setup can help one person move faster, it doesn't give teams much control over shared reporting.
Setup Requirements
Use read-only access. Also, spot-check generated SQL against known results. That step matters more than it may seem at first glance.
There’s also the cost side. LLM token costs can add up fast at scale [1][4].
Governance and Team Fit
ChatGPT connected to a warehouse fits individual analysts who need fast SQL drafting, not teams that need one shared KPI definition.
Use it for solo exploration. Skip it for organization-wide KPI reporting.
If your team needs AI answers with tighter shared governance, the next option takes a different route.
3. Claude with MCP
Claude with MCP uses the Model Context Protocol to give Claude scoped, permission-based access to your database through tool calls like list_tables and execute_sql. In plain English, it can look into your data and follow a trail. That makes it a better fit for investigation than for shared KPI reporting. Common connectors include DBHub for Postgres, MySQL, and SQL Server, plus Supabase MCP servers [4].
What It Answers Well
A standard BI bot usually answers a single question from modeled data. Claude can go further. If you ask, "Why did revenue drop while support tickets spiked?", it can split that into smaller checks, query different tables, and dig into root causes.
That’s a big deal for ad-hoc analysis. Instead of stopping at one chart or one metric, it can trace what changed across billing, product, and support data. For standardized KPI answers, though, the next section covers a more warehouse-native path.
Where It Falls Short
This is where things can go sideways. Without SQL in context-aware AI analytics and a shared semantic layer, Claude can give you an answer that looks right but isn’t. A multi-table join may run cleanly and still reflect the wrong business logic [4].
That’s the core risk with text-to-SQL in production. Schema misinterpretation is still the main failure point [4]. So even when the SQL works, the answer may not match how your team defines revenue, churn, or ticket volume.
Setup Requirements
Start with read-only access. Limit which tables and columns it can touch. Then test its answers against actual business questions before rollout [4][2].
"Accuracy lives in your semantic layer and your evaluation set, and the tool sits on top of that." - Valiotti Data [2]
Governance and Team Fit
Claude with MCP works best for technical analysts and data engineers at warehouse-backed B2B SaaS, healthcare, and finance teams that need ad-hoc investigation across systems like CRM, billing, and support.
It’s a weaker fit for company-wide KPI reporting, where shared metric definitions matter most. Use it for exploratory analysis, not as the system of record. If your team runs on BigQuery, the next option will feel more native to that setup.
4. Gemini on BigQuery
If your team already runs on BigQuery, Gemini is a practical warehouse-native pick for KPI lookups, SQL-backed analysis, and anomaly checks on BigQuery data. It can return answers straight from BigQuery when the metric logic already lives in dbt or Looker.
That matters more than it might seem. If your team has already done the hard work of defining metrics in dbt or Looker, Gemini has something solid to lean on. With a mature semantic model in place, it can answer warehouse questions with more consistency.
Where It Falls Short
Things get shakier when metric definitions aren't clearly modeled in dbt or Looker. In that case, Gemini has less business context to ground its answers, which makes it less reliable.
Setup Requirements
You need BigQuery access, the right IAM roles, and a modeled layer in dbt or Looker to get the best results. This setup tends to work best when analytics, finance, and ops already share the same modeled metric layer.
Governance and Team Fit
Gemini on BigQuery makes the most sense for data and analytics teams already working in Google Cloud. It’s a weaker choice for company-wide self-serve analytics if non-technical users need answers they can trust and inspect from a governed metric layer.
And if your team spends more time in dashboards than in SQL, the next option is built more for that kind of workflow.
5. ThoughtSpot
For teams that want business-user search instead of SQL-heavy analysis, ThoughtSpot is a search-first BI layer. It works best when the metric logic is already modeled and people want a direct answer, not a long dashboard scavenger hunt.
What It Answers Well
ThoughtSpot is strong at KPI lookups, drill-downs, and anomaly follow-up when the semantic model is already in place. If a question falls outside that modeled semantic layer, it returns no answer instead of guessing [1].
Where It Falls Short
That upside depends heavily on how complete the semantic layer is. If metrics, synonyms, and business terms aren’t mapped well, search quality drops fast. And when that happens, business users won’t get reliable self-serve answers [2].
There’s also a ramp-up period. In most cases, rollout takes weeks before answers become reliable [1].
Setup Requirements
You’ll need to connect ThoughtSpot to Snowflake, BigQuery, Redshift, or Postgres first. After that, the team has to define the semantic layer and set up business synonyms before rollout [2].
Pricing starts at about $25/user/month for Team and $50/user/month for Pro. Enterprise pricing is custom [1][3].
Governance and Team Fit
ThoughtSpot fits mid-market and enterprise teams that want search-driven self-serve BI on top of a modeled warehouse layer, similar to how other AI powered analytics platforms compared handle governance. It makes the most sense for data leaders, analytics teams, and business users in warehouse-backed SaaS, healthcare, and finance organizations [3].
If your team wants AI inside existing dashboards instead of a separate search layer, Tableau Pulse is the next option.
6. Tableau Pulse
For teams already set on Tableau, Tableau Pulse makes the most sense as an AI-assisted monitoring layer. It works best when your metrics and dashboards already live inside Tableau. And that matters, because Pulse is built to solve a different job than live warehouse Q&A.
It’s made for ongoing metric monitoring, not open-ended analysis. Put simply: this is a monitoring layer, not a general-purpose BI copilot.
What It Answers Well
Pulse is good at the steady drumbeat of KPI tracking. It tracks KPIs, summarizes trends, and flags anomalies [2].
If your team wants quick updates on how the business is doing without digging through dashboards all day, that’s where it shines.
Where It Falls Short
The tradeoff is pretty clear. Pulse only works inside the Tableau model. If someone asks a question that goes beyond the data already modeled in Tableau, that’s where it stops.
So it’s strong for recurring KPI monitoring, but weak for ad hoc, cross-source investigation. In plain English: it’s useful for watched metrics, not for warehouse-native exploration.
Setup Requirements
Pulse and Ask Data come with Creator ($75/user/month). Tableau+ adds Tableau Agent and expanded Q&A through contact sales [2].
Governance and Team Fit
Tableau keeps modeling centralized, which means business users only see approved metrics and existing dashboards. That setup works well for teams that want tight control over authoring and a more guided experience for business users.
If your team wants warehouse-native, inspectable answers that go past pre-modeled metrics, Microsoft Fabric Copilots is the next comparison.
7. Microsoft Fabric Copilots
If your data already sits in Fabric and your metrics are set up in a semantic model, Fabric Copilots can do the basics well: KPI lookups, report summaries, and chart suggestions. They work best when the question stays inside one governed system. They’re much less useful when you need to pull answers across several tools or data platforms.
That makes the trade-off pretty clear: good for modeled Fabric reporting, not so good for cross-source investigation.
What It Answers Well
Fabric Copilots do their best work on descriptive questions tied to a mature semantic model. That includes recurring KPI summaries, narrative report generation, and suggestions for how to visualize data. For prompts like "show me product category sales by month, filtered by region," they perform reasonably well [1].
Where It Falls Short
The tool stays dependable only when the question lines up with the modeled data. If your warehouse data lives in Snowflake, BigQuery, or a dbt-managed setup, that data needs to be routed into Fabric first. That makes Fabric Copilots a weaker choice for cross-source analysis and multi-system investigations [1].
There’s another catch: output quality still depends on stitching LLMs to a semantic layer. If values are missing, the system can produce made-up answers. And when DAX gets complex, a person still needs to check the result. In financial modeling tasks, Power BI Copilot scored 4.4/10, which put it well below a human junior analyst at 6.4/10 [1].
Setup Requirements
Fabric Copilots are not something you switch on in an afternoon. Data needs to be modeled and published in Fabric first, and setup often takes weeks [1].
On cost, Power BI Pro is $14 per user per month after Microsoft's April 2025 price increase. Fabric access starts at F2 capacity, which costs about $9,000 per year [1]. If usage is heavier, F64 capacity runs about $6,400 per month [2].
Microsoft is also retiring the legacy Power BI Q&A feature in December 2026, so teams still using it should plan for a move sooner rather than later [1].
Governance and Team Fit
Fabric Copilots make the most sense for teams that already have:
- a mature semantic model
- predictable KPI questions
- enough DAX skill in-house to review AI output
Here’s the deployment and licensing snapshot.
| Requirement | Detail |
|---|---|
| User license | Power BI Pro at $14/user/month [1] |
| Minimum capacity | Fabric F2, about $9,000/year [1] |
| Higher-demand capacity | Fabric F64, about $6,400/month [2] |
| Data requirement | Published in Fabric [1] |
| External sources | Snowflake, BigQuery, and dbt data must be routed into Fabric first [1] |
| Migration note | Legacy Power BI Q&A retires in December 2026 [1] |
Pros, Cons, and Trade-Offs at a Glance
No tool wins across every line item. The best pick depends on where your data sits, how much control you need, and how fast you want an answer you can trust.
| Tool | Biggest Strength | Main Drawback | Governance Posture | Time to Value |
|---|---|---|---|---|
| Querio | Governed semantic context layer; inspectable SQL/Python; honest "I don't know" responses | Requires maintained governed context definitions | High - context layer synced to GitHub/dbt; role-based access; OAuth for MCP | Hours |
| ChatGPT + Warehouse | Fast ad hoc SQL drafting and analysis | High verification burden; fabrication risk [1] | Low to variable - depends on the framework used [4] | Minutes |
| Claude + MCP | Scoped, permissioned access without exposing raw credentials [4] | Requires MCP server infrastructure to set up [4] | Moderate - read-only defaults, table-scoped access [4] | Hours |
| Gemini on BigQuery | Native BigQuery integration; no data movement | Limited to BigQuery | Moderate - tied to BigQuery IAM permissions | Hours to days |
| ThoughtSpot | Strong self-serve search UX | Starts at about $25/user/month; costs rise with usage [3] | High - governed data models | Weeks |
| Tableau Pulse | Familiar Tableau ecosystem; strong visualization layer | Works best if your team already uses Tableau | Moderate - Tableau Server/Cloud permissions | Weeks |
| Microsoft Fabric Copilots | Deep Microsoft ecosystem integration; KPI summaries on modeled data [1] | Fabric F2 capacity starts at about $9,000/year before Pro licenses; Copilot can fabricate data on missing values [1] | High within Fabric boundaries [1] | Weeks |
A simple pattern shows up here: the fastest dependable options tend to keep SQL in view and make shared definitions easy to check.
Use this matrix to cut your shortlist based on three things that matter most in practice:
- Data location
- Governance needs
- Rollout speed
Conclusion
The best tool depends on where your data lives and how much your team can trust the answers it gives.
A simple way to think about it: start with data location, then look at governance needs, then consider rollout speed. That same pattern shows up across all seven options. Data that stays in your warehouse, paired with logic your team can inspect, tends to beat black-box answers.
If your stack is Microsoft-first, AI copilots are the most direct path. If your data sits in Snowflake, BigQuery, or Redshift and your team needs SQL it can inspect, a warehouse-native setup with a governed semantic layer is often the safer bet. And if non-technical users need self-serve search, ThoughtSpot has a strong UX. Just make sure the data model is set up first so people can trust the answers.
Fix governed metric definitions first. Then pick the interface.
For the final check, use real questions, real source data, and visible SQL. Test three to five real weekly questions. See if the SQL is visible, whether the numbers match the source of truth, and whether the tool says "I don't know" when data is missing. That test tells you more than any vendor demo.
FAQs
::: faq
How do I test answer quality before rollout?
Test answer quality with questions that have known, checked answers. Use your actual warehouse schema, not demo data, and make sure you can inspect and edit the SQL or Python behind every answer.
Also confirm:
- Read-only access
- Scoped table and column permissions
- Query logging
Start with one connected database and a small set of questions. If a vendor can’t explain what happens when the agent is wrong, don’t connect it to production. :::
::: faq
When does a semantic layer matter most?
A semantic layer matters most when your team shifts from passive dashboards to AI-driven analytics. It gives you trusted, central metric definitions, so AI doesn't rebuild core business logic in different ways.
Without that layer, teams often run into conflicting metrics or metric drift. When AI is tied to certified logic, the SQL it generates is more accurate, easier to audit, and in line with enterprise standards. :::
::: faq
Which option fits a warehouse-first team best?
For teams using Snowflake, BigQuery, Redshift, or PostgreSQL that want governed, reliable self-serve analytics, Querio is the best fit.
It lets business users ask plain-English questions and get SQL and Python they can inspect and edit. At the same time, a governed context layer keeps metrics and definitions consistent, portable, and transparent in your own Git repository. :::