Business Intelligence
AI for Self-Serve Analytics
AI-driven self-serve analytics lets nontechnical users ask plain-English questions, get instant charts and forecasts, and keep data consistent with semantic layers.
Tired of waiting days for reports? AI-powered self-serve analytics changes that.
With tools that let you ask questions in plain English, you can get instant insights without relying on IT. These platforms simplify data access for non-technical users, offering features like natural language queries, automated visualizations, and predictive analytics.
Here’s what you need to know:
Faster insights: What used to take days now takes seconds.
Cost-effective: Pricing starts as low as $14 per user per month.
Real-world examples: Companies like Bayer and Lumen have saved time and money while improving efficiency.
Core features: AI simplifies querying, builds instant charts, and forecasts trends.
Data quality: AI ensures consistent, accurate data with tools like semantic layers and monitoring.
If you’re looking to make decisions faster and reduce dependency on technical teams, AI self-serve analytics might be the solution.
How AI Enables Self-Serve Analytics
From Data Bottlenecks to Open Access
Moving away from IT-dependent reporting to self-serve analytics isn’t just a matter of convenience - it’s about democratizing access to data. Traditional business intelligence tools often required SQL expertise or assistance from IT teams, creating bottlenecks. AI changes the game by allowing anyone to use AI data analytics tools for non-technical users to ask questions in plain English and get instant, actionable answers.
Take Lumen, for example. In 2024, they adopted Querio's AI-powered analytics solution to automate their sales summary process. What used to take four hours per seller now takes just 15 minutes - a staggering 93.75% reduction in manual effort [2]. Similarly, Midwest Precision Manufacturing used Querio to gain real-time insights into equipment downtime, streamlining their data processes and saving around $45,000 annually [2]. These examples highlight how AI is reshaping data access and efficiency across industries.
Another standout is Agentic AI, which integrates multiple language models to interpret queries with over 90% accuracy while automatically correcting errors [1]. For instance, Bayer leveraged this technology to create a self-serve chat interface for their sales VPs. Executives can now ask questions like, “What was the market share of product X last month?” and instantly receive detailed, row-level data [1]. This kind of capability is a game-changer, enabling non-technical users to interact with data seamlessly.
Core AI Features for Self-Serve Analytics
AI-powered self-serve analytics breaks down barriers to data access by automating and simplifying the analysis process. Three standout features make this possible: natural language querying, automated visualizations, and predictive analytics.
Natural language querying transforms plain-English questions into precise code in real time, delivering immediate answers.
Automated visualizations take query results and instantly present them as charts or dashboards, making complex data easier to understand.
Predictive analytics goes a step further, using historical data to forecast trends and provide forward-looking insights.
Unlike static dashboards, AI-driven systems offer dynamic insights that adapt to your business context. Instead of spending hours manually building reports, businesses can rely on AI to manage context, ensuring consistent application of their terminology across all queries. This shift drastically reduces the effort required to maintain and interpret data while delivering insights that evolve with the business.
AI-Powered Tools and Techniques
Natural Language Querying
Natural language querying allows users to get instant answers without needing to understand SQL or Python. These systems rely on specialized agents that interpret user intent, generate accurate SQL queries, and even handle multi-turn conversations seamlessly [1][4]. By building a semantic layer that connects everyday business terms to the database structure, these tools can deliver around 90% accuracy for structured data queries [1][5]. For instance, after asking, "What were our sales in Q4?" users can follow up with "What about North America?" without having to restate the context. This feature makes it easier for non-technical users to explore data independently, furthering the goal of making analytics accessible to everyone.
A great example of this in action is Bayer’s implementation. Their executives can now ask questions like, "What was the market share of product X in the last month?" and get nearly instant responses. This eliminates the traditional wait time of days for dashboard updates [1][5].
"What if internal functional users could ask specific questions directly on their enterprise data and get responses back with basic visualizations? The core of this capability is high-quality responses to a natural language query on structured data, used in an operationally sustainable way." - Mukesh Dubey, Product Owner Data Platform, Bayer [1]
Beyond just answering questions, these systems also turn responses into actionable visuals, enhancing their usability.
Automated Data Visualization
Once a query is processed, AI tools take it a step further by automatically selecting the best visual format - whether it’s a bar chart, line graph, or table - to match the data structure [3]. Features like intelligent axis mapping ensure that dates are placed on the X-axis and numerical values on the Y-axis, resulting in polished, professional-grade visuals. On top of that, AI generates plain-English narrative summaries to explain the insights. For example, users might see a summary like, "Sales dropped 12% in Q3 in the Northeast", making it easier to interpret the data and act quickly [5][7]. These combined features simplify complex data analysis, helping users make informed decisions faster.
How AI Tools can Finally Solve the Self-Service Analytics Problem?
Maintaining Data Quality and Governance
When users have direct access to data, maintaining accuracy and consistency becomes crucial. Without proper controls, self-serve analytics can lead to conflicting reports, outdated dashboards, and inconsistent metrics. AI-powered platforms tackle these issues by combining semantic layers with intelligent monitoring to ensure data remains trustworthy and dependable. Let’s take a closer look at how semantic layers and AI-assisted monitoring safeguard data quality and governance.
Semantic Layers for Consistency
A semantic layer acts as a unified framework, standardizing business terms and database definitions to create a single source of truth. For example, instead of allowing different departments to define "Gross Margin %" in their own way, the calculation is codified once, ensuring every report, dashboard, and AI-generated query follows the same logic [12]. This approach eliminates discrepancies, such as sales and finance teams reporting conflicting numbers.
The impact of semantic layers is impressive. Generative AI accuracy improves significantly - rising from 16% to 54% - when semantic layers are implemented [13]. One automotive company even reported uncovering insights 21 times faster by adopting this method [13]. By ensuring uniformity, semantic layers enable quick and reliable insights, empowering non-technical users to confidently explore data.
"A semantic layer provides a bridge between the language of business and the language of data." - Mark Palmer, Board Member, AtScale [13]
While semantic and metrics layers focus on standardizing definitions, AI-assisted monitoring plays a critical role in maintaining ongoing data integrity.
AI-Assisted Data Monitoring
AI tools actively monitor data quality, spotting anomalies like unexpected traffic spikes or sudden drops using adaptive machine learning techniques [14]. These platforms also come equipped with built-in parsers to ensure AI-generated queries are syntactically correct before delivering results [10][11].
What’s more, some systems simplify the process of creating data quality checks. Instead of relying on complex scripts, users can describe their validation needs in plain English, and the AI translates these descriptions into executable rules [14]. Over time, these systems adapt as your data evolves, reducing the need for constant manual oversight.
However, human judgment is still vital. For instance, while AI can flag a sudden drop in sales, only a person can determine whether it’s due to a data error or an external factor like a store closure. To avoid overwhelming your team, it’s wise to start with a few critical datasets, building a scalable foundation for reliable self-serve business intelligence [6].
Benefits of AI-Powered Self-Serve Analytics
Adopting AI-powered self-serve analytics does more than just speed up reporting - it transforms how organizations interact with data. By removing technical barriers, these tools allow every department to make informed decisions quickly and confidently. Instead of relying on IT teams for data access, employees can get the answers they need instantly. This shift not only saves time but also enhances collaboration and reduces costs, creating a more agile and efficient workplace.
Faster, Data-Driven Decisions
Traditional analytics workflows often involve delays, but AI changes the game. With natural language querying, users can simply ask questions in plain English and receive answers in seconds - no need for SQL expertise.
Take Rippling, a workforce management platform, as an example. Before they had a dedicated data team, their sales and marketing teams used self-serve analytics to independently access metrics. This approach cut their time to insights in half [16]. Moreover, when insights are seamlessly integrated into tools like Slack or email, decision-makers can access critical data without interrupting their workflow. This is particularly important since around 70% of employees currently don't use data tools for decision-making [9].
Beyond just speed, these tools also enhance operational workflows, making organizations more efficient.
Higher Efficiency and Lower Costs
AI automation takes over repetitive tasks like generating weekly reports or extracting data, freeing up technical teams to focus on more impactful projects. Instead of being bogged down with routine requests, data teams can dedicate their time to improving infrastructure or building predictive models.
By enabling business users to create their own reports and visualizations, organizations can bypass the bottleneck of routing every request through a small data team [15][17]. This not only speeds up analysis but also reduces dependency on specialized staff, ultimately lowering costs.
This efficiency also fosters better teamwork and a stronger understanding of data across the organization.
Better Collaboration and Data Literacy
AI-powered analytics break down silos by providing shared, consistent data. When teams like sales, marketing, and finance operate from a unified semantic layer with standardized metric definitions, they can avoid conflicting reports [6][18]. Features like guided natural language querying further enhance data literacy, encouraging a workplace culture that values and understands data-driven decision-making [18].
The result? Teams spend less time arguing over numbers and more time taking meaningful action based on insights. This shift not only improves collaboration but also lays the groundwork for smarter, faster decisions across the board.
Selecting the Right AI Analytics Solution
Key Features and Benefits of AI-Powered Self-Serve Analytics Platforms
Picking the right AI analytics platform can feel overwhelming, but focusing on essential features of modern BI tools can make the process easier. The aim is to equip your team with a tool that delivers insights while maintaining accuracy, security, and control.
Evaluating Platform Capabilities
One key feature to look for is natural language querying. The platform should allow users - regardless of technical expertise - to ask questions in plain English and receive clear, actionable answers, not just vague summaries. For instance, Snowflake's Cortex Analyst achieves nearly 90% text-to-SQL accuracy [5], demonstrating the potential when AI is tightly integrated with your data.
Another must-have is a semantic layer. This ensures consistent definitions across the board, preventing misaligned reports and misinterpretations. As Orange Business explains:
"The semantic layer bridges the gap between raw data and actionable insights. It prevents misinterpretation by enforcing uniform definitions across all users and reports" [6].
Security and governance are equally important. Look for features like Role-Based Access Control (RBAC), data masking, and lineage tracking to protect sensitive information and comply with regulations like GDPR. Additionally, prioritize platforms with live data connectors for real-time insights, whether your data resides in Snowflake, BigQuery, or Postgres. This ensures that decisions are based on up-to-date information.
Other valuable features include support for multi-turn conversations (so users can ask follow-up questions), predictive analytics like forecasting and anomaly detection, and API integrations for embedding analytics into tools like Slack or Microsoft Teams.
For example, in July 2025, Siemens Energy launched an AI chatbot powered by Snowflake, granting 25 specialized R&D engineers instant access to insights from over 700,000 pages of documents. Tim Kessler, Head of Data, Models & Analytics at Siemens Energy, shared:
"This chatbot … has been a game changer for Siemens Energy. The ability to unlock and democratize the data hidden in our data treasure trove has given us a distinct competitive edge" [8].
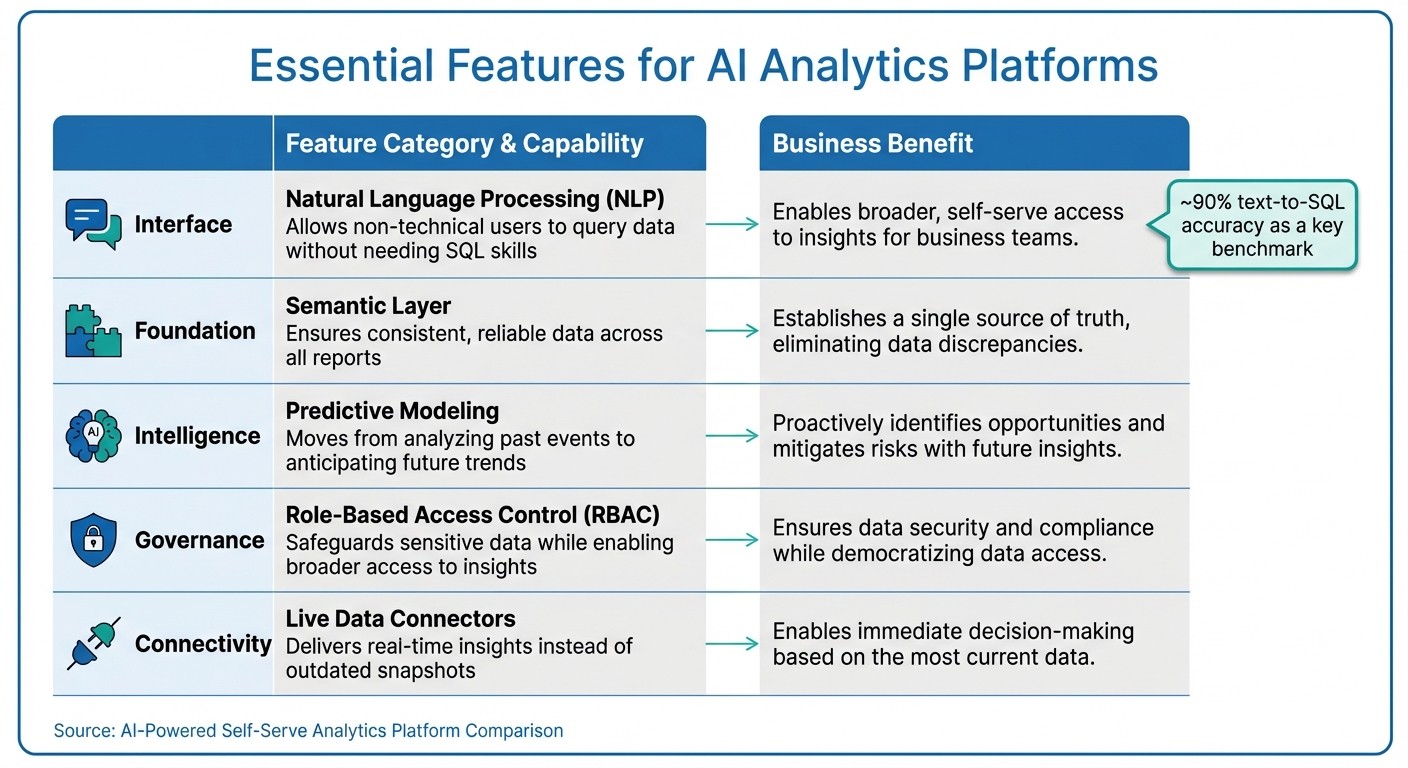
Here’s a quick breakdown of key features and their benefits:
Feature Category | Key Capability | Business Benefit |
|---|---|---|
Interface | Natural Language Processing (NLP) | Allows non-technical users to query data without needing SQL skills |
Foundation | Semantic Layer | Ensures consistent, reliable data across all reports |
Intelligence | Predictive Modeling | Moves from analyzing past events to anticipating future trends |
Governance | Role-Based Access Control (RBAC) | Safeguards sensitive data while enabling broader access to insights |
Connectivity | Live Data Connectors | Delivers real-time insights instead of outdated snapshots |
Once you’ve identified the right features, it’s time to focus on implementation.
Implementation Best Practices
A successful rollout starts with a phased approach. Begin by integrating a few critical datasets to secure quick wins and fine-tune the system. This not only demonstrates value early but also avoids overwhelming your team.
Establish clear data standards from the outset. Define formatting, naming conventions, and metric guidelines to maintain consistency. Create a certification process for semantic models so users can easily identify trustworthy data sources.
Training is another key step. Go beyond teaching the tool’s functions - train your team on how to ask effective questions and critically evaluate AI-generated results. Since AI outputs can vary, always include a human review to provide context and ensure accuracy.
Finally, separate data modeling from reporting. Let your central data team handle the core architecture, while business users focus on customizing their reports. This balance allows for strong governance while still enabling agile decision-making. Regularly review activity logs to monitor usage and refine governance policies as needed.
Conclusion
AI-driven self-serve analytics is reshaping how decisions are made. By removing IT bottlenecks, it allows non-technical users to access real-time insights through simple, conversational queries. This shift moves away from static dashboards, enabling teams to explore data dynamically without needing SQL expertise. The result? Faster identification of trends and the ability to test scenarios on the fly.
But it’s not just about speed. AI also brings consistency and better strategic planning to the table. Standardized semantic layers eliminate metric conflicts, while predictive analytics supports forward-looking decisions. With modern AI analytics achieving around 90% accuracy in text-to-SQL benchmarks [1][5], the reliability of this technology for critical business decisions is clear.
This is no longer a future concept - it’s happening now.
Querio is at the forefront of this change, offering an AI-native workspace that integrates seamlessly with your existing data warehouse. It provides secure, governed, and consistent analytics, all in real time. If you're looking to transform decision-making in your organization, Querio is ready to help you achieve faster and more collaborative insights.
FAQs
How does AI help ensure data quality in self-serve analytics?
AI plays a crucial role in improving data quality within self-serve analytics by automating the process of monitoring and refining datasets. Using machine learning, these systems can identify common problems like out-of-range values, duplicates, or schema mismatches and suggest ways to fix them - cutting down on the need for manual effort. Over time, they get smarter by learning from previous corrections, allowing them to catch more nuanced issues, such as shifts in data trends or mismatched units.
In self-serve analytics, AI-driven data checks are seamlessly integrated into the workflow. These systems validate data as it moves from its source to dashboards, enforce governance rules like role-based access or data masking, and flag potential problems with alerts or confidence scores. This ensures business users can trust their insights while maintaining consistent, high-quality data across the organization.
How does natural language querying benefit non-technical users?
Natural language querying (NLQ) lets anyone, even without technical expertise, interact with data using plain English. This means you don’t need to know SQL or navigate complex tools to uncover insights. Whether you're an executive or part of the frontline staff, NLQ makes it possible to explore and analyze data on your own, cutting down delays and reducing the need to rely on IT or data specialists.
By converting everyday language into database queries almost instantly, NLQ provides results like charts, tables, or forecasts in just seconds. This not only speeds up decision-making but also trims the time spent on repetitive manual tasks and helps lower operational costs. Plus, by presenting data in easy-to-understand formats, NLQ encourages collaboration and builds trust, enabling teams to act quickly and confidently on the most up-to-date information.
What role do semantic layers play in ensuring consistent data reporting?
Semantic layers simplify raw data by transforming complex tables into standardized, reusable definitions for metrics, dimensions, and relationships. This approach creates a business-friendly view of the data, making it easier for users to work with. By centralizing calculations - like revenue = price × quantity - and standardizing naming conventions, semantic layers ensure that everyone, whether building dashboards, running queries, or creating reports, relies on the same consistent logic. This consistency eliminates discrepancies in key metrics and provides a single source of truth for the entire organization.
These layers also include data dictionaries and governance rules that define how data is related, enforce standards, and integrate business rules directly into the model. Sitting between the data infrastructure and end-users, semantic layers shield analysts from schema changes while keeping definitions consistent across the organization. This enables accurate, reliable, and self-service reporting without requiring constant oversight.
Related Blog Posts


