Business Intelligence
Looker Studio vs Looker: The Confusion, Explained
Separate reporting tools from governed metric layers: use dashboards for reporting and a modeling platform for shared metrics.

My take: use Looker Studio for dashboards, Pro for shared report ownership, and Looker for shared metric definitions. Paying for Pro does not give you Looker’s LookML modeling layer.
Google renamed Data Studio in October 2022. That explains the similar names - not the same architecture. Here’s how I’d narrow your choice:
- Looker Studio: For Google Analytics, Ads, and other reporting needs.
- Looker Studio Pro: For organization-owned reports, team workspaces, and more delivery options.
- Looker: For shared revenue rules, database analysis, Git-based modeling, and data-access controls.
Quick Comparison
| Criteria | Looker Studio | Looker Studio Pro | Looker |
|---|---|---|---|
| Data connections | Google tools, BigQuery, and other connectors | Same reporting approach as Studio | Snowflake, BigQuery, Redshift, and other databases |
| Metric definitions | Fields, formulas, and upstream data | Same as Studio; no LookML layer | Central LookML definitions |
| Ownership and access | Asset sharing and source credentials | Organization ownership and workspace roles | Roles, model permissions, and data controls |
| Editing and delivery | Visual editing and scheduled reports | Team workspaces and more delivery options | Git-based models, dashboards, and scheduled delivery |
| Price | Free standard offering | Monthly per licensed user, including unused licenses | Quote-based platform and user fees |
| Upkeep | Reports, sources, and formulas | Reports, sources, and workspaces | Models, permissions, and platform administration |
I’d compare total cost, not just license fees: include connectors, warehouse queries, training, and maintenance. If you use both tools, the Looker connector lets Studio use LookML-defined metrics; a direct BigQuery connection does not.
Before buying, I’d test one marketing dashboard and one shared revenue metric, check viewer access, and match revenue against Finance’s approved query. For live Snowflake or BigQuery analysis with SQL/Python and a semantic layer, the article also considers Querio.
::: @figure 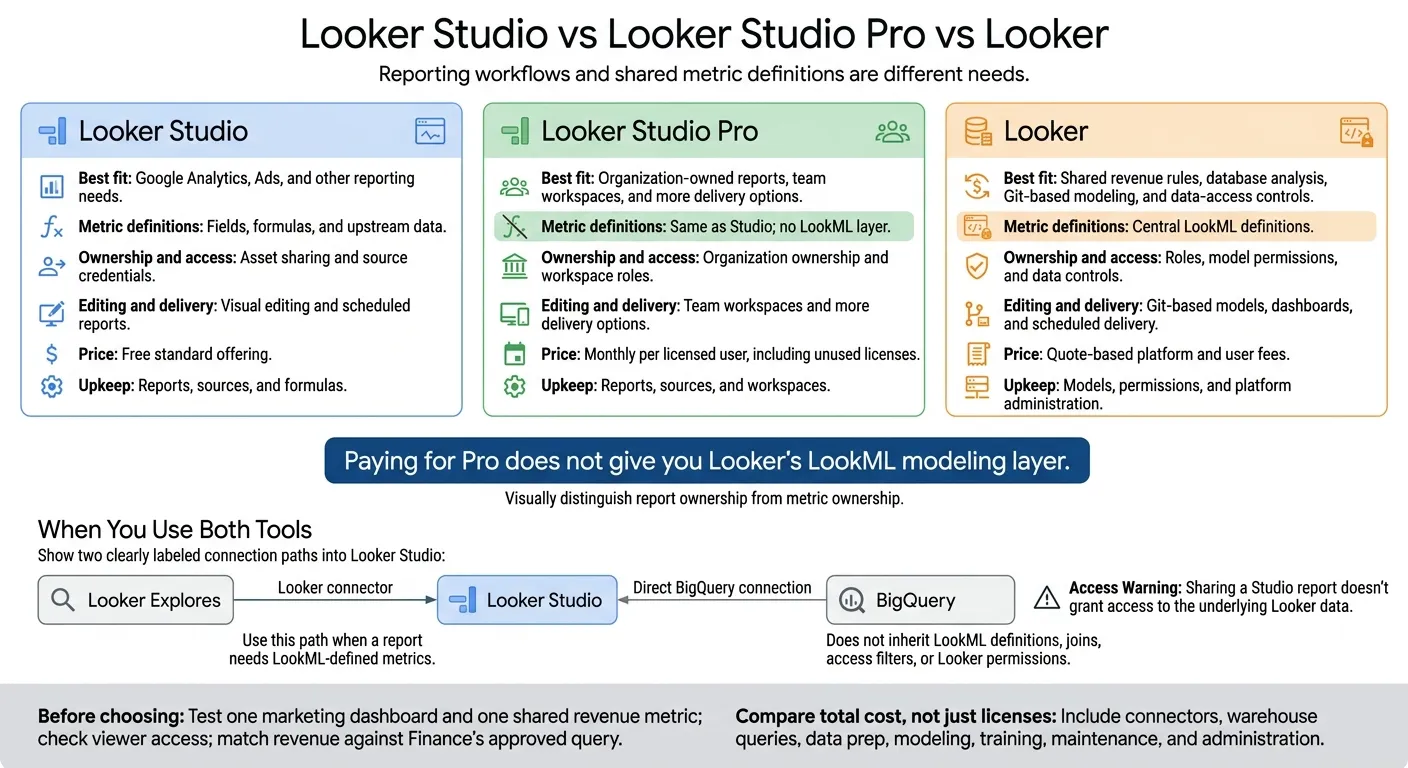 {Looker Studio vs Looker Studio Pro vs Looker}
:::
{Looker Studio vs Looker Studio Pro vs Looker}
:::
Understanding and unifying Looker and Looker Studio
::: @iframe https://www.youtube.com/embed/bUh5cGOSoaM :::
Looker Studio vs Looker: Features and Costs
The main difference is how each tool manages metrics. Looker Studio focuses on reporting, while Looker gives teams central control over metric definitions.
| Area | Looker Studio: Reporting | Looker: Centralized LookML Governance |
|---|---|---|
| Purpose | Reports and dashboards | Governed data exploration, reusable metrics, and enterprise BI |
| Connections | Connectors for Google Analytics, Google Ads, Google Sheets, BigQuery, and other supported sources | Database connections to Snowflake, BigQuery, Amazon Redshift, PostgreSQL, and other sources |
| Modeling | Data-source settings, calculated fields, aggregations, and blends | LookML dimensions, measures, joins, and Explores |
| Metric governance | Relies on managed sources, upstream definitions, and team standards | Central definitions reused across Explores and dashboards |
| Permissions | Report and data-source sharing, plus credential settings | Roles, model permissions, content access, and data-access controls |
| Version control | Visual report editing, rather than Git-based model development | Git-based LookML development, review, and deployment |
| Reporting | Shareable dashboards and scheduled reports | Dashboards, Explores, scheduled delivery, and embedded analytics |
| Pricing | Free standard offering; paid Looker Studio Pro subscription | Quote-based platform and user licensing |
| Implementation effort | Lower for simple reports, though connectors and data prep still matter | Higher: teams must set up connections, build and test models, manage permissions, and administer the platform |
Data Connections and Metric Definitions
A Looker Studio connector links a report to a source. The data source stores the selected tables, fields, credentials, and field settings.[7][9] Looker Studio calculated fields handle report-level formulas, while LookML defines reusable dimensions, measures, and joins in Explores.[17]
Upstream dbt models can standardize warehouse data. But they don’t automatically control formulas in downstream reports or provide LookML’s controlled data exploration.
Permissions and Metric Ownership
Report access isn’t the same as source access. Owner’s credentials let viewers see data using the report owner’s access. Viewer’s credentials require each viewer to authenticate and have access to the source.[8][10]
Looker uses permission sets and model sets to separate what users can do from which models they can access. When configured, user attributes and access filters can limit the records users see.[15][17]
Give each critical metric an owner, and require a review before changing its definition. Looker supports Git-based LookML development.[16][18] Looker Studio teams need review procedures for formulas and data sources. Finance and healthcare teams should also validate identity controls, audit trails, row-level access, residency, retention, and compliance requirements.
Pricing and Maintenance
Looker Studio is free. Looker Studio Pro bills monthly per licensed user, including unused licenses.[12] Looker uses quote-based platform and user licensing, which you can compare with Querio.[11][14]
The price also needs to account for connectors, warehouse queries, data prep, modeling, training, and administration. Estimate query usage and assign maintenance owners before comparing proposals.
For teams sharing reports, the pricing comparison also depends on how much governance Pro adds.
Looker Studio Pro and Shared Reporting Workflows
What Looker Studio Pro Adds
Looker Studio Pro adds organization-owned content and shared workspaces, not a metric modeling layer. Reports and data sources remain tied to the organization’s Google Cloud project.[13][20][21]
| Capability | Looker Studio | Looker Studio Pro |
|---|---|---|
| Ownership | Tied to creator | Organization-owned via Google Cloud project |
| Roles | Report and data-source sharing | Manager, Content Manager, and Contributor workspace roles |
| Access | Granted per asset | Role-based workspace access |
| Delivery | Standard scheduled delivery | Higher delivery capacity and Google Chat delivery |
Workspace roles separate member administration from content management and editing.[6] Pro helps teams distribute reports and maintain continuity, but it doesn’t govern metric definitions.
With ownership settled, teams still need to decide where metric logic belongs.
How Looker Studio and Looker Work Together
When teams use both products, a clear division of work matters more than the brand name.
Looker Studio can read prepared BigQuery tables or connect to Looker Explores through the Looker connector. Use the connector when a report needs LookML-defined metrics or when you want to use AI in Looker to enhance analysis. A direct BigQuery connection doesn’t inherit LookML definitions, joins, access filters, or Looker permissions.[19][15]
The connector requires specific Looker permissions: explore to create a data source, access_data to view data, and clear_cache_refresh to refresh it.[22][23] Test access with both viewers and editors. Sharing a Studio report doesn’t grant access to the underlying Looker data.
If LookML or governed warehouse tables hold the source of truth, Looker Studio should use those definitions - not recreate them. Document each KPI’s source, definition, filters, and refresh cadence.
Keep metric logic in LookML or governed warehouse tables. Put the data owner in charge of source credentials and the workspace manager in charge of report sharing.
Which Product Fits Your Team’s Needs?
Marketing Dashboards vs Cross-Team Revenue Metrics
Choose based on what needs to stay consistent - not company size alone. These hypothetical scenarios for teams with 100–500 employees can help you narrow the choice.
Apply the earlier split - Looker for metric logic, Looker Studio for reporting - and consider who will own and maintain each setup.
Hypothetical need Product fit Decision point A 150-employee SaaS company needs Google Analytics and Google Ads reporting. Looker Studio Use native connectors when you don’t need centralized modeling or complex joins.[25][26] A 250-employee company needs organization-owned reports. Looker Studio Pro Use shared ownership to prevent orphaned reports. A 400-employee B2B SaaS company needs Finance and Sales to agree on ARR, churn, and retention. Looker Store shared definitions in LookML.[25][26] A 300-employee finance company needs managers to explore governed warehouse data. Looker Use Looker Explores for governed self-service analysis.
Dashboard access isn’t the same as governed self-service. Finance should own the definitions of ARR, churn, and retention before the data team encodes them in LookML.
Check Ownership, Access, and Team Capacity
Once the use case is clear, decide who owns each metric definition, who needs access, and whether your team can maintain LookML over time.
Choose based on governance and upkeep, not setup speed. LookML needs someone to take ownership and keep it maintained.[25]
For governed warehouse analysis, the decision shifts from how you build dashboards to where your definitions live.
Governed Warehouse Analysis With Querio
Querio fits teams that want governed self-service analysis over live Snowflake or BigQuery data. It offers inspectable SQL/Python and a semantic context layer rather than black-box logic.[24][26]
Conclusion: Reporting and Metric Governance Are Different Needs
Your choice depends on whether you need reporting workflows or governed metric ownership. Use Looker Studio for reporting, Looker Studio Pro for organization-owned reporting workflows, and Looker for governed analysis with shared LookML metrics. You can also leverage Looker AI features to simplify complex modeling tasks. Pro does not add a modeling layer.
If your team uses both tools, keep metric definitions separate from presentation. Give each metric an owner, set approval steps, and test access in both tools.
Before choosing, run a small live test in both workflows using one marketing dashboard and one shared revenue metric. Compare revenue results across departments against Finance’s approved query.
Track maintenance hours, name maintenance owners, and compare total costs: licenses, connectors, warehouse queries, modeling, and administration. Choose the setup that passes your tests - not the one with the cheapest subscription.
FAQs
::: faq
When do we need a centralized modeling layer?
You need a centralized modeling layer when teams and reports must use consistent metrics under shared rules. Without one, teams may calculate KPIs like revenue or active users differently. The result? Conflicting numbers and reporting you can’t rely on.
This layer establishes a single source of truth for business logic. It also automates row-level security and access controls, makes data logic available for inspection and audits, and keeps metric definitions from drifting apart as analytics grows. :::
::: faq
How can we migrate reports without changing KPI definitions?
Use a centralized, governed semantic layer as your single source of truth [1][2][3]. Looker Studio doesn’t have a native semantic layer. Rebuilding metric logic in separate dashboards can cause metric drift, leaving teams with different definitions of the same metric [2].
Choose platforms that import or reference existing logic, such as LookML or dbt YAML [4][5]. Keep business logic version-controlled in that layer, not in individual reports. This keeps dashboards, notebooks, and AI-generated queries aligned with established KPI definitions [2][3][5]. :::
::: faq
How should we estimate warehouse query costs?
Use your current query patterns in BigQuery or Snowflake to estimate future usage. When budgeting for platforms like Looker, look beyond license fees: query volume, data processed, and user count all affect costs [1][2].
Your total cost of ownership should include implementation, dedicated modeling staff, warehouse compute, and the platform subscription. Ask for a total cost estimate based on 3× your current headcount to account for growth [1][2]. :::