Business Intelligence
How to Consolidate 4 Analytics Tools into One Platform
Audit workflows, govern metrics, test side-by-side, and migrate dashboards, SQL, notebooks, and reports to one warehouse platform.

Yes - you can often move dashboards, SQL work, notebook analysis, and recurring reports into one warehouse-connected platform. But I’d only do it when all four use the same warehouse and the same metric definitions.
Here’s the short version: if your team uses one tool for dashboards, another for SQL, another for notebooks, and a mix of Slack or email for reports, the main problem usually isn’t reporting. It’s metric drift, ownership gaps, and too many handoffs. The article’s core message is simple: audit workflows first, govern metrics with a semantic layer first, test side by side, and retire tools last.
A few numbers make the point fast:
- In a 2025 Datalogz survey, more than two-thirds of analytics leaders tied BI sprawl to governance, security, and data-volume issues.
- In a 2025 Modern Data Company report, 70% of data teams said they manage 5 to 10 tools daily.
- That same report found 63% spend more than 20% of their time on maintenance.
If I were summarizing the article for a team, I’d put it this way:
- Move into one platform: dashboards, ad hoc SQL, notebook-style analysis, scheduled reports, threshold alerts, and metric-based anomaly alerts
- Keep outside: dbt, Airflow/Prefect/Dagster, ML training and experiment tools, infra monitoring, and some regulated reporting
- Check before migration: metric parity, SQL inspectability, warehouse load, schedule reliability, role-based access, and content labels like draft vs. certified
- Migrate in order: pilot first, parallel test next, then retire old assets only after sign-off
- Judge success by workflow: not by vendor count, feature lists, or license price alone
::: @figure 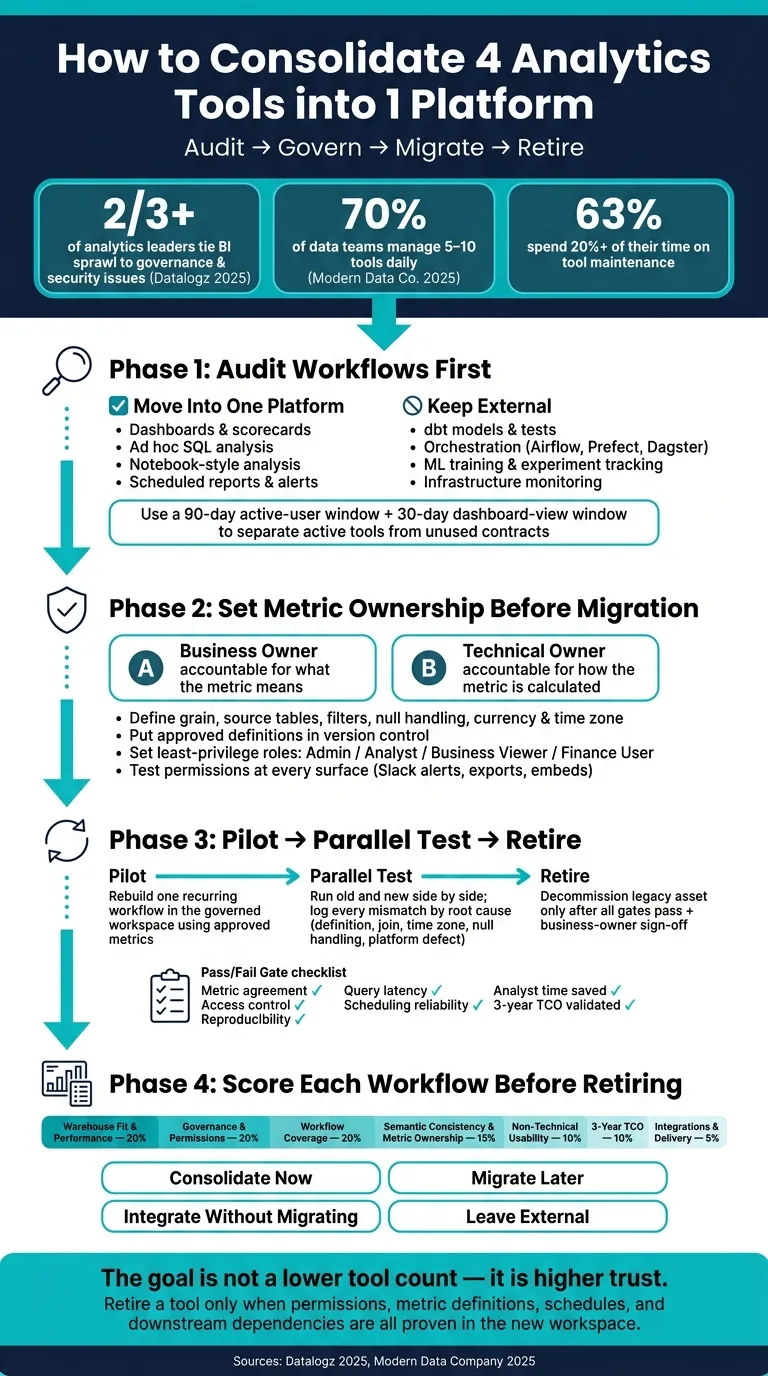 {How to Consolidate Analytics Tools: Audit, Govern, Migrate, Retire}
:::
{How to Consolidate Analytics Tools: Audit, Govern, Migrate, Retire}
:::
How Rivian Consolidated Its Analytics Platform with Hex and Databricks
::: @iframe https://www.youtube.com/embed/Kn4oeG78u3U :::
Quick comparison
| Area | Move into one platform? | What I’d verify first |
|---|---|---|
| Dashboards and scorecards | Yes | KPI matches, filters, permissions, refresh timing |
| SQL analysis | Yes | SQL is visible, editable, saved, and tied to a named user |
| Notebook analysis | Yes | SQL/Python steps rerun cleanly and use approved data |
| Reports and alerts | Yes | Schedules, retries, recipients, access, delivery logs |
| dbt models and tests | No | Keep version control and model testing outside |
| Orchestration | No | Keep multi-system pipelines outside |
| ML work | No | Keep training and experiment tracking outside |
| Infra monitoring | No | Keep system and pipeline checks outside |
The article also makes one point I agree with: a lower tool count means nothing if trust drops. I’d rather keep one extra tool than move a bad workflow into a new system and repeat the same metric fights in a new place.
So if you want the cleanest takeaway, here it is:
- Audit what people do
- Set metric owners using a governed semantic layer
- Map each workflow to one governed home
- Run old and new side by side
- Score each workflow on fit, control, coverage, and 3-year cost
- Retire only after proof
That’s the path to cutting tool sprawl without making reporting harder to trust.
Audit your current stack before you migrate anything
Audit workflows before migration so you know which dashboards, SQL jobs, notebook analyses, and reports belong in one platform and which do not.
Before you touch a single dashboard or retire a single tool, get clear on what your stack actually does. That sounds obvious, but this is where many teams get surprised. The analytics setup on paper often looks neat. The one people use every day usually does not.
Most teams find a messier footprint than they expected: shadow deployments, workflows with no owner, and duplicate metric definitions that no one planned for. That’s why the inventory matters. Use it to map each workflow into a single governed workspace before you retire anything.
Build a workflow inventory, not a product list
Tool names matter less than the workflows they support. For each workflow, capture:
- The trigger
- The question it answers
- The source data
- The metric definition
- The owner
- Any manual steps
That hidden labor costs time and money. It also tells you where consolidation makes sense.
Keep the focus on the four work types consolidation usually targets: dashboarding, SQL analysis, notebook work, and recurring reporting.
Then reconcile three records before you decide anything: what Finance pays for, what IT provisions, and what users actually use. These almost never match. A 90-day window for active-user analysis and a 30-day window for dashboard views are practical starting points for separating active tools from tools that are simply still under contract. [2]
Use a stack-inventory table to find overlap and retirement candidates
Once you have the workflow descriptions, put them into one table. The point is simple: spot duplication, find workflows with no owner, and flag cases where the same KPI is calculated differently across tools.
Old reports are often the first things you can retire, but only after you confirm they are not tied to regulatory or executive needs.
| Workflow | Current tool | Problem discovered | Likely action |
|---|---|---|---|
| Daily health check | BI dashboard | Three dashboards show different "net revenue" figures; finance owns the authoritative definition | Rebuild one governed dashboard and retire duplicates |
| Weekly sales-pipeline review | SQL editor plus spreadsheet | Analyst manually exports opportunity data and reconciles stages every Monday | Migrate the query and metric logic; automate the recurring output |
| Product adoption investigation | Notebook | Used by two analysts once per quarter; contains valuable exploratory code but no production dependency | Keep external unless it clearly belongs in the governed workspace |
| Monthly executive report | Reporting workflow | Depends on a scheduled export and manual slide updates | Recreate the certified metrics and automate distribution |
| Customer-level operational alert | External monitoring system | Requires real-time event processing and paging integration not supported by the BI platform | Keep external and link its output to the governed analytics workspace |
Retire or rebuild any workflow with no named owner or with conflicting metric definitions across tools. That inventory becomes the input for mapping each workflow into one governed platform.
Map your old tools to one governed workspace
Use the stack inventory from the last section to map each workflow to one governed home. Then check that mapping before you retire any tool.
Keep Snowflake, BigQuery, Redshift, or Postgres as the source of truth. Use the platform as the governed layer for questions, SQL, Python, visualizations, boards, and delivery.
Side-by-side mapping: dashboards, SQL editors, notebooks, and reporting workflows
Treat this as a function-to-function exercise, not a brand swap. Every tool in your stack has a job. The real test is simple: can one governed workspace do that same job, with clear lineage back to the warehouse query?
| Old-tool function | One-platform equivalent | Validate before retiring |
|---|---|---|
| Looker or ThoughtSpot dashboards | Boards built from governed notebook outputs, charts, tables, and narrative context | Reconcile key totals, filters, drill paths, refresh times, and permissions with the legacy dashboard |
| Warehouse SQL editor | Inspectable SQL cells inside a reactive notebook, connected live to the warehouse | Confirm that generated SQL is visible, editable, runnable against the intended warehouse, and attributable to a named user |
| Hex-style SQL and Python workflows | Reactive notebooks combining SQL and Python cells with automatic recomputation | Reproduce representative analyses, preserve dependencies and parameters, and verify that Python results use approved data |
| Scheduled reports and anomaly alerts | Automations delivered through Slack, Microsoft Teams, email, or embedded app surfaces | Test schedules, retries, recipient access, formatting, links, access controls, and delivery history |
Start by matching the function. After that, prove the output, permissions, and delivery all work the way they should.
Reactive notebooks recompute downstream cells automatically when upstream SQL changes.
Users can trace a board back to the notebook and warehouse query behind it. That keeps the output explainable instead of opaque.
Self-serve access should follow that same governed path. Every answer inherits the approved metric definitions in the context layer.
What to check before calling the stack truly consolidated
Feature parity alone doesn't cut it. You need to test how the workspace behaves with live warehouse data, real permissions, and actual schedules.
Before retirement, validate:
- Metric parity: Do critical KPIs return the same result in the new workspace as in the old tool, using identical dates, filters, time zones, and data snapshots? Test a normal month, a month with late-arriving data, and a period with refunds or corrections.
- Query inspectability: Can users open, edit, save, and rerun the SQL or Python behind every answer? If the platform generates SQL that analysts can't inspect or modify, it's not a safe replacement for a warehouse SQL editor.
- Warehouse performance: Do queries meet agreed response-time limits under realistic concurrency? Notebook interactivity shouldn't overload production workloads.
- Scheduling reliability: Do automations run at the correct local time, retry on failure, notify owners when something breaks, and log delivery history?
- Permission inheritance: A metric that is secure in the main application is not governed if it becomes visible through a Slack alert, an exported file, or an embedded page. Test permissions at every surface.
- Trust labels: Is draft, reviewed, and certified content clearly distinguished? Business users and executives should never have to guess whether a board reflects approved definitions or an analyst's exploratory work.
Reports unopened for 12 months are retirement candidates, not migration candidates. [1] Put your validation effort where it matters most: the dashboards and reports that drive decisions. And make sure every certified output has a named business owner before you decommission its legacy equivalent.
Handle governance and migration sequencing before you decommission anything
Governance comes first. If you skip it, you just move the same metric fights into a new tool. Use the workflow inventory from the previous section to spot which metrics need governance before anything else.
Define metric ownership, permissions, and semantic context first
Start with the metrics that drive decisions: revenue, churn, active customers, pipeline, and claims volume. These are usually the ones with clashing definitions spread across different tools. Before you rebuild any of them, assign two owners to each metric:
- a business owner who is accountable for what the metric means
- a technical owner who is accountable for how the metric is calculated
Write down the grain, source tables, filters, null handling, currency, and time zone for every certified metric. Put the approved definition in version control so any change goes through named review before it shows up in dashboards, notebooks, or reports. That step is what makes one platform reliable for certified dashboards, ad hoc SQL, reactive notebooks, and scheduled reporting.
Permissions need the same level of care. Start with least-privilege roles: platform administrator, analyst, business viewer, and finance user. Then test what each role can do. Can they only view data, or can they also query, export, schedule, and publish?
A dashboard filter is not access control. If a metric is blocked in the main workspace but still shows up in a Slack alert or an exported file, it is not governed.
For fintech and healthcare teams, check row-level and column-level restrictions too. Fields like Social Security numbers, bank account details, or protected health information need masking at the data layer, not just hidden columns in a chart. For healthcare workloads, confirm that the platform supports a BAA before any PHI is processed.
Once those definitions are approved, map them to the governed workspace in the next step.
Migrate in phases: pilot, parallel test, then retire
Pick one recurring workflow with clear business value and a measurable output. A daily business-health review or a weekly revenue investigation usually works well because the output is frequent, visible, and easy to compare. Rebuild it in a live warehouse-connected notebook, use the approved metric definitions, publish it as a governed output, and run it side by side with the legacy version.
Then compare the two outputs, log every mismatch, and tag the root cause. Don’t wave off a rounded percentage as “close enough.” Put each gap into a clear bucket: definition difference, join duplication, time zone conversion, null handling, or a platform defect.
Before the pilot moves into broader migration, it should clear explicit gates. User preference alone is not enough.
| Pass/fail criterion | What to verify |
|---|---|
| Metric agreement | Critical totals match within documented tolerances; finance-controlled figures match exactly |
| Access control | Restricted rows, columns, and conversations are invisible to unauthorized roles at every surface |
| Reproducibility | A second analyst can rerun the analysis and get the same result |
| Latency | Queries complete within the agreed service window under realistic concurrency |
| Required functions | The platform supports required queries, notebook steps, visualizations, scheduling, alerts, comments, and distribution |
| Reliability | Scheduled jobs complete successfully and failures generate actionable notifications |
| Analyst time saved | Measure preparation and publishing time before and after |
| Operating cost | Include licenses, warehouse consumption, storage, implementation, support, training, and the cost of keeping legacy jobs alive |
If a pilot fails a security or governance gate, it should not move forward just because people like the interface more.
After the pilot passes, move from low-risk workflows to high-risk ones. Start with unused or duplicate assets. Then move to low-sensitivity departmental reports. Leave executive, financial-close, or regulated workflows for last.
Retire legacy assets only after the replacement clears every gate, downstream dependencies are cleared, and retention rules are confirmed. Use those same gates to score the remaining workflows in the decision framework below.
A decision framework for what stays, what goes, and what the business gains
Score consolidation on warehouse fit, governance, workflow coverage, and total cost
After the pilot is validated, use a single scorecard to decide which workflows should move into the governed workspace and which should stay outside it. Only use this scorecard after a workflow has already passed validation, access, and reproducibility checks.
| Criterion | Suggested weight | What to verify |
|---|---|---|
| Live warehouse fit and performance | 20% | Supported warehouse, live-query speed, concurrency, caching, large-table handling, row-level security, and data write-back |
| Governance and permissions | 20% | SSO, MFA, role-based access, masking, audit logs, workspace separation, and sharing controls |
| Workflow coverage | 20% | Dashboards, editable SQL, notebook-style analysis, alerts, and scheduled delivery |
| Semantic consistency and metric ownership | 15% | Certified metrics and semantic layers, lineage, versioning, named owners, and approval workflows |
| Non-technical usability | 10% | Natural-language questions, discoverability, documentation, and non-technical usability |
| Integrations and delivery | 5% | Slack, Teams, email, and embedded analytics |
| 3-year TCO | 10% | Licenses, compute, migration, training, administration, support, and parallel-run cost |
Score each criterion on a 1-to-5 scale, multiply that score by the weight, and add up the total. If a platform fails required security, compliance, warehouse, or performance needs, reject it no matter how high the total score looks.
Once the scorecard is filled in, cost becomes just one input. It should not make the decision on its own. And when you review cost, don’t stop at the subscription fee.
3-year TCO = licenses + compute + implementation + migration + training + administration + support + parallel-run cost
That formula gives you a much clearer picture of what the move will actually cost over time. A tool that looks cheaper at first can get expensive fast once migration work, admin time, and side-by-side operating periods are added in.
Use the scorecard to sort each workflow into one of four buckets:
- consolidate now
- migrate later
- integrate without migrating
- leave external
Keep dbt, orchestration, and ML environments external when they serve a different job. Not every tool needs to be pulled into one place. Sometimes the smarter move is to connect systems, not replace them.
Conclusion: cut tool sprawl without weakening analytical rigor
The point of consolidation is simple: give teams one governed place to ask questions, dig into metrics, and share trusted outputs without extra handoffs or ongoing upkeep.
A 2025 report from The Modern Data Company found that 70% of data teams manage between five and ten tools daily, and 63% spend more than 20% of their time on maintenance. [3] [4] That maintenance burden is the part that hurts. It’s the hidden tax behind tool sprawl, and it’s exactly what a good consolidation effort should cut. You should see that in analyst hours saved, fewer duplicate dashboards, lower license spend, and fewer metric discrepancies.
But trimming the stack only helps when four things get better at the same time: warehouse fit, governance, workflow coverage, and user trust. Audit workflows before moving anything. Validate outputs side by side against the warehouse. Keep dbt and other transformation tools where they belong. And don’t retire a legacy tool until permissions, metric definitions, scheduled reports, and downstream dependencies have all been proven in the new setup, with business-owner sign-off to confirm it.
With the scorecard in place, the final call should favor trust, coverage, and ownership over a lower tool count. When those pieces line up, consolidation cuts overhead, reduces handoffs, and gives the team one governed workspace for trusted answers.
FAQs
::: faq
When should you not consolidate into one platform?
Don’t consolidate work that depends on special setups, like model training, heavy scientific or geospatial libraries, or long-running jobs that need a dedicated Python runtime.
It’s also a bad fit when no one owns the metric definitions, or when a move would disrupt stable, high-signal executive dashboards. Keep those core views in place, and use a unified platform for ad hoc questions and self-serve analysis. :::
::: faq
How do we prove metric parity before retiring old tools?
Run a parallel pilot and compare outputs line by line across the old and new systems.
Start by importing your current definitions, such as dbt or LookML, into the new platform’s semantic layer. That way, both tools run on the same logic from day one.
Then track 10 recurring metrics each week. Log every mismatch, and trace each one back to the source. If a number is off, find out why before moving on.
Only retire legacy assets after results, performance, and adoption stay aligned over time. :::
::: faq
What should stay outside the unified analytics platform?
Some work still belongs in external tools, especially jobs that go beyond analytics. That includes model training, long-running compute tasks, and scientific or geospatial research that needs a specific Python runtime, pinned environments, or more advanced version control.
It also makes sense to keep external infrastructure when your data lives only in spreadsheets or SaaS apps and there’s no supporting data warehouse behind it. The same goes for cases where you need a highly customized embedded product SDK, or you already rely on a large partner and consulting ecosystem. :::