Business Intelligence
Best Tableau Alternatives for AI-Native Analytics (2026)
Compare seven AI-native Tableau alternatives for governed, warehouse-native analytics and self-serve teams.

If I had to boil it down fast: the top Tableau alternatives in 2026 are Querio, Power BI, Looker, Sigma, Hex, ThoughtSpot, and Mode. Each one leans toward a different kind of team: some focus on governed metrics, some on plain-English search, and some on SQL/Python work on live warehouse data.
The article’s main point is simple: dashboards alone are no longer enough. Teams now want tools that can:
- answer questions in plain English
- keep metric definitions consistent
- query live warehouse data without extracts
- let business users self-serve without pulling analysts into every request
That shift matters because the BI market is projected to hit $37.96 billion in 2026, and cloud tools now make up more than half of that market.
Here’s the short version of who each tool fits best:
- Querio: governed self-serve analytics on live warehouse data
- Power BI: Microsoft-first teams that want lower seat cost
- Looker: teams that want code-based metric control
- Sigma: spreadsheet-style analysis on warehouse data
- Hex: notebook-first teams working in SQL and Python
- ThoughtSpot: search-led analytics for business users
- Mode: analyst-heavy teams that live in SQL and Python
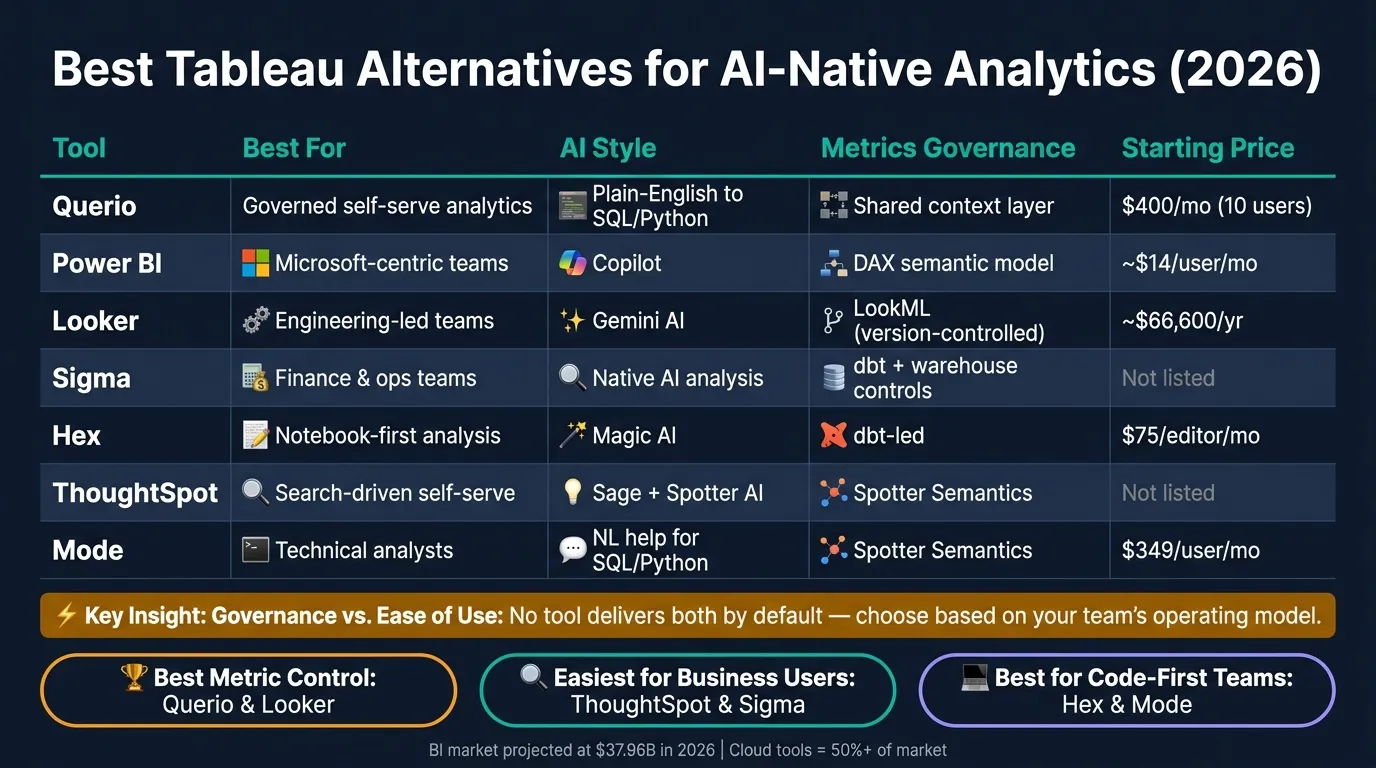
Quick Comparison
| Tool | Best For | AI Style | Metrics Governance | Live Warehouse Access |
|---|---|---|---|---|
| Querio | Governed self-serve analytics | Plain-English to SQL/Python | Shared context layer | Yes |
| Power BI | Microsoft-centric teams | Copilot | DAX semantic model | Yes |
| Looker | Engineering-led teams | Gemini | LookML | Yes |
| Sigma | Finance and ops teams | Native AI analysis | dbt + warehouse controls | Yes |
| Hex | Notebook-first analysis | Magic AI | dbt-led | Yes |
| ThoughtSpot | Search-driven self-serve | Sage + Spotter AI | Depends on modeled data | Yes |
| Mode | Technical analysts | AI help in SQL/Python | Spotter Semantics | Yes |
My read: if you care most about metric control, tools like Querio and Looker stand out. If you care most about ease for business users, ThoughtSpot and Sigma are more aligned. And if your team works in notebooks and code every day, Hex or Mode will likely make more sense.
The rest of the article breaks down those tradeoffs in plain terms so you can match the tool to how your team actually works.
1. Querio
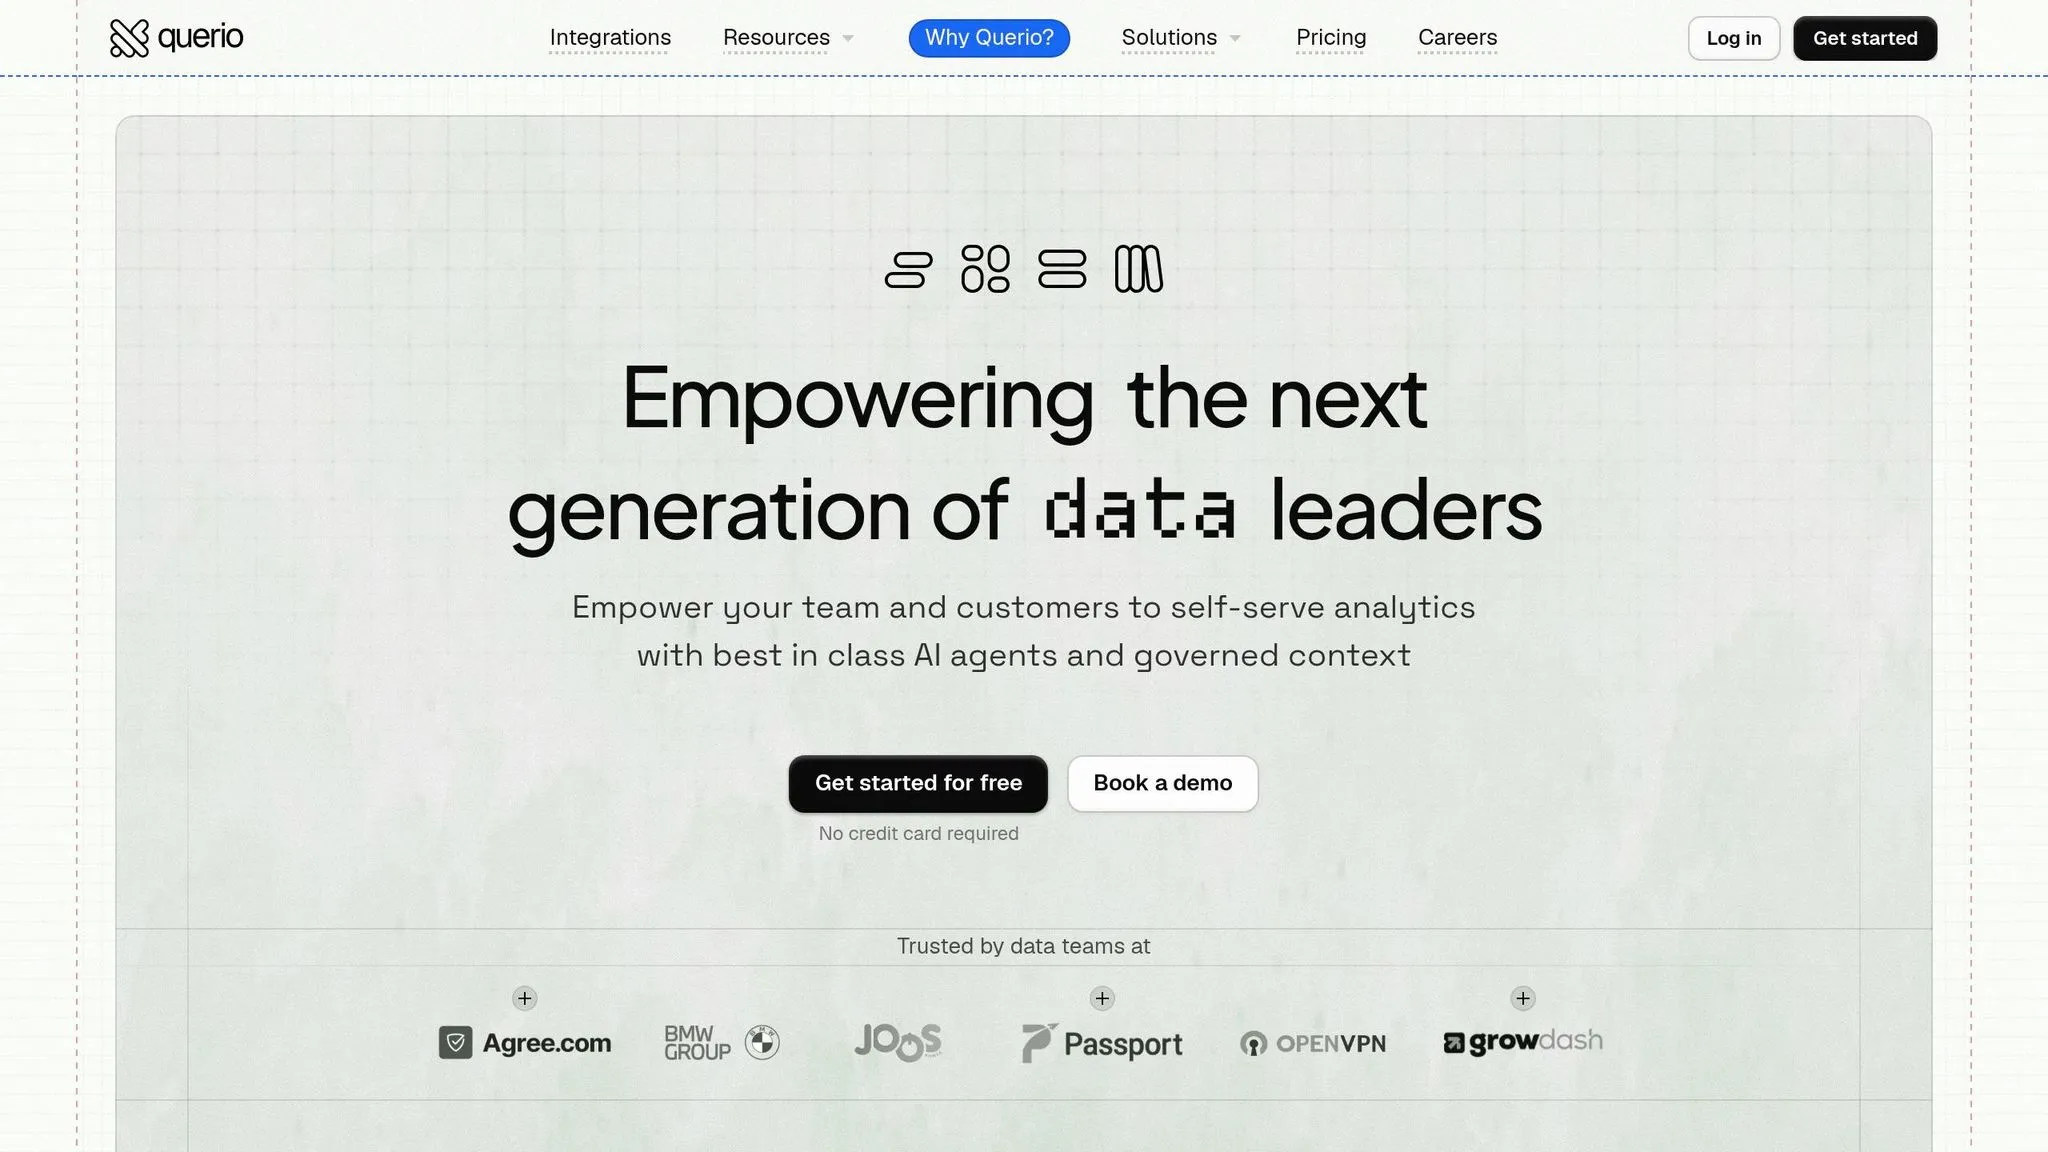
Querio is an AI-native analytics workspace for data teams that want governed, warehouse-native self-serve analytics. It connects to Snowflake, BigQuery, Amazon Redshift, ClickHouse, and PostgreSQL, then lets business users ask questions in plain English.
The big idea isn't just that you can type a question instead of writing SQL. It's that the work still runs inside a governed setup.
AI Workflow Depth
Querio's AI agents turn plain-English questions into SQL and Python, then show the results in reactive notebooks. Every answer is backed by actual SQL or Python, which means analysts can inspect the logic, edit it, and see what's happening under the hood instead of taking a black-box answer at face value.
That same level of control also applies to metrics and business definitions.
Semantic Metrics Governance
Querio's governed context layer defines joins, metrics, and business terms one time, then uses them across queries, notebooks, dashboards, and AI answers. So if your team has ever dealt with three versions of the same metric floating around, this setup helps keep everyone on the same page.
Warehouse-Native Execution
Querio queries live warehouse data directly with encrypted, read-only credentials. There are no extracts or copied datasets. The analysis stays on live warehouse data in Snowflake, BigQuery, Redshift, ClickHouse, or PostgreSQL.
For teams that want governed analysis without moving data out of the warehouse, that's a pretty big deal.
Self-Serve Collaboration
Business users can ask questions in a web UI or Slack, while analysts keep control through the governed context layer. Dashboards and scheduled reports can reuse notebook outputs, and teams can embed the same self-serve analytics logic through APIs and iframes.
Querio has a free plan, and Core is $2,499/month (or $25,000 a year billed annually), with unlimited users on every plan.
2. Microsoft Power BI
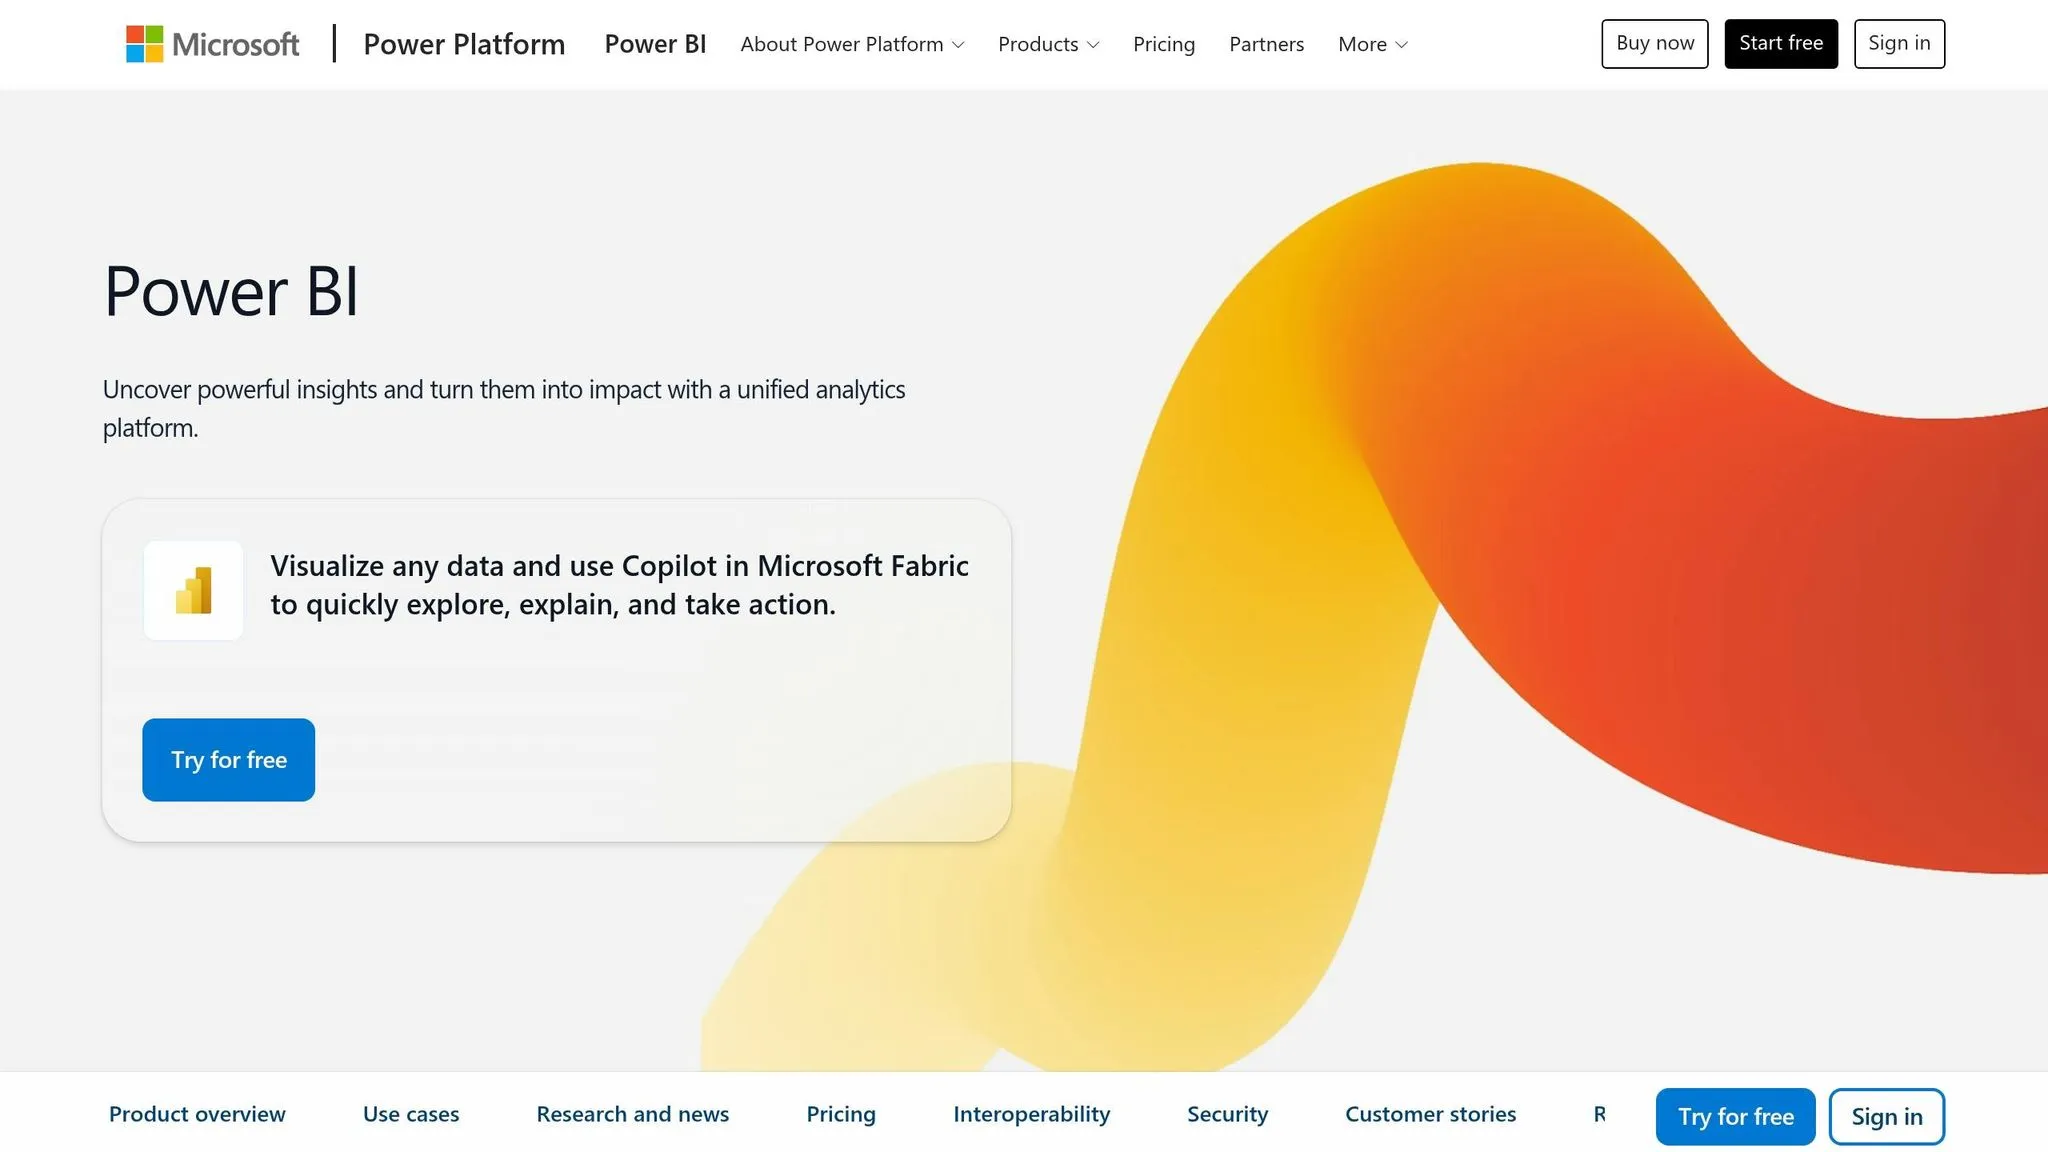
Microsoft Power BI makes a lot of sense for teams that already live in Microsoft 365, especially if they use Teams, Excel, SharePoint, and Azure day to day. Pricing is also fairly approachable: Power BI Pro is about $14 per user/month, and Premium Per User is about $24 per user/month [1][10].
AI Workflow Depth
Power BI’s AI features run through Copilot. It can write DAX measures, build draft report pages from plain-English prompts, and summarize data [7][4]. Power BI also includes built-in visuals like Key Influencers and Decomposition Tree, which help surface correlations and likely drivers on their own [2][4].
That said, there’s a catch. For natural-language querying, Copilot tends to work best when the data has already been modeled well in DAX. If the semantic model underneath is messy or incomplete, the AI output can get shaky fast.
Semantic Metrics Governance
Power BI relies on a DAX-based semantic layer. That gives teams a lot of flexibility for more advanced logic, but it also makes it easy for business rules to spread in too many directions if no one keeps a close eye on them [2][11].
There’s also limited native Git-based version control for semantic models [2][11]. For teams that care about tighter change management around metric definitions, that can become a pain point.
Warehouse-Native Execution
Power BI supports DirectQuery for live connections to Snowflake, BigQuery, Redshift, and Postgres, so teams don’t have to import data first [1][4]. In plain terms, it can sit on top of your warehouse and query data where it already lives.
But performance isn’t fixed. It depends heavily on the warehouse underneath and how the model is set up, so live-query speed can vary a lot from one setup to another.
Self-Serve Collaboration
This is one of Power BI’s clearest strengths. Microsoft 365 integration is strong, with reports that embed in Teams and SharePoint, plus clean syncing with Excel [7]. For non-technical users already working inside Microsoft tools, that gives them a pretty direct route into self-serve reporting tools.
Still, DAX often becomes the wall people run into. Users may start off self-serve, then end up going back to an analyst once the questions get more complex.
Its main tradeoff is simple adoption versus tighter metric governance.
| Feature | Power BI Capability |
|---|---|
| AI Interface | Copilot (DAX generation, report summaries, conversational Q&A) |
| Semantic Layer | DAX-based; flexible, but governance requires strict discipline |
| Warehouse Support | Snowflake, BigQuery, Redshift, Postgres (DirectQuery) |
| Best For | Microsoft-centric organizations prioritizing low per-seat cost |
3. Google Looker
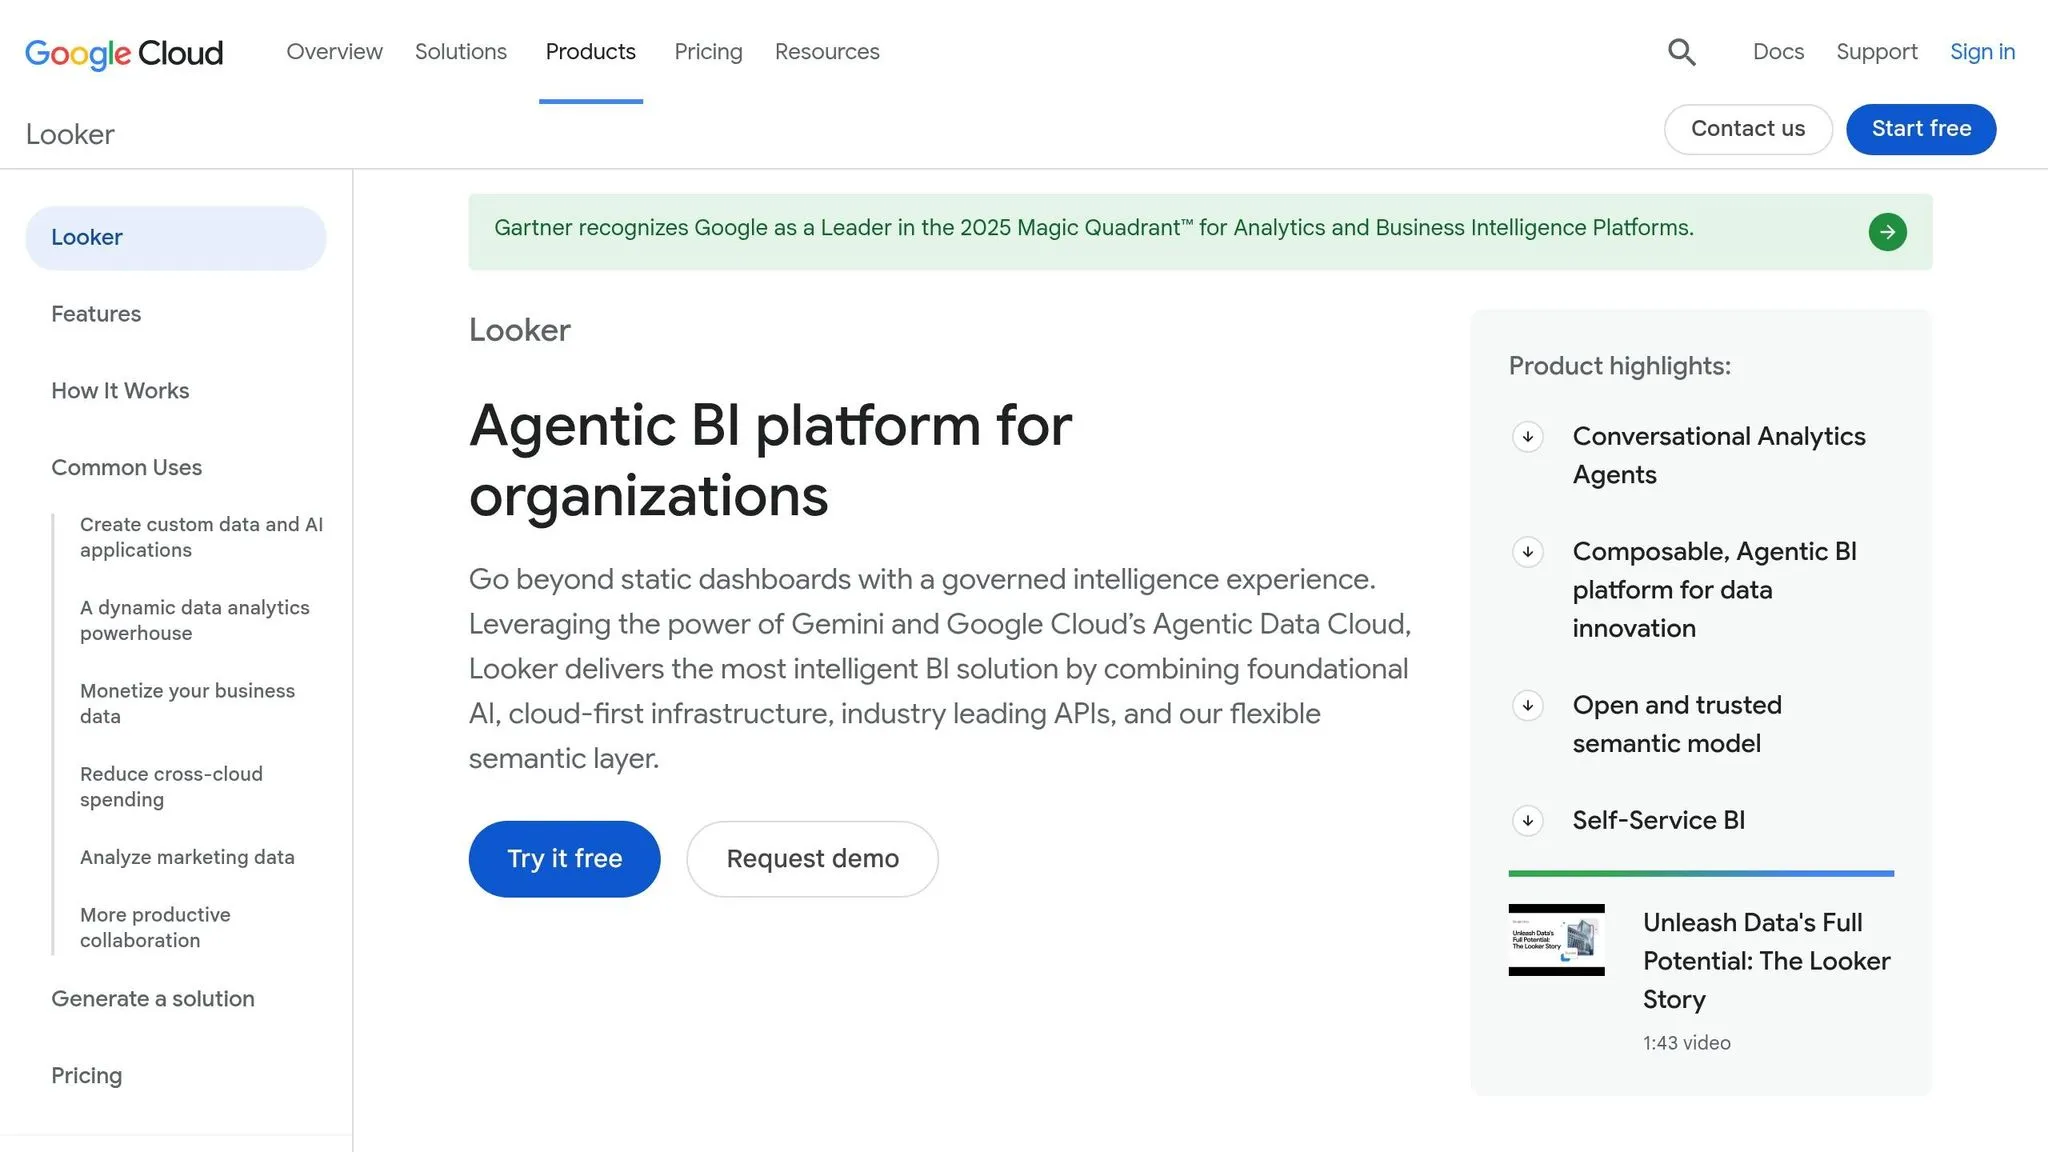
Google Looker is a step up for teams that want a code-first semantic layer and queries that run live in the warehouse.
It tends to fit engineering-led teams best. The big draw is LookML, which lets teams define joins, dimensions, and measures once, then reuse those definitions across the platform. That helps keep metrics in line instead of letting every dashboard drift in its own direction. The other big piece is the mix of governed modeling with Gemini-assisted analysis.
Looker starts at about $66,600/year for the Standard edition [8].
AI Workflow Depth
Looker’s AI setup runs through Google Gemini. That gives users natural-language-to-SQL generation and conversational follow-up questions, which can make analysis feel less rigid [4].
It also connects with BigQuery ML, so analysts can build and run machine learning models with standard SQL right from the platform [2]. If your team already lives in SQL, that’s a pretty direct path.
Semantic Metrics Governance
LookML acts as a version-controlled semantic layer. Teams define metrics once and reuse them across models, which helps keep KPI definitions steady across Snowflake, BigQuery, Redshift, Databricks, and Postgres.
The catch is the learning curve. LookML isn’t something most analysts pick up in a day or two. Teams should plan for about a 6- to 8-week onboarding period before analysts can work with it on their own [2][8].
Warehouse-Native Execution
Looker runs queries directly in the warehouse, with no data extracts. That means it works against live data in Snowflake, BigQuery, Redshift, Databricks, and Postgres [2][8].
For teams that care about staying close to source data, that setup is a big deal. You’re not juggling copies unless your stack calls for it.
Self-Serve Collaboration
Self-serve gets much easier once the model is in place. But getting to that point is usually developer-led and calls for SQL and LookML know-how.
Looker Pulse adds AI-driven alerts for key metrics. And for product teams, the Looker API stands out for embedded analytics inside external applications [2][4][8].
The tradeoffs tend to show up in three places: AI, governance, and embedded delivery.
| Feature | Google Looker Capability |
|---|---|
| AI Interface | Gemini AI (natural-language-to-SQL, conversational analytics) [4] |
| Semantic Layer | LookML (code-based, version-controlled, single source of truth) [1][2] |
| Warehouse Support | BigQuery, Snowflake, Redshift, Databricks, Postgres (push-down SQL) [2][8] |
| Best For | Engineering-led teams, BigQuery users, embedded analytics use cases |
4. Sigma Computing
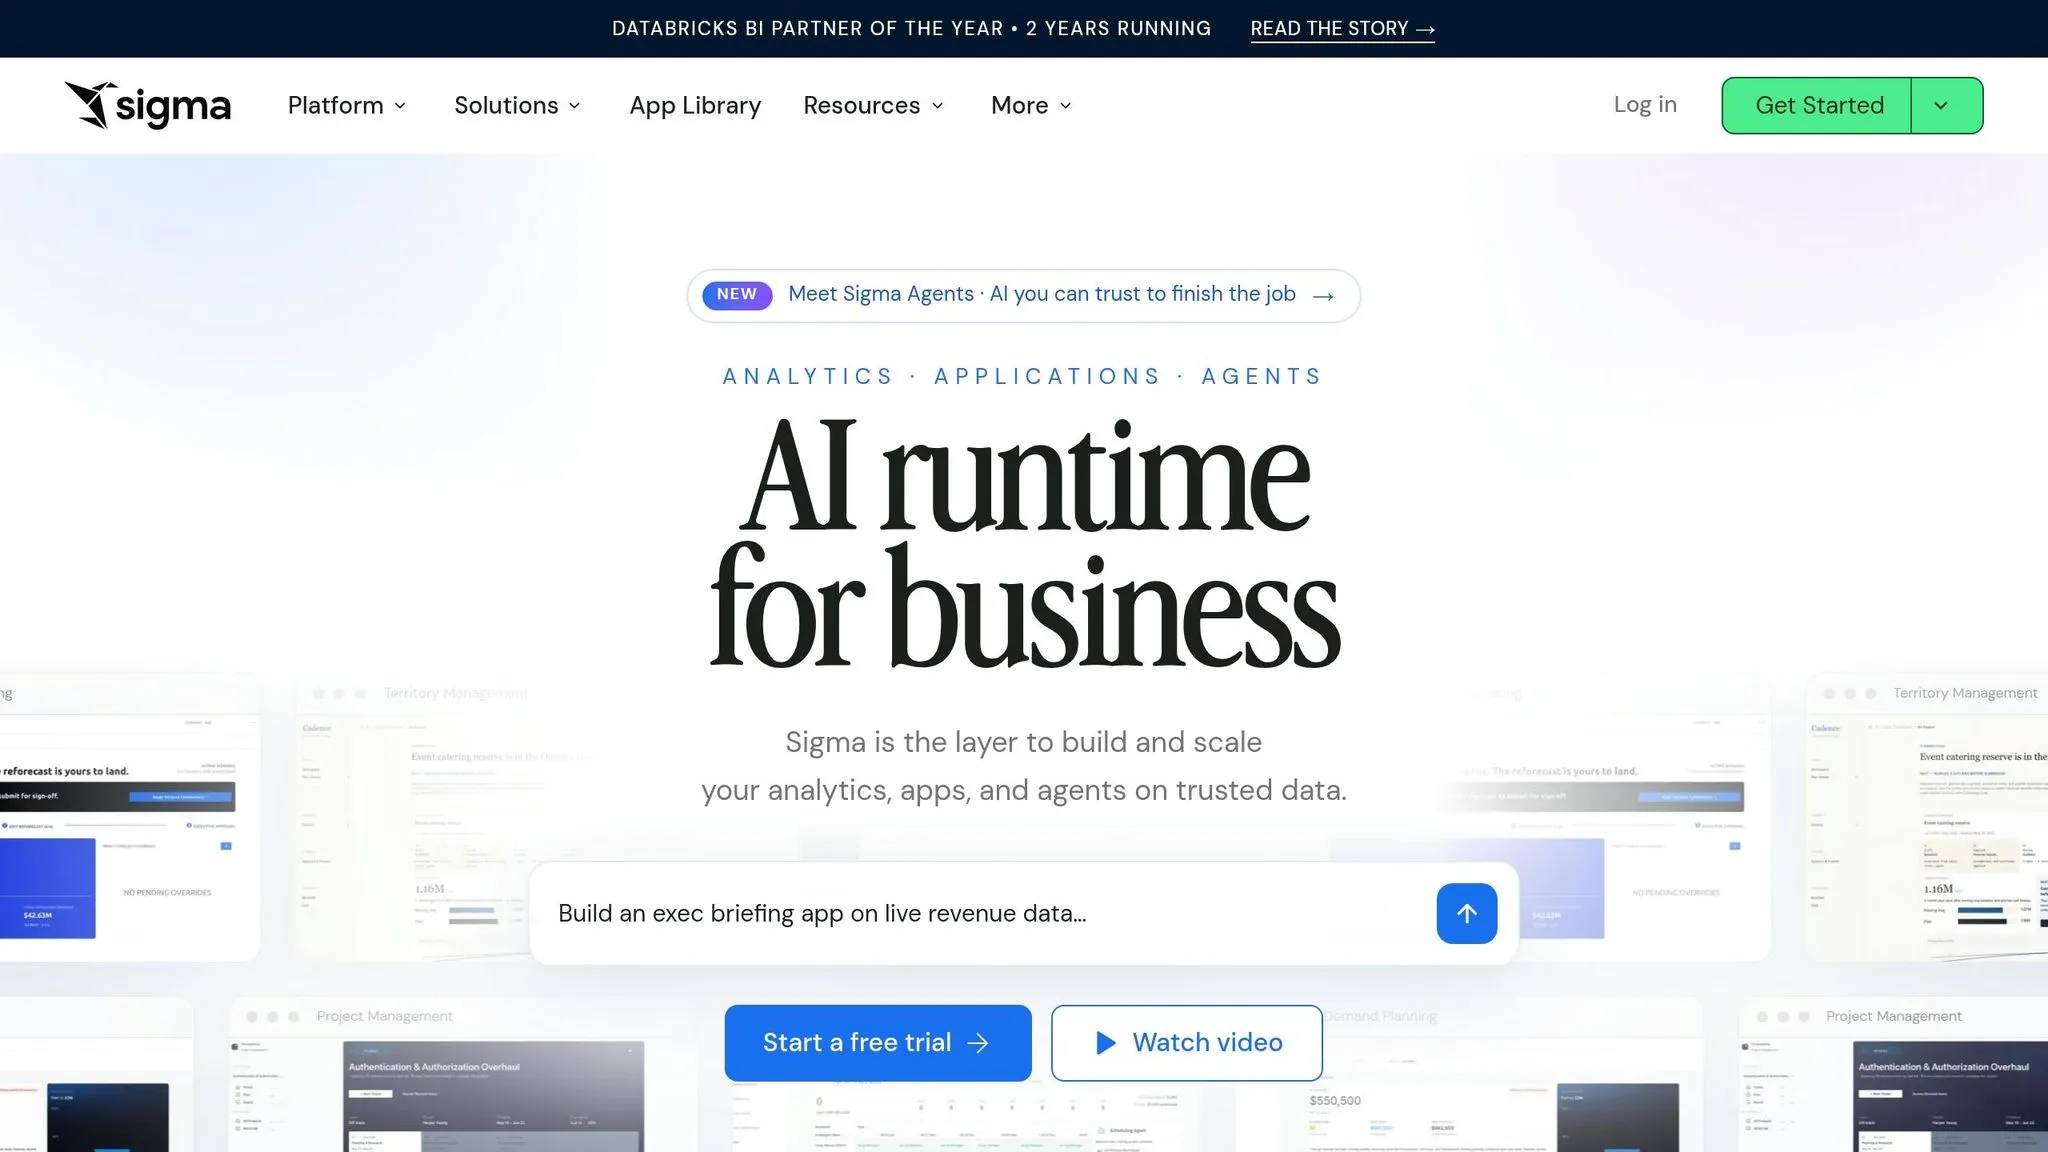
Sigma puts a spreadsheet-style layer on top of cloud warehouse data. That makes it a strong pick for finance and operations teams that would rather work with formulas than SQL. In plain English, Sigma is best for teams that want governed analysis inside a workflow that feels a lot like a spreadsheet.
AI Workflow Depth
Sigma includes native AI features for analysis on live warehouse data. Its main strength here is self-serve analysis for people who want to work with data on their own, without writing SQL.
Semantic Metrics Governance
That setup works best when everyone uses the same metric definitions. Sigma surfaces dbt-defined metrics in workbooks and relies on warehouse RBAC and Sigma controls for governance [1][8].
Warehouse-Native Execution
Sigma runs on live warehouse data, so execution and governance stay connected to the source system. It queries the warehouse directly, with no extracts or duplicate copies, and supports Snowflake, BigQuery, Redshift, and Databricks [1][8].
There is a tradeoff, though. Heavy workbook usage can drive up warehouse compute costs.
Self-Serve Collaboration
Non-technical users can explore, filter, and plan against live data without leaning on analysts for every question. Sigma also supports input tables for planning and forecasting write-back [1][3].
| Feature | Sigma Computing |
|---|---|
| AI Interface | Native AI features for analysis on live warehouse data [3] |
| Semantic Layer | dbt integration + spreadsheet formulas [8] |
| Warehouse Support | Snowflake, BigQuery, Redshift, Databricks [1][8] |
| Unique Capability | Input tables for planning and forecasting write-back [3] |
| Best For | Finance and operations teams that prefer spreadsheet-style analytics |
5. Hex
Hex is notebook-first, not dashboard-first. It gives teams one place to work through analysis in SQL, Python, and R. That makes it a strong fit for teams that work in loops: ask a question, test something, adjust it, and keep going. The big draw is simple: the notebook is the analysis interface. So if your team cares more about visible logic and step-by-step analysis than polished dashboard delivery, Hex makes a lot of sense.
AI Workflow Depth
Hex’s AI layer, called Magic, can generate SQL and Python code right inside notebook cells [1]. It also supports multi-turn analysis, which means analysts can keep refining a question in the same notebook instead of bouncing between tools.
Semantic Metrics Governance
Hex leans on dbt for governance. Its Team tier, priced at $75/editor/month, includes a semantic model agent that understands dbt models and answers natural-language questions against them [8].
A newer feature, Hex Threads - now in beta - adds a text-to-answer layer. Analysts can see the SQL, while business stakeholders get the charts and output they care about. That split is useful. Still, Hex’s semantic layer isn’t as far along as its notebook workflow. If metric consistency matters a lot, it’s smarter to define core business logic in dbt first.
### Warehouse-Native Data Analysis Execution
Hex runs queries against live data from Snowflake, BigQuery, Redshift, and Postgres [8]. That setup keeps analysis close to the warehouse, which is great for up-to-date work. But there’s a catch: frequent notebook runs and scheduled refreshes can drive compute costs up. Teams need to watch refresh timing and usage patterns.
Self-Serve Collaboration
Hex is weaker when it comes to true self-serve for business users. Its Apps mode helps by letting analysts publish interactive notebooks for non-technical stakeholders. That said, it’s better for viewing and interacting than for building from scratch.
Use Hex when the work starts with code-based analysis and ends with shared, interactive output.
| Feature | Hex |
|---|---|
| AI Interface | Magic AI cells (SQL + Python code generation) [1] |
| Semantic Layer | dbt integration + Hex Threads (beta) [8] |
| Warehouse Support | Snowflake, BigQuery, Redshift, Postgres [8] |
| Unique Capability | Collaborative notebooks with mixed SQL/Python/R cells [8] |
| Best For | Data science teams doing iterative, code-heavy analysis |
6. ThoughtSpot
Where Hex starts with notebooks, ThoughtSpot starts with search. It fits best when teams want natural-language analytics, automated explanations, and live answers from the warehouse without leaning on dashboard-heavy setups. Sage handles plain-English questions, and Spotter AI digs into why metrics moved.
AI Workflow Depth
ThoughtSpot's 2026 AI push centers on Spotter AI, an autonomous analytical agent that looks into the "why" behind metric shifts, breaks down causes with quantified attribution, and writes clear narrative explanations [3][4]. That's powerful, but there's a catch: it works best when the semantic layer is clean. SpotIQ also flags anomalies and trends [3][1].
Semantic Metrics Governance
ThoughtSpot shines when the warehouse model is already in good shape. Search accuracy and metric consistency depend on upstream relationships, synonyms, and business terms, which are often set in the warehouse or dbt. Spotter Semantics, released in March 2026, adds deterministic reasoning and aggregate awareness to improve governance and metric consistency [11].
Warehouse-Native Execution
ThoughtSpot runs queries against live data in Snowflake, BigQuery, Redshift, and Databricks [12][2]. Those live search answers depend on warehouse data quality and upstream modeling. Put simply, the better the model, the more reliable the answer [5][11].
Self-Serve Collaboration
Business users can search in plain English and keep refining results with follow-up questions. Technical analysts get more room to work with Analyst Studio, which adds SQL and Python notebooks alongside the search experience for business users [1][6]. That's the core appeal here: simple search sitting on top of disciplined modeling. The interface feels easy. The data work behind it often isn't.
| Feature | ThoughtSpot |
|---|---|
| AI Interface | ThoughtSpot Sage for natural-language search; Spotter AI for autonomous analysis |
| Semantic Layer | Spotter Semantics; requires pre-modeled warehouse data |
| Warehouse Support | Snowflake, BigQuery, Redshift, Databricks |
| Unique Capability | Search-driven analytics with quantified attribution and narrative explanations |
| Best For | Teams with mature data models that want self-serve search for business users |
7. Mode
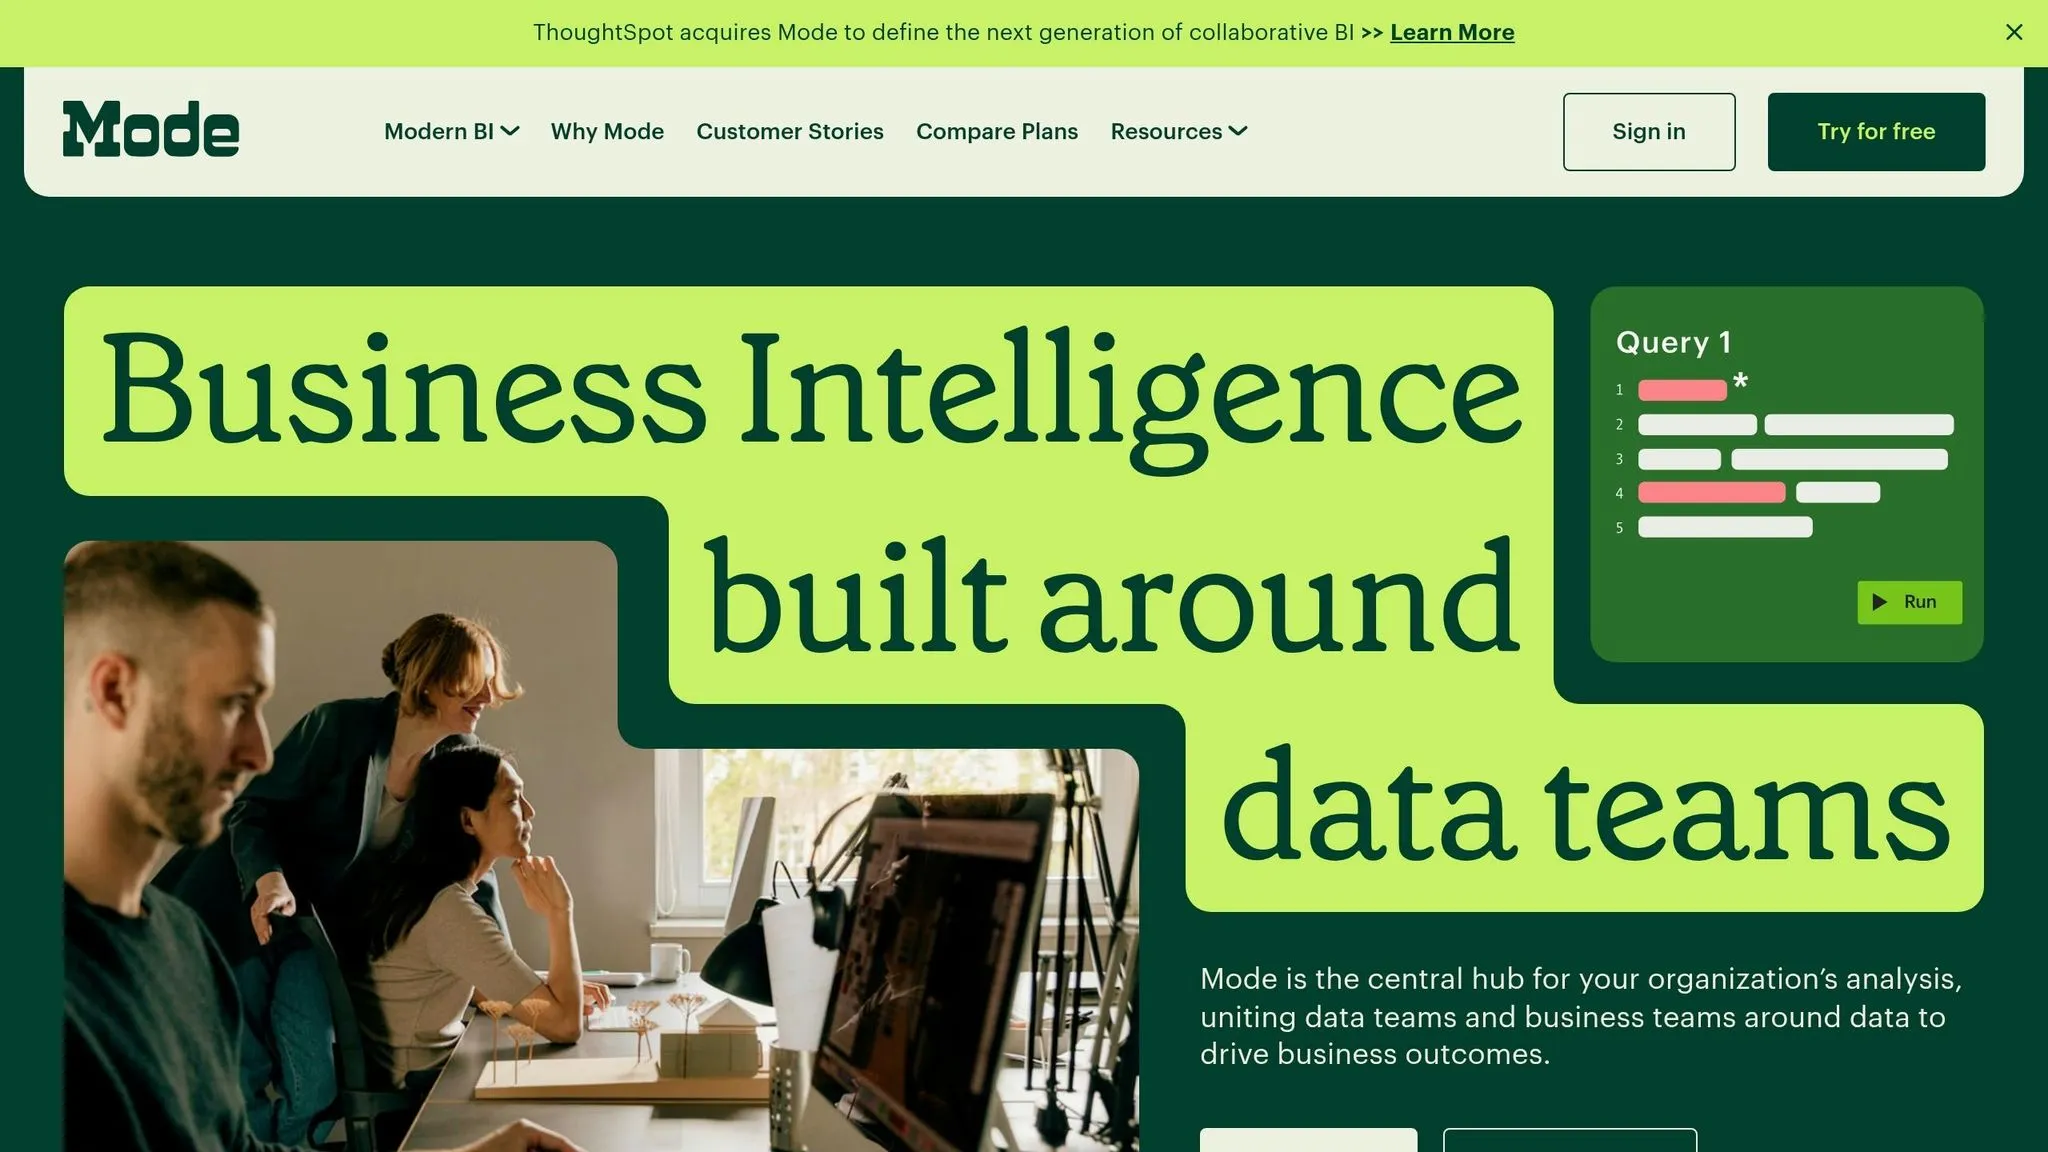
Mode is the SQL-and-Python workspace inside ThoughtSpot, built with technical analysts in mind. If your team works in a code-first analytics setup, it's a strong option. You get AI help without giving up the tools analysts already use every day.
AI Workflow Depth
Mode adds natural-language help to SQL and Python work, but the main experience still revolves around a unified SQL editor and Python notebook. That's the key point here: the AI supports the workflow instead of taking it over.
The assistance comes from ThoughtSpot's AI layer, which helps with data prep and query suggestions while keeping analysts in the same workspace. No bouncing between tools. No awkward handoff from prompt to code.
Semantic Metrics Governance
Mode also added Spotter Semantics, a centralized semantic layer for governed business definitions. That helps teams keep KPIs consistent across reports and analysis.
There is a catch, though. It still leans on clean dbt or warehouse models. So if the data model underneath is messy, the semantic layer won't magically fix it.
Warehouse-Native Execution
Mode runs queries on live data in Snowflake, BigQuery, Redshift, and Postgres, which helps keep results current without extracts [1][9].
Self-Serve Collaboration
For analyst-led teams, that means shareable links and scheduled deliveries inside one SQL-and-Python workspace [1][5].
Mode is a weaker fit for non-technical self-serve and executive dashboarding. Pricing starts at $349 per user, per month [1].
| Feature | Mode |
|---|---|
| AI Interface | Natural-language help for SQL and Python analysis |
| Semantic Layer | Spotter Semantics with governed business definitions |
| Warehouse Support | Snowflake, BigQuery, Redshift, Postgres |
| Unique Capability | Unified SQL editor plus Python notebooks in one workspace |
| Best For | Technical analysts who need SQL and Python in one workspace |
Pros and Cons
The table below shows the tradeoff that tends to matter most with each tool: governed metrics, self-serve ease, or warehouse-native execution. It trims the longer tool-by-tool review down to the tradeoffs buyers usually feel day to day.
| Tool | Pros | Cons | Best-Fit Team |
|---|---|---|---|
| Querio | Governed self-serve analytics on live warehouse data | Not a fit for CSV-based or extract-based workflows | Data teams that need governed self-serve analytics on a live warehouse |
| Microsoft Power BI | Strong Microsoft ecosystem fit; starts around $14/user/month | DAX governance requires strict discipline; capacity pricing rises quickly at higher tiers | Microsoft-centric shops that prioritize cost and ecosystem fit |
| Google Looker | LookML enforces metric consistency organization-wide | Requires strong implementation discipline; steep LookML learning curve | Teams with dedicated data engineering capacity that run on BigQuery |
| Sigma Computing | Spreadsheet-style interface on live warehouse data; no extracts | Lacks a centralized semantic layer; less flexibility for pixel-perfect reporting | Spreadsheet-fluent business users who want warehouse-native queries without SQL |
| Hex | SQL and Python notebook collaboration in one workspace | Not built for broad non-technical self-serve | Product and data science teams doing deep exploratory analysis |
| ThoughtSpot | Search-driven natural-language Q&A for high ad hoc request volume | Requires significant upfront data modeling before the AI layer delivers value | Teams with strong data modeling and heavy demand from business users |
| Mode | Unified SQL editor and Python notebooks in one workspace | Starts at $349/user/month; weak fit for non-technical self-serve | Technical analysts who live in SQL and Python and need both in a single workspace |
Here’s the big pattern across all seven tools: governance and ease of use almost never show up together by default. That tension keeps coming up, no matter which product you look at.
Tools built for technical analysts, like Hex and Mode, give power users a lot of room to work. But that usually means business users get left out. On the other side, tools built for search-led self-serve, like ThoughtSpot, can look simple on the surface, but they need heavy data modeling and semantic layer work before the AI layer starts paying off.
Then you have tools with strong semantic control, like Google Looker. They help keep metrics in line across a company, which sounds great in theory. In practice, though, that setup often needs a dedicated engineering team just to keep the system running smoothly.
The conclusion below turns those tradeoffs into a short recommendation by team type.
Conclusion
The right pick comes down to how your team works day to day, not a feature checklist. What separates these tools is how they handle AI-assisted analysis without hurting trust in the numbers. The fastest way to choose is to start with your operating model: governed self-serve, Microsoft-native reporting, code-first analysis, or search-driven exploration.
That creates a pretty clear split by team type. Power BI works well for Microsoft-centric teams that want low-cost, familiar reporting. It’s one of the lowest-friction options for teams already deep in the Microsoft stack. Use Looker for code-defined governance, Sigma for spreadsheet-style analysis, Hex and Mode for SQL/Python workflows, and ThoughtSpot for search-driven ad hoc questions.
Querio fits B2B SaaS data teams that need governed self-serve analytics on a live warehouse. It keeps logic inspectable in SQL and Python, and it reuses a shared context layer for joins, metrics, and business terms.
The best Tableau alternative is the one your team will actually govern, trust, and use every day.
FAQs
How do I choose the right tool for my team?
Choose based on your data stack, your team’s skill level, and your governance needs.
If your company is already deep in Microsoft, Power BI usually makes the most sense. If you want polished, interactive dashboards, Tableau is still a common point of comparison. If your team cares most about governed metrics built from the warehouse, Looker tends to work well for engineering-led teams.
The best pick is the one that cuts long-term overhead by matching how your team models, governs, and works with data.
What matters more: self-serve ease or metric governance?
Metric governance matters more when you care about long-term reliability and accuracy. Self-serve ease, on the other hand, is what drives adoption and speed. For a while, teams treated those as separate goals. In 2026, that split doesn’t hold up as well.
Here’s why: without a governed semantic layer, self-serve analytics can turn messy fast. Teams start using slightly different metric logic, dashboards stop matching, and metric drift creeps in. One report says revenue is up. Another says it’s flat. Same business, different math.
The goal is to get both sides working together. Define metrics like revenue or churn once in a governed layer, then let people self-serve against that trusted logic. That way, users can move fast without making up their own version of the truth.
Will live warehouse querying increase compute costs?
Yes. Live warehouse querying can drive up compute costs because every interaction runs right against your warehouse.
When there are no internal extracts or caches, all processing happens in real time. That means more usage can translate into more load on Snowflake, BigQuery, or Redshift. And when teams start running heavier queries or frequent AI-driven analysis, that load can climb fast.
To keep costs under control, rightsize your warehouse and tune query performance.