Business Intelligence
Best self-service analytics tools in 2026 (and why legacy analytics fall short)
Compare top AI-driven self-service analytics platforms, why legacy tools lag, and how modern platforms boost insights, governance, and ROI.
The analytics landscape in 2026 has shifted dramatically. Legacy tools struggle to keep up with modern business needs, leaving many organizations stuck in bottlenecks and delays. Meanwhile, AI-driven self-service platforms are transforming how companies access and act on data.
Key Takeaways:
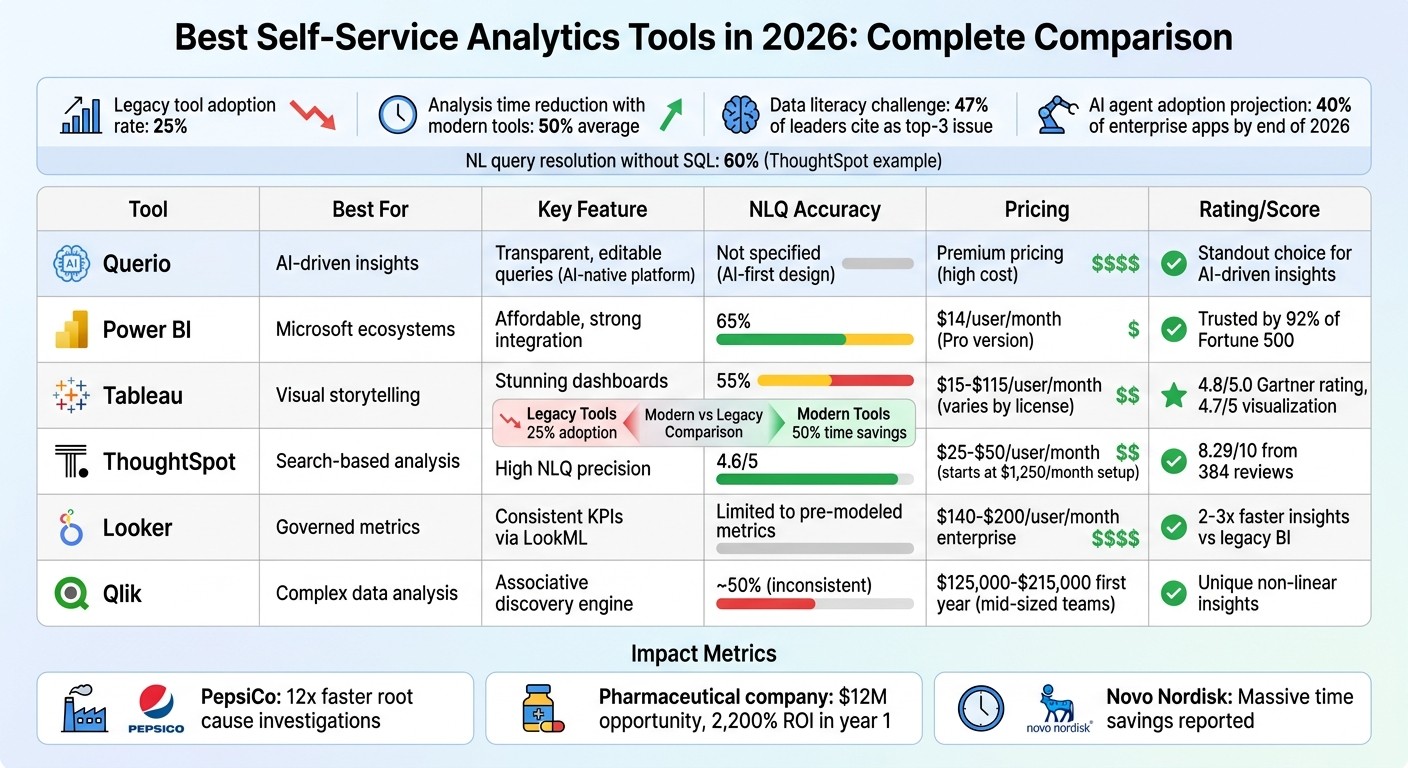
Legacy Challenges: Older tools rely on pre-built dashboards and require data team intervention for new insights, slowing decision-making. Adoption rates remain low at 25%.
Modern Solutions: AI-powered platforms like Querio, Power BI, and ThoughtSpot enable natural language querying, autonomous analysis, and faster insights, cutting analysis times by up to 50%.
AI Capabilities: Tools now offer features like anomaly detection, root cause analysis, and automated workflows, reducing reliance on analysts.
Business Impact: Companies like PepsiCo and Novo Nordisk report massive time savings (12x faster insights) and high ROI using these AI-first tools.
Top Tools:
Querio: AI-native platform with editable SQL/Python queries and strong governance.
Power BI: Affordable, integrates well with Microsoft, and includes advanced AI features.
Tableau: Focuses on visual dashboards but lags in AI accuracy.
ThoughtSpot: Search-driven with high natural language query precision.
Looker: Strong governance via LookML but limited flexibility for ad-hoc queries.
Qlik: Flexible exploration with an associative engine but inconsistent natural language accuracy.
Quick Comparison:
Tool | Best For | Key Feature | Limitation |
|---|---|---|---|
Querio | AI-driven insights | Transparent, editable queries | High cost |
Power BI | Microsoft ecosystems | Affordable, strong integration | Lower natural language accuracy (65%) |
Tableau | Visual storytelling | Stunning dashboards | Limited AI capabilities |
ThoughtSpot | Search-based analysis | High NLQ precision (4.6/5) | Expensive setup ($1,250/month) |
Looker | Governed metrics | Consistent KPIs via LookML | Requires technical expertise |
Qlik | Complex data analysis | Associative discovery engine | Inconsistent NLQ accuracy (≈50%) |
Modern tools like Querio lead the way by automating insights and eliminating manual processes. Businesses looking to stay competitive must evaluate these platforms for their ability to deliver fast, actionable answers.
Self-Service Analytics Tools Comparison 2026: Features, Pricing & Performance
What are Best AI Analytics Tools and Strategies for 2026?
1. Querio
Querio takes a fresh approach to self-service analytics, moving away from the limitations of older tools by using an AI-first design. It connects directly to your existing data warehouse - whether that's Snowflake, BigQuery, Amazon Redshift, ClickHouse, PostgreSQL, or others - and turns plain English queries into real SQL and Python code. Unlike opaque AI tools, Querio ensures transparency by providing fully inspectable answers, showing the exact queries and logic behind the results.
AI Capabilities
Querio's AI agents bridge the gap between business questions and technical execution by generating SQL and Python code that is completely visible and editable. This approach empowers data teams to retain control while enabling business users to operate independently. Its notebook environment dynamically updates analyses whenever logic changes, solving the version control headaches common with older systems. A semantic layer ensures consistency in business definitions - like joins, metrics, and terminology - whether you're working on ad-hoc queries, dashboards, or embedding analytics into customer-facing applications.
Scalability
Querio's architecture is designed to scale seamlessly with your current infrastructure. By querying data directly from your warehouse using encrypted, read-only credentials, it avoids the need for duplicating data. This setup grows naturally with your existing investments, eliminating the need for separate analytics databases. The platform offers unlimited usage and seats per workspace, removing the burden of per-user licensing fees. Teams can start small and expand across the organization without the hassle of reworking infrastructure or renegotiating contracts.
Governance
With a shared context layer, Querio creates a reliable single source of truth for business logic. Role-based access controls integrate smoothly with standard SSO providers, ensuring secure access. Additionally, SOC 2 Type II compliance meets enterprise-level security needs. While traditional platforms often restrict access in the name of governance, Querio takes a different route. It provides self-service access to data within well-defined guardrails, ensuring metrics remain consistent and unauthorized access is prevented.
Integration
Querio goes beyond simple warehouse connections by enabling embedded analytics through APIs and iframes. This allows teams to apply governed logic directly to customer-facing applications. The platform supports both cloud and self-hosted deployment options and includes built-in reporting and dashboards, eliminating the need for separate visualization tools. By consolidating these capabilities, Querio reduces the technical debt and complexity that often arise when stitching together multiple outdated systems. This streamlined integration positions Querio as a strong alternative to legacy solutions.
2. Power BI
Power BI is a powerhouse in the data visualization world, trusted by 92% of Fortune 500 companies [4]. By March 2026, Microsoft plans to enhance the platform with Copilot, a tool designed to generate reports, summarize data, and deliver insights using natural language [4][5]. The Copilot pane stays active while processing requests, so users can continue working without interruptions [5]. These updates further emphasize Power BI’s focus on advanced AI features, scalability, governance, and seamless integration.
AI Capabilities
Power BI leverages AI to make data analysis smarter and more intuitive. Features like Key Influencers and Decomposition Trees automatically highlight important patterns in data [4]. The AI Narrative visual adapts in real-time as users interact with report slicers, thanks to an "Auto refresh" toggle [4][5]. A major innovation, Translytical Task Flows, launched in March 2026, allows users to update records, trigger external APIs like Azure OpenAI, or modify Fabric SQL database entries - all directly within reports, eliminating the need to switch tools [5]. Additionally, integration with Azure Machine Learning enables descriptive, predictive, and prescriptive modeling within a self-service framework [4].
Scalability
Handling large-scale data is a breeze for Power BI, thanks to Direct Lake Mode in Microsoft Fabric. This feature lets users analyze terabytes of data directly from OneLake without needing to duplicate it or wait for refreshes [5]. The VertiPaq engine ensures high-speed performance, even with massive datasets. Organizations can scale their operations using a tiered capacity model: Tier 1 for critical reports, Tier 2 for business operations, and Tier 3 for ad-hoc analysis. Unlike older tools that falter with large datasets, Power BI offers modern performance designed for enterprise needs.
Governance
Power BI prioritizes security and governance. Role-Based Access Control safeguards data, while encryption and advanced semantic modeling ensure consistent KPI definitions across the organization [4]. Integration with Microsoft Entra ID enables single sign-on, and features like multi-geo deployments and Fabric Realms address data residency requirements. Microsoft Purview integration further supports data lineage and compliance as data scales. These features offer a level of security and reliability that older systems often lack.
Integration
Power BI’s integration capabilities make it a standout in the analytics space. It works seamlessly with Microsoft 365, Azure Synapse, Snowflake, and Google BigQuery [4]. Developers benefit from support for XMLA endpoints, as well as custom scripts in Python and R. Git integration with Azure Repos and GitHub ensures version control, while deployment pipelines streamline the transition from development to production. These integrations solidify Power BI’s position as a key player in modern analytics workflows.
3. Tableau
Tableau continues to stand out in 2026 as a leader in self-service analytics, celebrated for its ability to create visually striking dashboards and tell compelling data stories. With a 4.8/5.0 rating from Gartner, it offers more than 50 chart types, making it easy to dive into complex datasets quickly [2]. Pricing for Tableau varies based on user roles: $15 to $35 per month for Viewer licenses, $42 to $70 for Explorer licenses, and $75 to $115 for Creator licenses, which come with Tableau Prep and full authoring capabilities [6][2].
AI Capabilities
Tableau's AI tools are designed to deliver proactive insights. Tableau Pulse stands out by monitoring metrics and flagging anomalies before users even ask. For instance, in 2026, Box utilized Tableau Pulse to track cybersecurity metrics, identifying unusual login behaviors and access patterns that helped improve their response to potential threats [6]. The platform also includes "Ask Data", a natural language interface that lets users query data conversationally. However, tests showed it has a 55% accuracy rate for handling complex queries [7]. To ensure data security, the Einstein Trust Layer masks sensitive information, such as personal and financial data, before processing it with AI [6].
Scalability
Tableau also excels when it comes to scaling data operations. Tableau Prep simplifies data preparation with a visual, flow-based ETL process, allowing users to clean and shape large datasets without needing to code [8]. Its visualization engine is highly rated, earning a 4.7 out of 5 in 2026 comparisons, with users appreciating the ease of its drag-and-drop interface for uncovering patterns in complex datasets [3]. However, the workbook-centric semantic layer may feel limiting compared to platforms offering centralized "metrics-as-code" solutions. For environments with heavy data loads, Tableau Extracts help reduce query times during concurrent AI operations [6].
Governance
On the governance front, Tableau incorporates strong safeguards to protect data integrity and security. The Einstein Trust Layer ensures sensitive raw data stays within governed environments by automatically applying data masking [6]. That said, admins should double-check AI-generated calculations before deploying dashboards, as features like "Ask Data" can occasionally produce incorrect results, especially with complex date-related queries [6][7].
Integration
Tableau integrates seamlessly with the Salesforce ecosystem, enhancing its predictive analytics capabilities through Salesforce Einstein and Einstein Discovery [2][3]. The Tableau Pulse feature sends AI-driven metric summaries directly to users via email or Slack, saving time by eliminating the need to log into dashboards [2]. Users have praised Pulse for its ability to identify anomalies - such as a 23% revenue drop - and deliver plain-language summaries that make decision-making faster and easier [7].
4. ThoughtSpot
ThoughtSpot takes a modern approach to analytics, offering a search-first experience powered by AI. Think of it as bringing the simplicity of a Google search to data exploration. With an 8.29/10 rating from 384 verified reviews [10], it allows users to instantly convert plain English into SQL queries across billions of rows. Pricing starts at $25 per user per month for the Essentials plan (designed for 5–50 users and up to 25 million rows), $50 per user per month for the Pro plan (up to 1,000 users and 250 million rows), and a flexible $0.10 per query option for workloads with unpredictable demands [10][3].
AI Capabilities
ThoughtSpot's AI tools are designed to make data insights accessible to everyone, regardless of technical expertise. Key features include the Spotter AI Agent and SpotIQ Automated Insights, which continuously monitor data to identify anomalies and outliers - essentially acting like an always-on analyst [9][10]. Its natural language BI functionality earns a strong 4.6 out of 5 rating, and businesses report that about 60% of user queries can be handled without SQL support [10][3].
A reviewer on Capterra shared: "SpotIQ is the standout feature for us. It automatically surfaces insights and anomalies that we would have missed manually. It's like having an extra analyst on the team" [10].
Additionally, ThoughtSpot supports flexible selection of large language models (LLMs) to tailor analytics to specific needs [10].
Scalability
Designed for large-scale operations, ThoughtSpot integrates directly with major data warehouses and delivers live query results in seconds, even for massive datasets. This eliminates the delays often associated with older systems [9][10]. The Agentic Semantic Layer (Spotter Semantics) transforms raw, fragmented data into a structured business context, ensuring accurate and reliable AI-driven insights at an enterprise level [11]. In 2026, the company introduced Spotter for Industries, a feature offering domain-specific agents tailored to sectors like healthcare, retail, and finance. These agents understand the unique terminology and regulations of their respective industries.
CEO Ketan Karkhanis explained: "Industry solutions don't talk SQL, they talk industry language and industry vernacular. We're giving our customers a faster path to going live with industry solutions" [11].
Governance
Governance is a key focus for ThoughtSpot, with tools like the ThoughtSpot Modeling Language (TML) providing administrators with the ability to configure and manage data models. However, users have noted that the initial setup can involve a steep learning curve [10]. The platform meets rigorous security standards, including SOC 1/2/3, ISO 27001, HIPAA, and GDPR certifications [10]. Some reviewers recommend allocating resources for upfront modeling work to establish a strong governance framework [10]. These measures ensure that ThoughtSpot's integrations are both secure and effective.
Integration
ThoughtSpot makes it easy to keep data insights within existing workflows by integrating directly with platforms like Slack, Microsoft Teams, and email. This approach reflects a shift away from static dashboards [12]. For developers, ThoughtSpot Everywhere provides an SDK and REST API to embed search-driven analytics into custom SaaS products. Additionally, the Model Context Protocol (MCP) Server allows external AI agents to connect seamlessly to ThoughtSpot's analytics workflows [9][10]. For advanced users, the Analyst Studio offers a specialized environment with support for SQL, R, and Python [10].
5. Looker
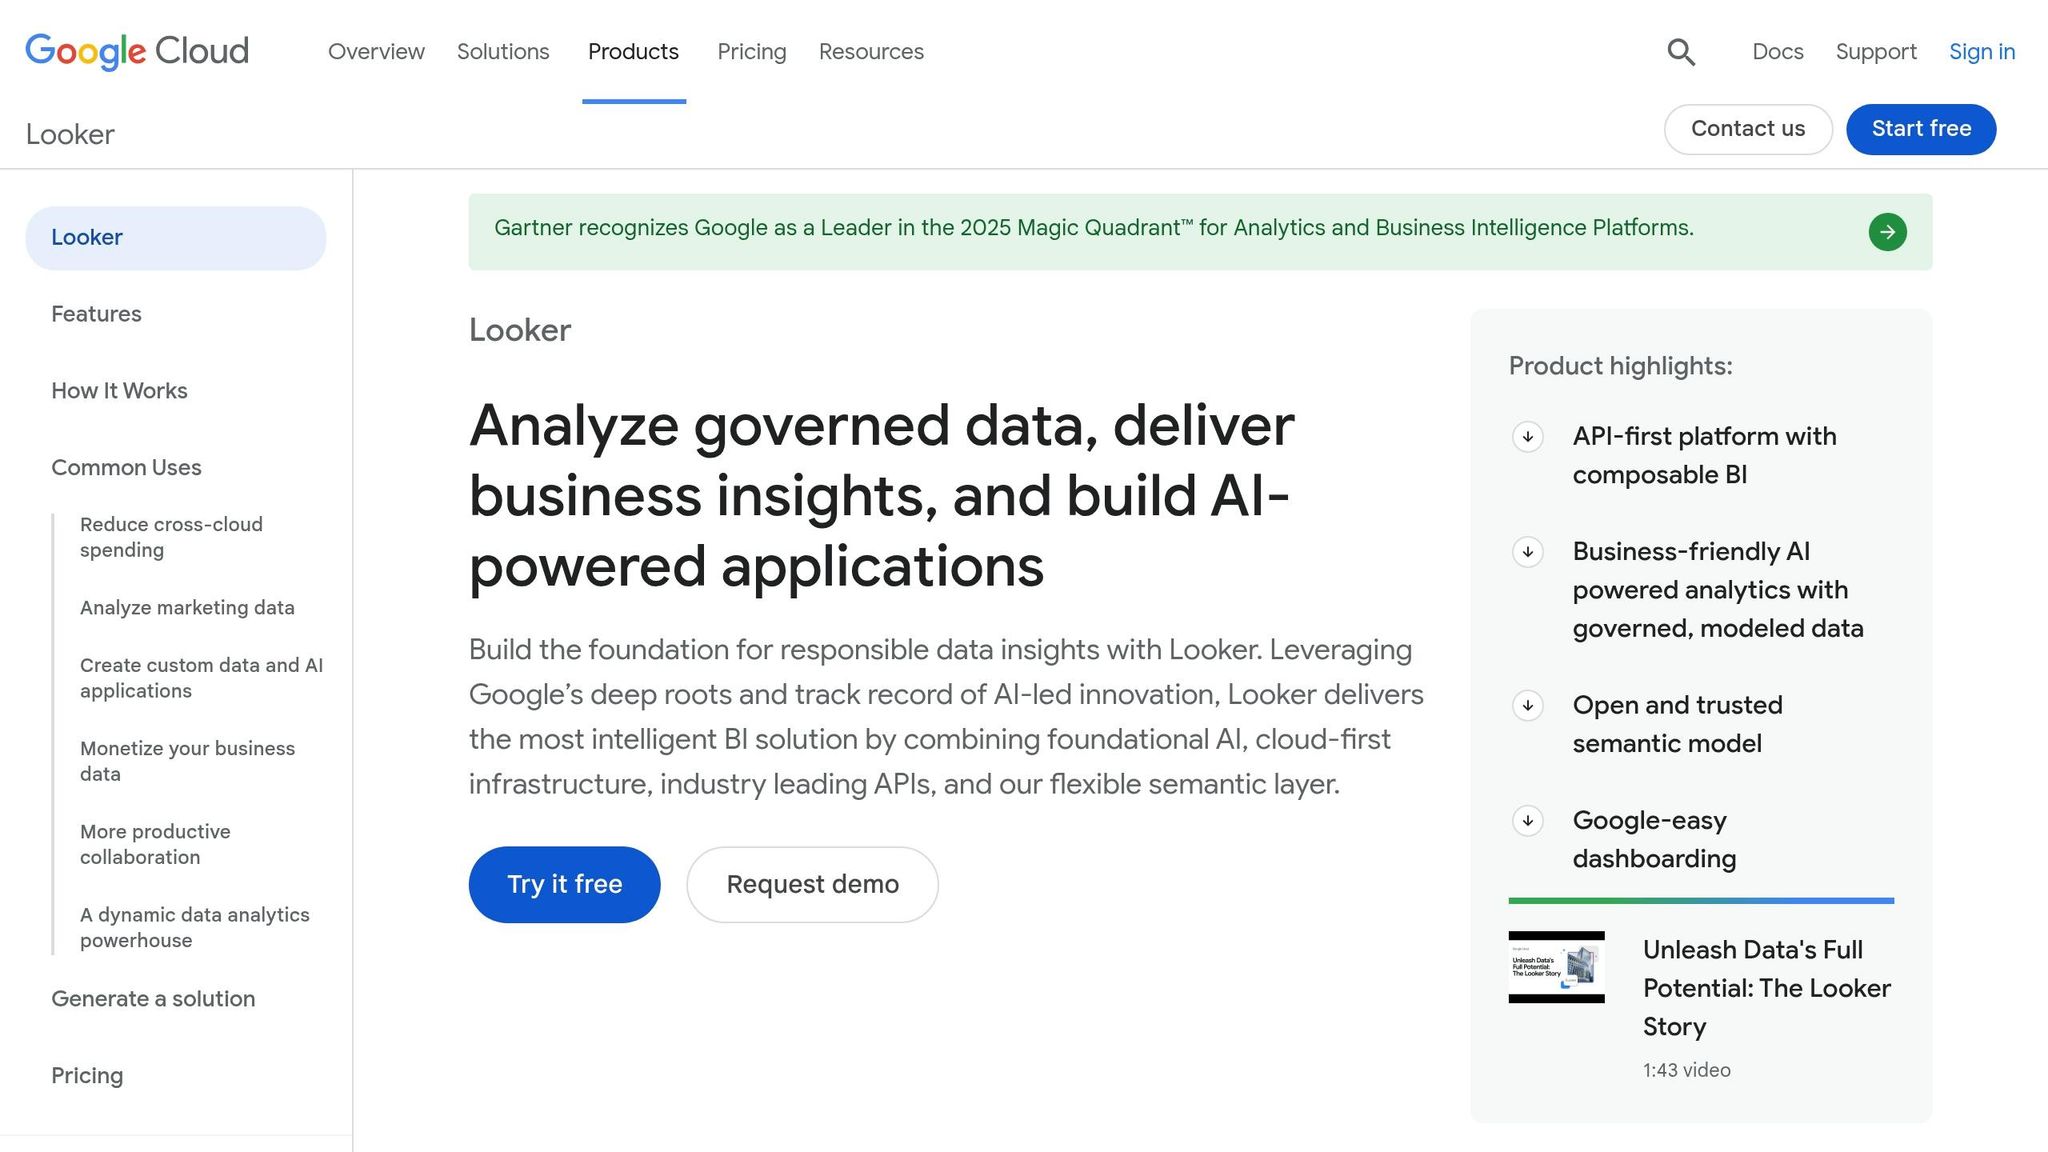
Looker, part of Google Cloud, takes a code-driven approach to analytics using its LookML modeling language. This semantic layer ensures that business metrics are defined once and remain consistent across all reports, dashboards, and integrations. By doing so, it eliminates the common issue of "metric drift", where teams define the same KPI differently. Pricing for enterprise users ranges from $140 to $200 per user per month, with total costs often exceeding $5,000 monthly [3][14]. For smaller teams, Looker Studio Pro provides a more affordable option at $9 per user per month [13].
AI Capabilities
Looker uses Google's Gemini AI to power conversational analytics, enabling users to query data in natural language. In 2026, new AI tools were introduced, including the LookML Assistant (version 25.2) for automated model building and the Visualization Assistant for smart chart suggestions. The LookML semantic layer helps reduce errors in generative AI data by 66%, thanks to centralized governance and version control [16]. However, its reliance on LookML can make ad-hoc querying less flexible.
Scalability
Looker’s architecture relies on your cloud data warehouse as the compute engine, avoiding the need for a separate processing layer. It uses three caching layers: short-term caching for dashboards, scheduled refreshes for complex tiles, and persistent derived tables (PDTs) for stable data transformations [15]. Organizations using Looker’s governance tools report delivering insights two to three times faster than with older BI platforms [16]. For customer-facing applications, the Embed tier supports up to 500,000 query-based API calls per month [16], showcasing its ability to handle large-scale use cases.
"The fastest way to lose trust in data is to let every team define the same metric differently... Looker exists to fix that class of problem." – TheLinuxCode [15]
Governance
Looker approaches analytics with a software development mindset. LookML models are stored in Git repositories, enabling version control and team collaboration. This setup, however, requires expertise in SQL and LookML, which can be challenging for non-technical users [16][1]. The Looker Modeler acts as a standalone semantic layer, letting organizations define metrics once and use them across various BI tools [14]. Through the Open Semantic Interchange (OSI) initiative, Looker is working to create standardized semantic models that can be shared across BI tools and AI systems [13].
Integration
Looker’s integration capabilities are showcased by Wpromote's Polaris platform. By pulling data from over 1,400 sources into BigQuery and standardizing metrics in LookML, the agency reduced client report creation times from days to minutes [13]. Looker’s alert system can trigger Looker Studio reports when key metrics, like ROAS, fall below targets. It also integrates natively with Google Workspace, offering live data links and automated reporting in Google Slides, Sheets, and Chat [16]. Additionally, its Conversational Analytics API allows developers to embed natural language queries and visualization tools into custom applications [16].
6. Qlik
Qlik sets itself apart from platforms that focus solely on visualization through its associative engine. This engine uncovers non-linear data relationships that traditional query-based tools often overlook [3][2]. Instead of restricting users to predefined analytics paths, it allows for flexible exploration of complex datasets, helping users discover insights that might otherwise go unnoticed. For mid-sized teams, the total cost for the first year of deployment typically falls between $125,000 and $215,000 [3]. This powerful engine also forms the foundation for the advanced AI features discussed below.
AI Capabilities
In May 2025, Qlik launched its Discovery Agent, an autonomous AI tool designed to proactively scan datasets for risks and opportunities - no user prompts required. This marks a shift toward agentic AI, where the platform not only identifies trends but also suggests actions and handles multi-step reasoning. Another standout feature, Qlik Answers, enables users to query unstructured data sources like PDFs, Slack messages, images, and spreadsheets. The platform prioritizes explainable AI, ensuring that every insight it produces is both auditable and traceable.
"AI delivers value when built on curated and governed data." – Mike Krut, Senior Vice President of IT, Penske Transportation Solutions [2]
Scalability
Qlik's Open Lakehouse, introduced in 2025, uses Apache Iceberg to unify storage for both structured and unstructured data. This unified approach helps overcome the siloed limitations of older systems. The platform supports a variety of deployment options, including on-premises, private cloud, and Qlik Cloud (SaaS), making it flexible and adaptable to different environments. Additionally, Qlik’s 2025 acquisition of Upsolver brought no-code data streaming and wrangling tools into the mix, enabling real-time integration - a critical feature for meeting the growing demand for proactive intelligence in 2026.
Governance
Qlik’s scalable design is reinforced by a strong commitment to data governance. Through its Model Context Protocol (MCP), Qlik securely exposes enterprise data for AI-driven insights [2]. This ensures that even when integrating with third-party systems, the platform’s AI insights remain compliant with stringent security policies, maintaining trust and reliability across all use cases.
Comparison: Strengths and Weaknesses
Every analytics tool has its own set of advantages, but their shortcomings often highlight why businesses are pushing for more advanced solutions in their analytics stack.
Querio stands out with its AI-native capabilities, offering automated tasks and proactive insights, though it comes with a high price tag. Power BI provides excellent value at $14 per user per month for its Pro version but only resolves 65% of natural language (NL) queries [7]. Tableau shines in visual storytelling, earning a 4.7/5 rating for its visualization features, but its NL query accuracy lags at 55% [3]. ThoughtSpot achieves the highest NLQ precision at 4.6/5 but requires a hefty upfront investment starting at $1,250 per month [7]. While Looker offers robust LookML governance, its AI capabilities are confined to pre-modeled metrics. Meanwhile, Qlik's associative engine is great for uncovering non-linear insights but struggles with inconsistent NLQ accuracy, hovering around 50% [2].
These tools also differ in governance and integration capabilities. Power BI integrates seamlessly with Microsoft 365 and Azure, Looker connects well with Google Cloud and BigQuery, and Tableau aligns with Salesforce platforms [2]. However, most traditional tools still focus on "what happened" summaries and fall short when it comes to explaining "why" - a gap modern platforms address with automated root cause analysis [2].
For instance, in 2025, PepsiCo replaced manual drill-down methods with automated driver decomposition, speeding up root cause investigations by 12x. Similarly, a top-10 pharmaceutical company uncovered a $12 million commercial opportunity and achieved a 2,200% ROI in its first year by using proactive anomaly detection [2].
Modern analytics platforms, particularly those with Level 4 capabilities, take things further. These tools allow AI agents to monitor KPIs autonomously and diagnose issues without human intervention [2]. Gartner projects that by the end of 2026, 40% of enterprise applications will feature task-specific AI agents [2]. Yet, traditional self-service analytics adoption remains low, with only 25% uptake. Nearly half (47%) of data and analytics leaders cite data literacy as a top-three challenge [2]. On the other hand, organizations adopting modern self-service platforms report cutting analysis time by 50% on average [3]. Unlike older systems that merely report "what happened", modern AI-driven platforms - like Querio - offer autonomous root cause analysis, fundamentally transforming decision-making.
Tool | Best For | Key Strength | Main Limitation | Overall Assessment |
|---|---|---|---|---|
Querio | AI-native analytics | Agentic task automation | Premium pricing | Standout choice for AI-driven insights |
Power BI | Microsoft shops | Ecosystem integration ($14/user) | NLQ accuracy 65% | Strong value for Microsoft environments |
Tableau | Visual storytelling | High-quality visuals (4.7/5) | NLQ accuracy 55% | Great for dashboards, limited AI features |
ThoughtSpot | Search-driven teams | Highest NLQ precision (4.6/5) | High setup cost ($1,250/month) | Powerful but resource-heavy |
Looker | Governed enterprises | LookML code governance | AI limited to pre-modeled metrics | Ideal for Google Cloud users |
Qlik | Complex data | Associative discovery engine | Inconsistent NLQ (≈50%) | Unique engine but inconsistent AI |
The challenges of pricing, NLQ accuracy, and setup complexity underscore the need for a modern, AI-native approach. Tools like Querio are setting new standards with their AI-first designs, offering transparent, code-based insights and autonomous investigation features that eliminate the need for constant analyst involvement. These advancements are redefining what businesses can achieve with self-service analytics.
Conclusion
The world of analytics has moved far beyond static dashboards, evolving into a realm where autonomous investigation takes center stage. Traditional systems, which focus on reporting past events, often leave analysts sifting through mountains of data to uncover the "why" behind the numbers. In contrast, modern self-service tools - especially those built with AI at their core - automate this process, identifying root causes and anomalies without requiring manual intervention. The adoption numbers highlight this shift: older systems still hover at a mere 25% adoption rate [2].
When selecting a platform, it’s essential to look beyond just visualizations. The tool should seamlessly integrate with your current ecosystem while delivering deeper insights, including explanations for metric changes - not just a snapshot of the change itself.
Modern platforms are redefining expectations in analytics, and Querio exemplifies this new standard. Instead of making users grapple with complex data queries, Querio’s AI agents translate plain English questions into clear, inspectable SQL and Python. By leveraging a shared semantic layer, the platform ensures consistent definitions across your organization, eliminating the metric inconsistencies that often plague older systems.
The benefits are tangible. Real-world examples show how these tools can dramatically cut down analysis time while delivering a strong return on investment. According to Gartner, by the end of 2026, 40% of enterprise applications will feature task-specific AI agents [2]. These AI-driven features turn raw data into actionable insights, making them indispensable for businesses aiming to stay competitive.
The real question isn’t whether to adopt modern analytics - it’s which platform can grow with your business. Start by identifying your top 10 to 20 critical metrics, test the AI’s capabilities with real-world business questions (not just vendor demos), and choose tools that offer full transparency into how insights are generated. The analytics platforms that will dominate by 2026 won’t just deliver results faster - they’ll excel at helping businesses turn data into smarter decisions.
FAQs
What makes an analytics tool truly “self-service” in 2026?
A self-service analytics tool in 2026 is designed to let non-technical users take charge of their data without needing constant help from IT or data teams. It allows users to explore live data, build visualizations, and make decisions confidently. The standout features? Natural language queries that make asking questions as simple as typing, intuitive interfaces that are easy to navigate, and tools that prioritize accessibility and efficiency for all users.
How can I test AI answers for accuracy and transparency before rollout?
Ensuring AI responses are accurate and clear before deployment requires a meticulous approach. First, cross-reference AI-generated answers with trusted data sources to confirm their correctness. Reliable references are key to validating that the information aligns with established facts.
Additionally, incorporating a review process with human experts can play a crucial role. These experts can evaluate the outputs for both accuracy and clarity, providing an extra layer of scrutiny. This step helps ensure the responses are not only factually correct but also easy to understand.
By combining thorough verification with expert reviews, organizations can enhance the reliability and transparency of AI systems before they are rolled out.
What governance controls do I need for safe self-service analytics?
To keep self-service analytics secure, certain governance measures are essential. These include role-based access management to safeguard sensitive data, automated data validation to ensure accuracy, and centralized governance frameworks to enforce consistent policies across the board. Many modern analytics tools come equipped with these features, making it easier to explore data securely while staying compliant. These controls strike a balance between empowering users and managing risks, enabling fast and dependable data-driven decisions.
Related Blog Posts


