Business Intelligence
self service reporting tools business teams
How self-service reporting tools give non-technical teams live data access, standardized metrics, and faster decisions without relying on IT.
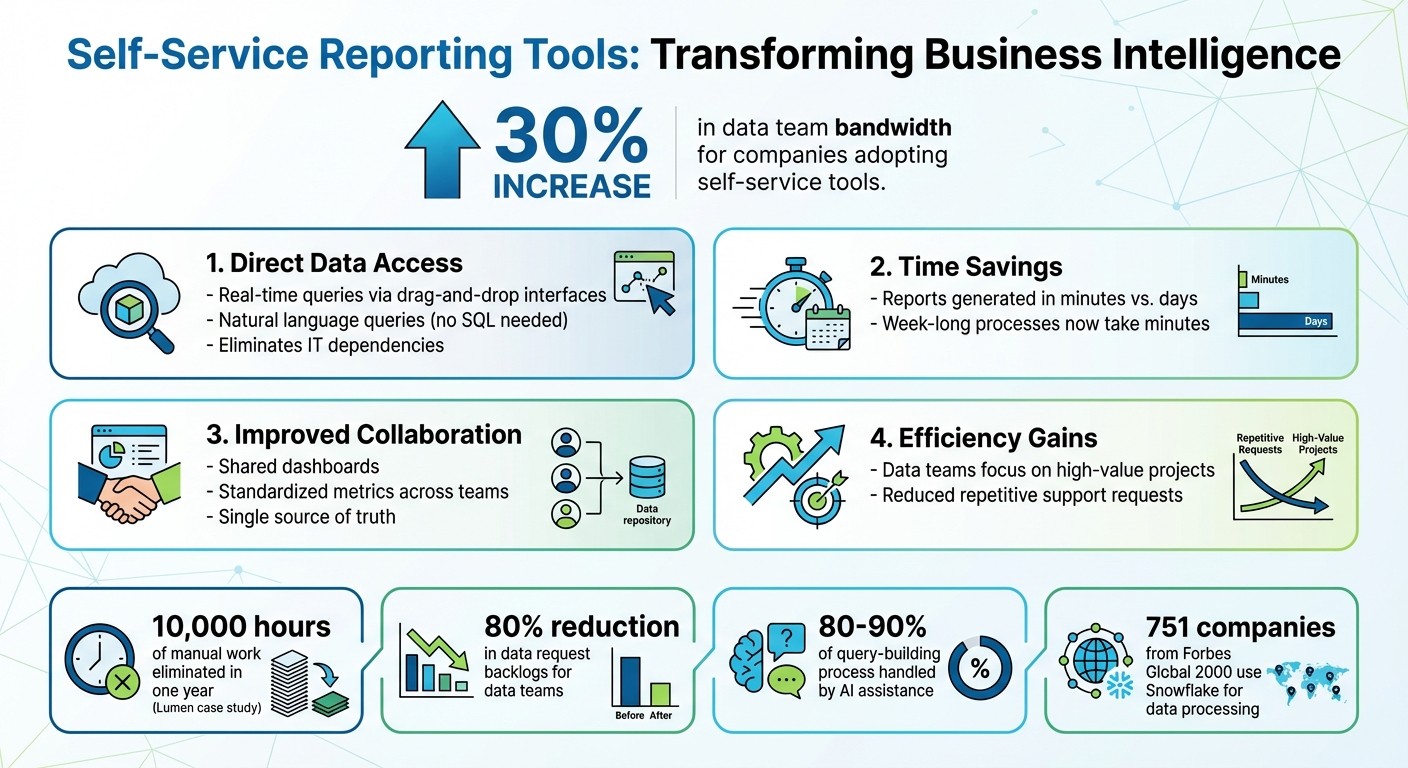
Self-service reporting tools are transforming how business teams access and use data. These tools empower non-technical users - like marketing managers, sales directors, and finance teams - to analyze and visualize data instantly without relying on IT or analysts. This eliminates delays, speeds up decision-making, and reduces overdependence on data teams.
Key Takeaways:
Direct Access: Users can query live data in real time via drag-and-drop interfaces or natural language queries.
Time Savings: Reports that once took days can now be generated in minutes.
Improved Collaboration: Shared dashboards and standardized metrics align teams and eliminate confusion over data definitions.
Efficiency Gains: Companies adopting self-service tools report up to a 30% increase in data team bandwidth.
Example:
At Lumen, adopting self-service tools saved nearly 10,000 hours of manual work in one year, allowing their data team to focus on higher-value projects.
Self-service reporting tools like Querio combine AI-driven analytics, live data connections, and consistent metrics to help organizations make faster, data-driven decisions. With features like natural language querying, shared semantic layers, and automated reporting, these platforms are reshaping how businesses operate.
Self-Service Reporting Tools Benefits and Impact Statistics
Benefits of Self-Service Reporting for Business Teams
Direct Data Access Without IT Dependencies
The old "report factory" method - where teams submit tickets, wait for IT to extract data, and finally receive static reports days later - is a thing of the past [2][3]. Self-service reporting tools cut through this outdated process by allowing live data queries and on-demand analysis. This not only saves time but also streamlines workflows and boosts overall productivity. In fact, companies implementing self-service platforms have seen a 30% increase in data team bandwidth by reducing repetitive support requests [5].
Jerod Ridge, Director of Data Engineering at Lumen, has experienced this transformation firsthand. By adopting self-service tools and automation, Lumen eliminated nearly 10,000 hours of manual work in just one year. This freed up the team to focus on initiatives that drive business value instead of repeatedly generating the same reports [6].
"In the last year alone, we've eliminated almost 10,000 manual hours through Microsoft-powered automation. That's time we now spend creating business value."
– Jerod Ridge, Director of Data Engineering, Lumen [6]
This level of efficiency allows businesses to pivot strategies more quickly and with greater confidence.
Faster Decision-Making with Real-Time Insights
Gone are the days of relying on outdated reports for decisions. With real-time data at their fingertips, business users can instantly check campaign performance, track trending products, or evaluate key metrics without waiting for custom reports.
"When business users have direct access to data, they can generate results immediately, rather than waiting days or weeks for analyst support."
– Boomi [3]
This immediate access empowers teams to make quick adjustments, allocate budgets more effectively, and respond to market changes in real time. Decisions based on up-to-date insights lead to more agile and responsive business strategies.
Better Team Collaboration Through Shared Data
Data silos are a common challenge for many organizations [4]. When different teams define key metrics - like "ROI" or "customer lifetime value" - in varying ways, it creates confusion and misalignment. Self-service tools solve this by offering shared dashboards and standardized metrics, ensuring everyone works from a single source of truth.
Nicole Nelson, Senior Vice President of Data and Analytics at Abercrombie & Fitch Co., used self-service reporting to make customer insights accessible across the organization [6].
"With the new platform and Power BI, we've democratized customer insights across the company through AI-driven data democratization. Insights are no longer siloed but available to all relevant teams..."
– Nicole Nelson, Senior Vice President of Data and Analytics, Abercrombie & Fitch Co. [6]
When teams have access to consistent, shared data, collaboration improves, decision-making aligns, and departments work together more effectively. This unified approach ensures strategies are cohesive and teamwork thrives.
How AI Tools can Finally Solve the Self-Service Analytics Problem?
Core Features of Self-Service Reporting Tools
Self-service reporting tools are designed to provide quick answers through user-friendly interfaces. These features give business teams the ability to access real-time data insights without relying on technical experts.
Natural-Language Querying
Gone are the days of needing to master SQL or other complex query languages. With AI-driven interfaces, users can simply type questions in plain English - like "What is the month-over-month revenue growth?" - and get immediate answers [7][10]. Modern tools even allow for follow-up questions, creating a conversational experience. For example, after asking "What is the revenue in Asia?" a user can seamlessly follow up with "What about North America?" without starting from scratch [7].
Tim Kessler, Head of Data, Models & Analytics at Siemens Energy, described the impact of natural-language querying:
"This chatbot … has been a game changer for Siemens Energy. The ability to unlock and democratize the data hidden in our data treasure trove has given us a distinct competitive edge." [11]
These tools work by converting plain English into SQL queries, running them directly against the data warehouse [1][7]. AI assistance can handle 80% to 90% of the query-building process, cutting down analysis time significantly [10]. However, for these tools to work effectively, data preparation is key. Model owners must provide clear descriptions, synonyms, and metric definitions to help the AI interpret the business context accurately [7][12].
Combined with live data connections, natural-language querying ensures users have instant access to up-to-date insights.
Live Data Warehouse Connections
Real-time connections to platforms like Snowflake, BigQuery, and Postgres ensure that the data used for insights is always current. These connections, made possible through REST APIs or JDBC/ODBC drivers, allow tools to query data directly from its source [7][8]. As of July 31, 2025, 751 of the Forbes Global 2000 companies rely on Snowflake for data processing and AI-driven business intelligence [11]. Snowflake even offers a 30-day free trial with $400 in free usage, giving teams the opportunity to explore live connection features before committing [11].
The advantage here is clear: every query reflects the most recent data, empowering teams to react quickly to market dynamics and operational changes.
Shared Semantic Layer for Consistency
A centralized semantic layer simplifies complex database schemas into business-friendly terms. For example, instead of deciphering that amt_ttl_pre_dsc stands for "Gross Revenue", the semantic layer automatically translates it [13]. It also standardizes metrics like "Net Revenue" or "Churn Rate", ensuring every team uses the same definitions. This consistency eliminates reporting discrepancies across departments.
"A semantic layer sits between your data warehouse and the people who need to use it. It transforms your business-ready tables into concepts everyone can understand." [13]
This setup prevents confusion where different teams report conflicting numbers for the same KPI. If a metric definition changes, updating it in one place updates it everywhere - across dashboards, AI tools, and reports. The semantic layer also acts as a safeguard for AI agents, ensuring they don’t use incorrect joins or unvetted data that could lead to errors [9]. Built using code (like YAML or JavaScript), it’s easy to review and maintain [9].
Dashboards and Automated Reporting
Dashboards simplify stakeholder updates by automating many reporting tasks. With visualizations and scheduled reports delivered via Slack or email, stakeholders stay informed without manual effort [5][12]. Companies that adopt self-service experimentation platforms report a 30% increase in data team efficiency, as fewer ad-hoc requests take up their time [5]. Instead of spending hours pulling and formatting data, teams can set up automated updates once and let the system handle the rest. This allows analysts to focus on high-impact projects rather than routine reporting.
Integrated Analytics Notebooks
Integrated notebooks combine the power of SQL, Python, and spreadsheet tools for advanced analysis. These workspaces let technical users perform complex calculations, statistical modeling, and custom transformations while still accessing a governed semantic layer [8][10]. With AI assistance and support for multiple languages, users can start with simple natural-language queries and build complexity over time - all without needing to juggle multiple platforms.
How Querio Enables Self-Service Reporting for Business Teams
Querio brings together AI-driven analytics, live data warehouse connections, and a unified metrics framework, giving business teams the ability to access insights quickly - without needing IT support.
AI-Powered Analytics for Non-Technical Users
Querio's AI transforms plain-English questions into SQL and Python code, running directly against your data warehouse. For example, a marketing manager could ask, "What was our customer acquisition cost by channel last quarter?" and receive an accurate response in seconds, complete with a visual representation of the data. The platform also provides the underlying code for transparency.
The AI doesn't just stop at answering questions - it selects the best chart types for your data and allows users to click on data points for deeper exploration or follow-up queries. Additionally, an AI copilot keeps an eye on live data, flagging anomalies or seasonal trends as they appear. As Enver Melih Sorkun, Co-founder & CTO at Growdash, explains:
"It's not just about saving time and money, it's about making data accessible." [14]
Live, Read-Only Warehouse Connections
Querio enhances its analytics capabilities with secure, live connections to data warehouses like Snowflake and BigQuery. These connections are encrypted and read-only, ensuring data freshness without the need for extracts, copies, or ETL processes. The platform adheres to stringent standards, including SOC 2 Type II, GDPR, HIPAA, and CCPA compliance. Role-based access controls and detailed audit logs ensure every query is tracked, while Querio's design guarantees it never writes to your warehouse or duplicates your data.
Shared Context Layer for Governed Metrics
With Querio's context layer, business definitions, predefined joins, and metric calculations are centralized in one place. For example, when the data team defines metrics like "Monthly Recurring Revenue" or "Churn Rate", everyone - from casual users to advanced analysts - gets consistent answers. This eliminates the confusion caused by departments reporting conflicting numbers for the same KPI. If a metric definition changes, the update is applied universally across all analyses, dashboards, and embedded reports, ensuring consistency and reducing manual effort. These unified metrics power modern business intelligence tools like dynamic dashboards and automated reports, helping teams make informed decisions faster.
Dashboards, Scheduled Reports, and Embedded Analytics
Querio lets teams transform analyses into live dashboards or set up scheduled reports delivered via email or Slack. These aren't static snapshots - they're powered by live data that updates automatically. The platform also supports embedded analytics tools through APIs and iframes, allowing businesses to integrate governed metrics into customer-facing applications. Customers report that Querio reduces data request backlogs for data teams by up to 80% [15], freeing analysts to focus on more strategic projects. By integrating these features, Querio enables teams to turn raw data into actionable strategies in no time.
How to Choose a Self-Service Reporting Tool
What to Consider When Evaluating Tools
When selecting a self-service reporting tool, start by examining its scalability. Can it handle increasing data volumes and a growing number of users without slowing down? Large organizations often need platforms that can support expanding datasets and offer role-based access to accommodate a variety of users[16]. Another key factor is governance capabilities. The tool should provide role-based permissions and a shared semantic layer to maintain data security and consistency, while also preventing unauthorized access[2].
Next, assess the tool's user-friendliness. A platform with an intuitive interface and natural-language querying can empower non-technical users to create reports without requiring SQL knowledge or IT assistance[19][20]. Lastly, compatibility with your existing systems is crucial. The tool should seamlessly connect to your data warehouses, cloud platforms, databases, and enterprise applications like ERP or CRM systems. This ensures real-time data access and avoids creating isolated data silos[17][19]. By focusing on these core considerations, you can narrow down your options and find a tool that aligns with your team's specific operational needs.
Matching Tool Features to Your Team's Requirements
To make the best choice, match the tool's features to the unique needs of your team. If real-time tracking of KPIs and trends is essential, prioritize tools that connect directly to your data warehouse for live updates[17][19]. For teams with limited technical skills, natural-language querying tools can be a game-changer, allowing users to ask questions and get instant insights without technical hurdles[2][20].
If multiple departments share dashboards, a robust semantic layer is indispensable. It ensures that key metrics like "Monthly Recurring Revenue" or "Churn Rate" are defined consistently across all analyses[16]. To ensure the tool meets your needs, test it with scenarios like quick what-if analyses for sales forecasts. This hands-on approach can reveal how well the tool performs in real-world situations.
Why Querio Fits Growing Business Teams
Querio is an excellent choice for growing business teams, meeting all the criteria discussed above. Its AI-powered analytics, live read-only connections, and governed metrics simplify operations and enable faster decision-making. Querio's AI translates plain-English queries into SQL and Python, making data accessible even to non-technical users[2]. The platform supports secure, real-time data access that scales effortlessly as your team grows[17]. Additionally, its shared context layer ensures consistent metrics and role-based controls across the organization[16]. By reducing reliance on IT for report generation, Querio empowers teams to work independently, much like other self-service BI tools that have significantly cut down IT requests[18][19].
Conclusion
Self-service reporting has reshaped how business teams access and utilize data. By offering direct access to live data, these platforms empower teams to make quicker, more informed decisions. Reports that once took days to compile can now be generated in minutes, and KPIs are monitored in real time. This shift paves the way for streamlined, real-time decision-making across organizations.
The success of self-service analytics lies in finding the right balance between empowering users and maintaining governance. Platforms that combine intuitive tools like natural-language querying with governance features - such as role-based access controls and shared semantic layers - help prevent data inconsistencies. This approach ensures everyone uses the same definitions and metrics, avoiding the confusion of conflicting reports while fostering data-driven decisions.
Querio stands out as a prime example of AI-driven analytics that prioritize both precision and control. With live, read-only connections to data warehouses, it delivers real-time insights without compromising data integrity. Its shared context layer ensures that metrics remain consistent across all analyses. As Jennifer Leidich, Co-Founder & CEO of Mercury, highlighted:
"What used to be a week-long process now takes minutes." [14]
To experience these benefits firsthand, consider launching a pilot program. Connect your data warehouse to shared dashboards and test the platform with real-world scenarios like sales forecasting or campaign performance tracking. This hands-on approach can quickly showcase improvements in decision-making speed and accuracy while ensuring smooth integration into your team's workflows.
Self-service reporting is more than just a technological advancement - it democratizes data access and enforces consistent, trusted metrics. Querio’s ability to deliver real-time insights and unified metrics helps organizations shift from reactive reporting to proactive, strategic analysis.
FAQs
How do self-service reporting tools enhance collaboration within teams?
Self-service reporting tools transform data analysis into a team effort by giving everyone the ability to access and explore data on their own. With a centralized, well-managed data source and consistent metrics, all team members rely on the same accurate information. This reduces confusion and helps teams align on insights more quickly.
These tools are designed to empower non-technical users, allowing them to create visualizations and dashboards without writing a single line of code. This capability encourages real-time discussions and faster decision-making. Some platforms even include AI-driven assistants that simplify complex queries, enabling users to generate reports in no time. Meanwhile, analysts can dedicate their efforts to more in-depth analysis.
By integrating insights directly into the tools teams already use, these platforms keep everyone on track, making collaboration smoother and helping organizations make smarter decisions faster.
What features should I look for in a self-service reporting tool for my business team?
When selecting a self-service reporting tool, focus on features that make it easier for non-technical users to access and interpret data on their own. Tools with natural language querying are a big win - these let users type questions in plain English, skipping the need for any technical know-how. Another must-have? Automated visualizations that instantly transform data into charts or dashboards, delivering quick and clear insights.
It’s also important to pick a platform that offers real-time data access from live databases. Seamless integration with your current data systems ensures smoother workflows and eliminates unnecessary duplication. Don’t overlook governance and security features either - role-based permissions and centralized metric definitions help keep data accurate and secure.
Lastly, go for a tool that encourages collaboration. Features like shared dashboards, commenting, and team-based workflows can make working together more efficient. Bonus points if the tool allows you to embed insights directly into the software your team already relies on, further simplifying decision-making and boosting productivity.
How does natural-language querying make data easier to access for business teams?
Natural-language querying simplifies how business users interact with data by letting them ask questions in plain English - no need for technical expertise like SQL or navigating clunky interfaces. With Querio, you can type something as straightforward as “What were the total sales by region last quarter?” The AI takes care of the heavy lifting, instantly converting your question into a query, pulling live data, and displaying it as an easy-to-read chart or table. It’s a fast and intuitive way to make data accessible to everyone.
Querio goes a step further by embedding this conversational functionality into the tools teams already use. Users can tweak their questions on the fly and see updated visuals in real time. This feature enables teams in marketing, finance, and operations to dive into data independently and make well-informed decisions without delay. The result? A workplace where data insights are available to everyone, fostering collaboration and smarter decision-making across the board.
Related Blog Posts