Business Intelligence
Embedded Self-Serve Analytics: the Ultimate Guide
Embedded self-serve analytics brings real-time, in-app data to teams, cutting IT bottlenecks and speeding decisions across sales, product, and finance.
Embedded self-serve analytics allows users to access and analyze data directly within the tools they already use - no technical support required. By integrating analytics into everyday workflows like CRMs or project management tools, businesses save time, reduce bottlenecks, and empower teams to make faster decisions. This guide breaks down how it works, why it matters, and how to implement it effectively.
Key Takeaways:
What It Is: Analytics embedded into software applications for user-friendly, real-time insights.
Why It Matters: Speeds up decision-making, reduces reliance on data teams, and improves productivity.
Core Features: Real-time data, customization, security, and scalability.
Implementation Steps: Start small with a pilot, gather feedback, then scale with continuous improvements.
Use Cases: Sales, product development, and financial reporting automation tools benefit from integrated analytics.
By embedding analytics into your tools, you can eliminate delays, empower teams, and focus on strategic goals.
Embedded Analytics: The Ultimate Guide to Unlock the Power of Data
Core Features of Embedded Self-Serve Analytics
An effective embedded analytics platform goes beyond offering visually appealing charts. It needs to make data exploration seamless, secure, and tailored to the way your teams work. Let’s explore the key features that elevate a platform from functional to exceptional.
Real-Time Data Access and Visualization
When users open an analytics dashboard, they expect to see up-to-the-minute insights. Real-time data access ensures dashboards pull directly from your data warehouse, delivering the latest information with every query. Interactive visualizations further enhance this experience, allowing users to filter, drill down, and quickly identify trends. This is especially critical for time-sensitive decisions, like monitoring how users are engaging with a newly launched feature.
The best platforms don’t stop at providing current data - they also fit seamlessly into individual workflows.
Customization and Personalization
Generic dashboards often fail to meet diverse user needs. A strong analytics platform allows users to tailor their experience by choosing metrics that matter to them, arranging widgets to suit their workflow, and saving custom filters for future use. For example, a finance manager might focus on revenue segmented by region and payment terms, while a support lead prioritizes ticket resolution times and customer satisfaction metrics. This flexibility ensures users can focus on the data that drives their decisions.
Governance and Security Features
While personalization improves usability, robust security safeguards your data. Granular controls ensure users only access the information they’re authorized to see. For instance, row-level security limits a regional manager’s view to their specific territory, while column-level restrictions can hide sensitive fields like salary data from unauthorized users. Role-based access control streamlines security management by tying permissions to job functions, making it easier to adapt as team structures change.
Data encryption - whether at rest or in transit - adds another layer of protection, securing information as it moves between your data warehouse and end users. For industries with strict regulations, compliance with embedded analytics security frameworks like GDPR, HIPAA, SOC 2, and CCPA is non-negotiable. Platforms designed with security in mind can help businesses achieve compliance certifications up to 60% faster compared to retrofitting security later.[1] Features like Single Sign-On and multi-factor authentication simplify access while enhancing security, and audit logs provide a detailed record of who accessed what data and when - essential for compliance reviews and internal investigations.
These foundational features pave the way for evaluating the best approach - whether building, buying, or opting for a hybrid solution - in the next section.
Build vs. Buy vs. Hybrid: Choosing Your Approach
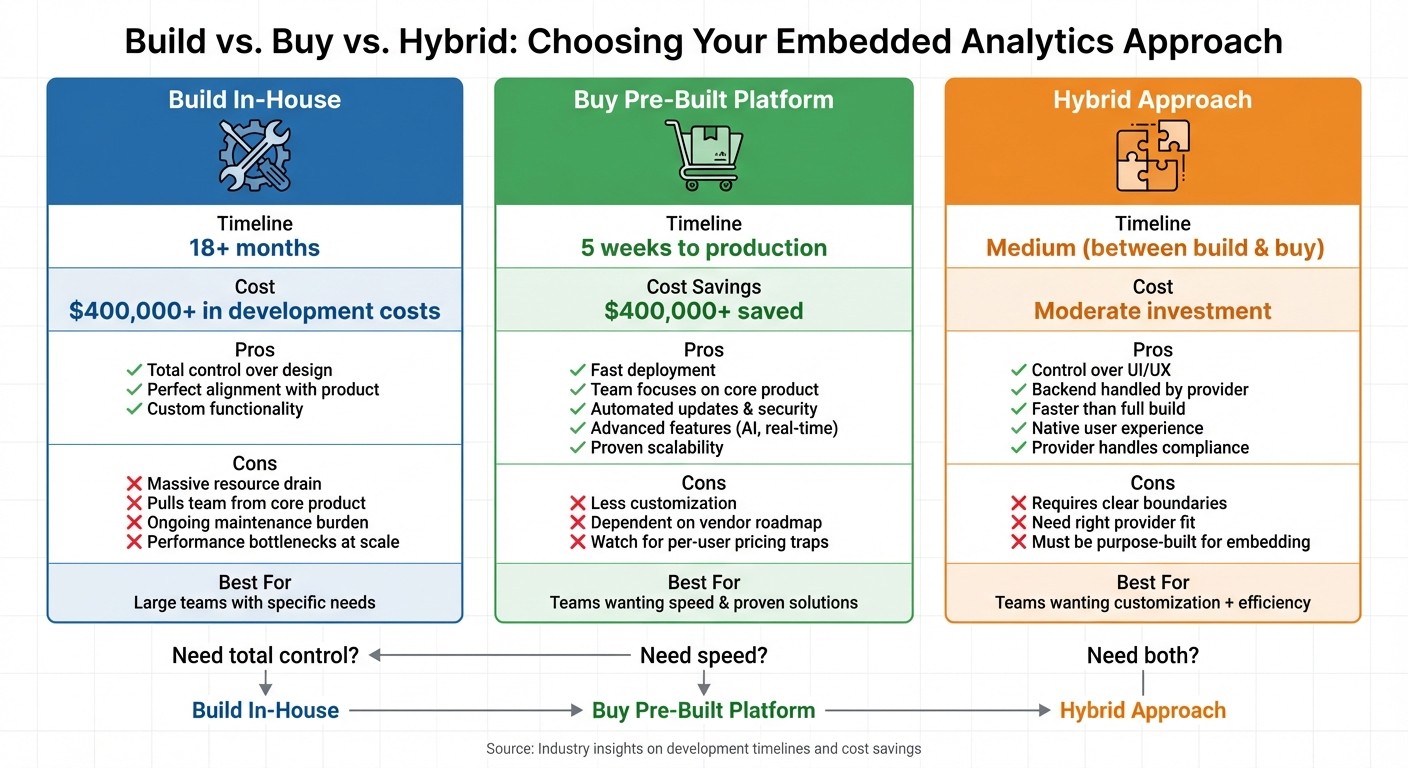
Build vs Buy vs Hybrid Embedded Analytics: Cost, Time & Feature Comparison
With your core features mapped out, it’s time to decide the best way to deliver embedded analytics. Should you build everything in-house, purchase a ready-to-use solution, or take a hybrid route? Each option comes with its own trade-offs in terms of cost, time, and flexibility.
Pros and Cons of Building In-House
Building your own embedded analytics platform gives you total control over every aspect, from design to functionality. This means you can create an interface that perfectly aligns with your product’s style and user experience, without being restricted by a vendor’s roadmap or pricing structure. It’s an appealing option for companies with specific needs or those with large engineering teams already in place.
However, building in-house is a massive undertaking. It often takes over 18 months and can easily exceed budgets[1]. What starts as a simple dashboard can quickly grow into a complex system, requiring features like exports, scheduled reports, and self-service exploration. This can pull critical resources away from your core product. For startups with limited staff and funding, matching the capabilities of a pre-built platform can be an uphill battle. Plus, maintaining such a system over time can be a continuous drain on resources. If scaling isn’t baked into a multi-tenant embedded analytics architecture from the beginning, performance bottlenecks are almost inevitable as user demand increases.
Advantages of Buying a Pre-Built Platform
A pre-built solution can deliver production-ready analytics in as little as five weeks, potentially saving companies over $400,000 in development costs[1]. By choosing this route, your engineering team can stay focused on enhancing your core product instead of building analytics infrastructure from the ground up.
Beyond the initial setup, pre-built platforms ease the burden on IT teams with features like automated updates, built-in security, and proven scalability. They also offer advanced functionalities - think AI-driven queries, real-time data visualizations, and governance tools - that would be time-consuming and costly to replicate in-house. The key is to find a platform with predictable pricing. Be cautious of per-user licensing models when evaluating embedded analytics tools, as they can become unsustainable when embedding analytics for thousands of users. Instead, look for pricing that grows with your business without limiting scalability.
For those who want both speed and customization, a hybrid approach might strike the right balance.
Evaluating Hybrid Approaches
Hybrid models aim to combine the best of both worlds: the flexibility of custom development with the efficiency of pre-built tools. A popular option is headless embedded analytics architecture, where you maintain complete control over the user interface while relying on a third-party backend for data processing, security, and governance. This approach allows you to deliver a seamless, native experience with less engineering effort and faster load times compared to traditional embedded BI tools that depend on iframes.
That said, hybrid approaches require clear boundaries and well-defined roles between your team and the provider. When done right, this model lets you focus on customizing features that matter most to your users while outsourcing the heavy lifting of infrastructure, compliance, and maintenance. It’s a user-focused solution that benefits from the provider’s expertise, ensuring real-time insights without sacrificing scalability or performance. Just make sure the platform you choose is purpose-built for customer-facing analytics - many traditional BI tools fall short when it comes to the performance and user experience demands of large-scale embedding.
[1] Source: Aggregated industry insights on development timelines and cost savings.
Steps for Implementing Embedded Self-Serve Analytics
Rolling out embedded self-serve analytics effectively takes time and careful planning. Trying to implement it across your entire organization all at once often leads to poor adoption, frustrated users, and wasted resources. Instead, break the process into three phases. This phased approach ensures a smooth rollout that builds on early successes and sets the stage for long-term scalability.
Phase 1: Planning and Requirements Gathering
Start by pinpointing your users' biggest pain point - the one issue causing the most frustration or generating the highest volume of support requests. For example, if your sales team frequently asks for custom revenue reports, that’s a clear starting point. Focusing on a single issue helps you address the most pressing need first.
Bring together a cross-functional team that includes product sponsors, project managers, developers, and representatives from key departments like sales, marketing, and QA. Assess your team's BI skills and close any gaps with training or new hires. Establish realistic timelines and a clear budget that accounts for both initial setup and ongoing support. Keep in mind that poor data quality costs companies an average of $12.9 million annually, so addressing data quality issues early is critical. This phase sets the foundation for empowering users right from the start.
Phase 2: Pilot Launch and User Training
Choose a small pilot group with genuine analytical needs and a strong interest in using the tools. Define clear success criteria - what does success look like for this rollout? Offer dedicated support during this phase and collect detailed feedback on the user experience. Studies show that if users can’t figure out an analytics tool within five minutes, they’re unlikely to return, so pay close attention to where they get stuck.
Identify and empower analytics champions within the pilot group. These individuals can help drive adoption and collect feedback across teams. Provide pre-built templates with key metrics and branding to make onboarding faster. Use in-app guidance and interactive tutorials to ease the learning curve - 88% of users expect self-service options, so making the tools intuitive is key.
Track adoption metrics weekly during the pilot. Measure things like monthly active users, login frequency, and the reduction in IT data requests. A successful pilot often results in a 40–60% drop in manual data requests and over a 50% improvement in time-to-insight. Document lessons learned and use these insights to refine your broader rollout.
Once the pilot proves successful, use the feedback to improve and expand the deployment.
Phase 3: Scaling and Continuous Improvement
As you scale, open access to more users but keep the support structures that made the pilot successful. Ensure your infrastructure can handle increased usage, a variety of analysis needs, and growing data volumes without performance issues. Adopt a "data as a product" mindset to establish a single source of truth for the entire organization.
Keep gathering feedback through multiple channels. Use in-app microsurveys for immediate reactions, hold roundtables with power users for operational input, and schedule regular check-ins with department leaders to align on strategy. Review survey feedback weekly and adjust training materials or interface designs based on what you learn. Encourage users to share their thoughts regularly.
Monitor system performance as adoption grows. Watch for slow query times, failed reports, or data processing bottlenecks. By focusing on real-time access and personalization, you can maintain a strong user experience as your solution scales. Keep tracking adoption metrics to ensure your analytics tools are boosting productivity rather than becoming just another underused dashboard.
Use Cases and Practical Applications
With embedded self-serve analytics, teams can access integrated insights instantly, right within the tools they already use. This eliminates the need to wait for reports or submit requests, enabling faster, data-driven decisions.
Sales and Revenue Analytics
Embedded analytics give sales teams the ability to identify high-value customer segments and focus on quality leads. By integrating analytics directly into CRM platforms, sales reps can monitor pipeline performance, forecast revenue, and adjust strategies based on real-time data.
Sales managers also benefit by gaining a clearer picture of product performance and market trends. Instead of relying on intuition, they can make decisions grounded in actual performance metrics, refining strategies to boost results. Similarly, product teams leverage these tools to enhance features and drive user engagement.
Product and Feature Analytics
Product teams can use embedded analytics to track how users interact with features, identify areas of friction, and make quick improvements. Metrics like adoption rates, session duration, and retention provide actionable insights.
These insights help prioritize the product roadmap, focusing on what has the most impact. Additionally, finance teams can use embedded analytics to streamline their workflows, particularly in reporting and KPI tracking.
Financial Reporting and KPI Management
Finance teams integrate dashboards into ERP and accounting systems, providing near real-time visibility and reducing the need for manual data collection. This automation speeds up month-end closes and enhances accuracy.
Instead of spending time gathering data, finance professionals can focus on analysis. Continuous tracking of key performance indicators allows teams to quickly identify variances and respond. When executives need updated forecasts or explanations, finance teams can deliver answers in minutes rather than days.
Conclusion and Key Takeaways
Recap of Benefits and Best Practices
Embedded self-serve analytics removes IT bottlenecks and equips teams with the ability to access real-time insights. By integrating analytics directly into their workflows, sales, product, and finance teams can make quicker, informed decisions based on up-to-date data.
Achieving success with embedded analytics requires thoughtful planning and strong governance. Start by evaluating your organization's needs, pinpointing critical data sources, and identifying where AI-driven analysis can have the most impact. Establish clear data standards, enforce robust security protocols, and ensure your infrastructure is scalable to handle future growth.
This approach lays the groundwork for a phased implementation supported by continuous feedback.
Next Steps for Implementation
To begin, take a fresh look at your current analytics processes. Identify repetitive, time-consuming reporting tasks and areas where self-service dashboards can simplify workflows - like tracking campaign performance or monitoring sales trends by region.
Follow a structured implementation guide, starting with a pilot program. Choose a small team to test the system, provide them with extra support, and actively gather their feedback. This phased approach allows you to fine-tune your strategy, address challenges early, and build momentum with initial successes. Keep in mind that over 70% of business data goes unanalyzed due to limitations of traditional tools[2]. Embedded self-serve analytics changes the game by making insights accessible right where the work happens.
FAQs
What are the key advantages of using embedded self-serve analytics for my team?
Embedded self-serve analytics puts data-driven insights right at your team's fingertips, allowing them to make quicker, smarter decisions without needing help from IT or data experts. This approach doesn’t just save time - it encourages a mindset focused on innovation and informed choices.
By weaving analytics directly into daily workflows, you can improve usability, simplify operations, and expand analytics capabilities as your business evolves. It’s an effective way to eliminate bottlenecks, increase productivity, and equip everyone with the resources they need to thrive.
What’s the best way to choose between building, buying, or combining approaches for embedded analytics?
Choosing how to implement embedded analytics hinges on your business objectives, available resources, and timeline. If your needs are highly specific and you have a skilled technical team, building a custom solution can give you maximum flexibility. However, if getting to market quickly is your priority, buying a pre-built platform may be the smarter choice, as it comes with ready-to-use features.
A hybrid approach offers a balanced alternative. It allows you to customize certain elements while using pre-built tools to speed up deployment. To decide, assess your team’s expertise, budget, and the complexity of your analytics requirements. Look for solutions that not only align with your long-term vision but also deliver quick, tangible results to showcase value early in the process.
What steps should I take to implement embedded self-serve analytics in my organization?
To make embedded self-serve analytics work effectively, begin by assessing your organization's readiness. This means looking at your current data infrastructure and understanding what your users need. Choose tools that incorporate natural language processing and automated insights to simplify analytics and make them easier for everyone to use.
Start with projects that can deliver quick wins and show clear value. Protect your data by using role-based access controls, ensuring that only the right people have access to sensitive information. Offer customized training programs so users can get the most out of these tools.
Keep an eye on how things are going by tracking user engagement and tangible business results. Use this feedback to fine-tune your approach and boost adoption where needed.
Related Blog Posts