Business Intelligence
Best AI Analytics Tools That Connect to Snowflake, BigQuery, and Databricks (2026)
Pick native warehouse AI or a governed cross-warehouse layer; focus on inspectable SQL, semantic layers, and governance.

If your data sits in more than one warehouse, native AI tools usually fall short. From what I see in this article, the top picks split into two groups: native tools for single-warehouse teams and cross-warehouse tools for teams using Snowflake, BigQuery, and Databricks together.
Here’s the short version:
- Querio, ThoughtSpot, Sigma, and Omni fit mixed-warehouse setups
- Databricks Genie fits Databricks-only teams
- Snowflake Cortex Analyst fits Snowflake-only teams
- Hex fits analyst-led notebook work
- Looker and Power BI fit teams that already work inside those ecosystems
- The biggest buying checks are live warehouse access, inspectable SQL, semantic layer support, and governance
The article also points to a few hard facts that shape the choice:
- Databricks Genie has a 30-table limit per space
- Snowflake Cortex Analyst can hit 90%+ SQL accuracy with a strong semantic model
- ThoughtSpot is priced from $25/user/month
- Hex runs about $36–$75/editor/month
- Querio highlights SOC 2 Type II and a 99.9% uptime SLA
If I had to reduce the whole piece to one line, it would be this: pick a native tool if your stack is fixed, and pick a governed cross-warehouse layer if it isn’t.
::: @figure 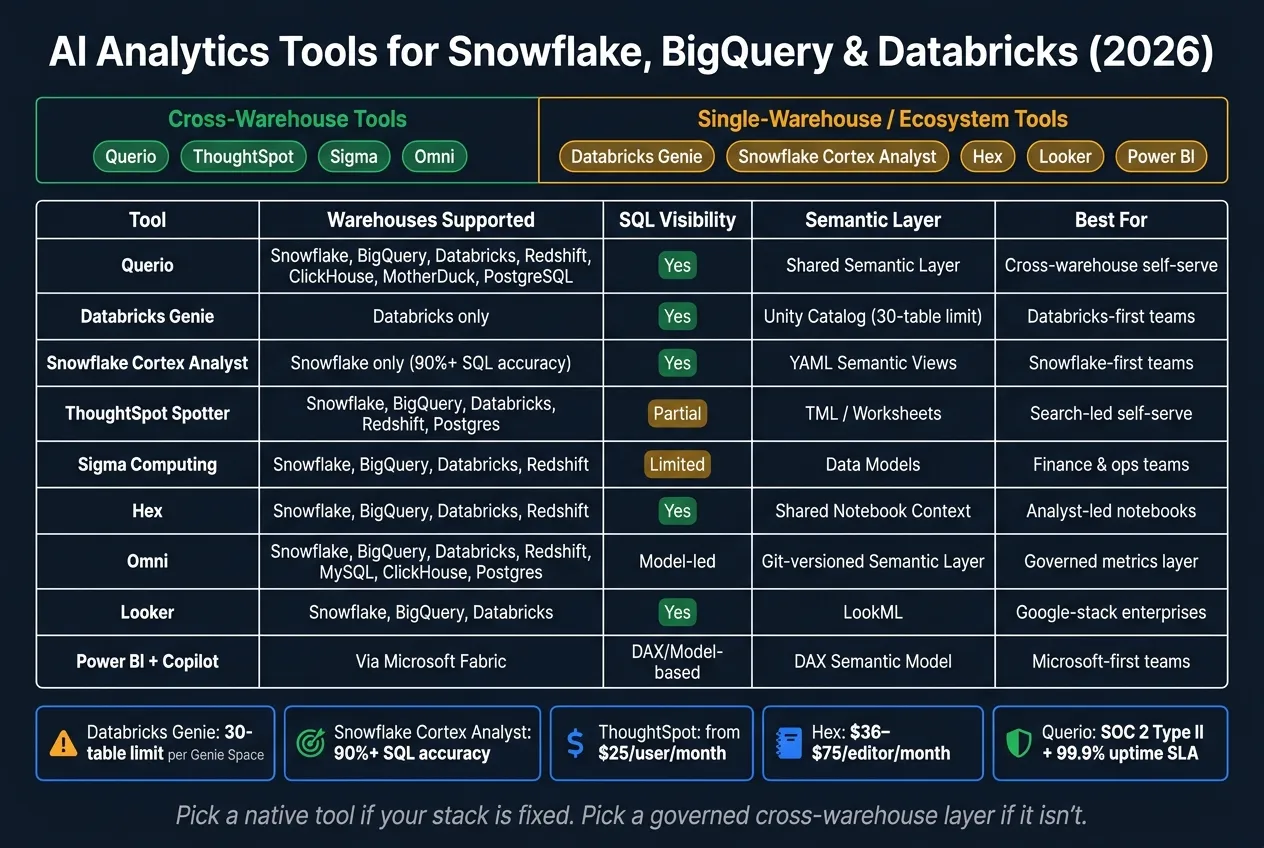 {AI Analytics Tools for Snowflake, BigQuery & Databricks: 2026 Comparison}
:::
{AI Analytics Tools for Snowflake, BigQuery & Databricks: 2026 Comparison}
:::
Supercharge Analytics with Snowflake AI Functions, Document Intelligence & Semantic Modeling
::: @iframe https://www.youtube.com/embed/MdlEisZniKI :::
Quick Comparison
| Tool | Best for | Warehouses | SQL visibility | Semantic/governed layer |
|---|---|---|---|---|
| Querio | Cross-warehouse self-serve | Snowflake, BigQuery, Databricks, more | Yes | Shared semantic layer |
| Databricks Genie | Databricks-first teams | Databricks only | Yes | Unity Catalog |
| Snowflake Cortex Analyst | Snowflake-first teams | Snowflake only | Yes | YAML Semantic Views |
| ThoughtSpot Spotter | Search-led self-serve | Snowflake, BigQuery, Databricks, more | Partial via inspectors | TML / Worksheets |
| Sigma | Spreadsheet-style analysis | Snowflake, BigQuery, Databricks, Redshift | Limited | Data Models |
| Hex | Analyst notebooks | Snowflake, BigQuery, Databricks, Redshift | Yes | Shared notebook context |
| Omni | Governed metrics layer | Snowflake, BigQuery, Databricks, more | Model-led | Git-versioned semantic layer |
| Looker | LookML-based governance | Snowflake, BigQuery, Databricks | Yes | LookML |
| Power BI with Fabric/Copilot | Microsoft-first teams | Via Fabric | DAX/model-based | DAX semantic model |
What I like about this comparison is that it does not judge tools by AI chat alone. It focuses on the stuff that matters in day-to-day use: where queries run, whether users can check the SQL, and how teams build a semantic layer to keep metric definitions from drifting.
1. Querio
Querio is an AI analytics workspace built for governed self-serve on live Snowflake, BigQuery, Databricks, Redshift, and PostgreSQL data. It also supports ClickHouse and MotherDuck. So teams can get governed access to live warehouse data without copying or moving it.
Warehouse Connectivity
Querio connects live, read-only to your warehouse using encrypted credentials. Queries run directly on live warehouse data.
Semantic Layer
Querio’s shared semantic layer lets data teams define joins, metrics, and business terms once. That way, definitions stay the same across the workspace.
Governance Fit
Querio is SOC 2 Type II compliant and includes a 99.9% uptime SLA, role-based access controls, and standard SSO integrations [5].
AI Analytics Workflows
Once governance is set, users can work in natural language while analysts still see and edit the code. Business users ask questions in plain English in chat or Slack, and Querio turns those questions into SQL or Python, shows the code, and lets analysts adjust it.
For more in-depth work, reactive notebooks help data teams build reusable analysis that updates as upstream logic changes. Teams can then share outputs as dashboards, scheduled reports, or embedded experiences through APIs or iframes.
2. Databricks Genie
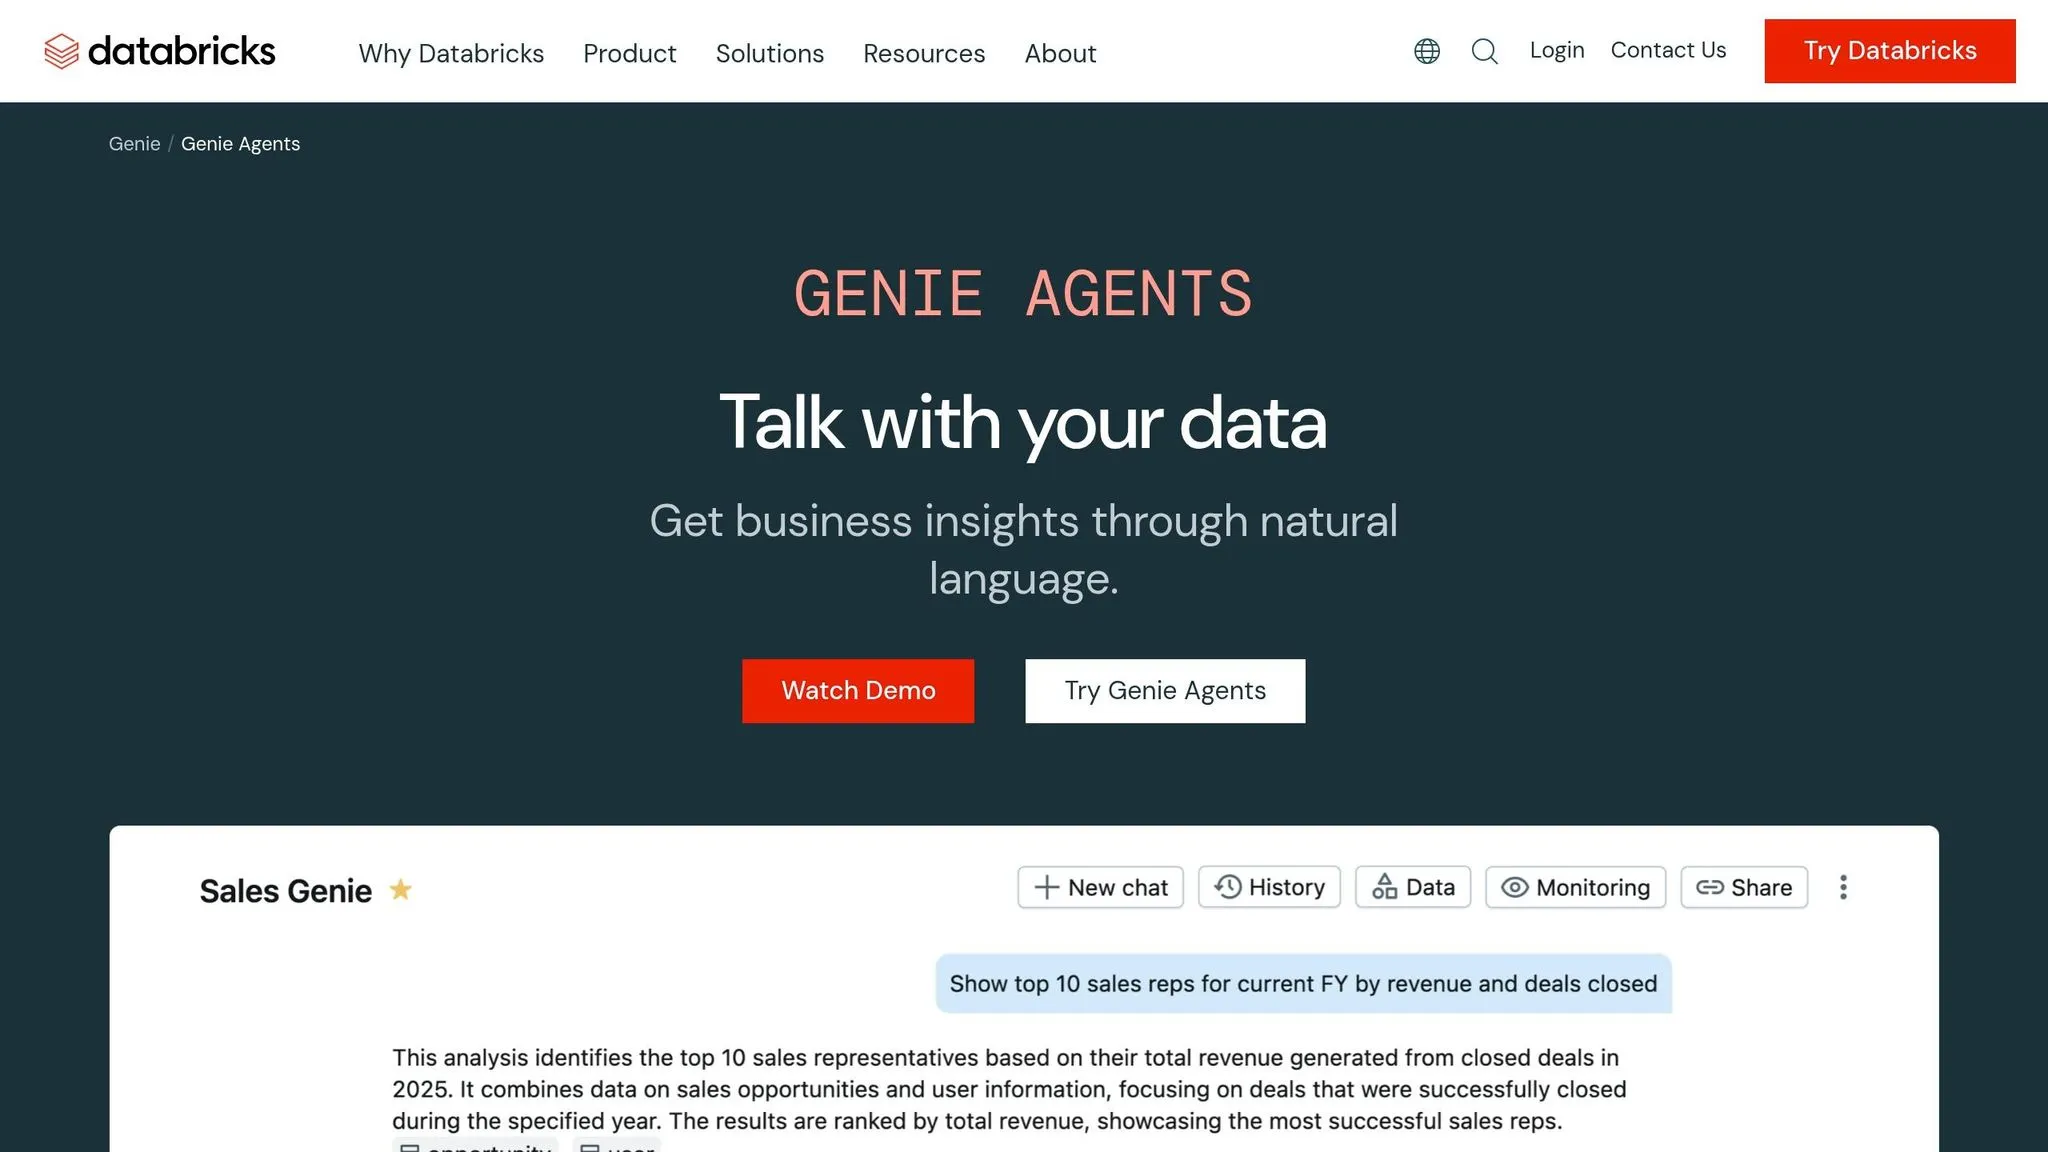
Databricks Genie is Databricks’ built-in natural-language analytics layer. It makes the most sense for teams that already store their data and governance in Databricks.
Warehouse Connectivity
Genie can query data in Databricks only. If your data lives in Snowflake or BigQuery, you need to copy it into Databricks first. That makes live analysis harder in mixed-warehouse setups.
For teams that need live access across Snowflake, BigQuery, and Databricks, that consolidation step is the main trade-off.
Semantic Layer
Genie Spaces are capped at 30 tables [1]. Semantic definitions come from Unity Catalog, and teams keep accuracy on track through manual tuning [1].
That puts a limit on how much context one space can hold before teams have to split work across multiple spaces.
Governance Fit
Governance is handled through Unity Catalog, including row-level and column-level security [1].
AI Analytics Workflows
Business users can ask questions in plain English inside Genie Spaces. Analysts can then review and adjust the generated output in a code editor [1].
Genie also supports the Model Context Protocol (MCP). That means external agents like Claude or ChatGPT can work with Databricks data while still following Unity Catalog access controls [4].
So Genie is at its best for Databricks-first teams. The next tools become more relevant when data is spread across multiple warehouses.
3. Snowflake Cortex Analyst
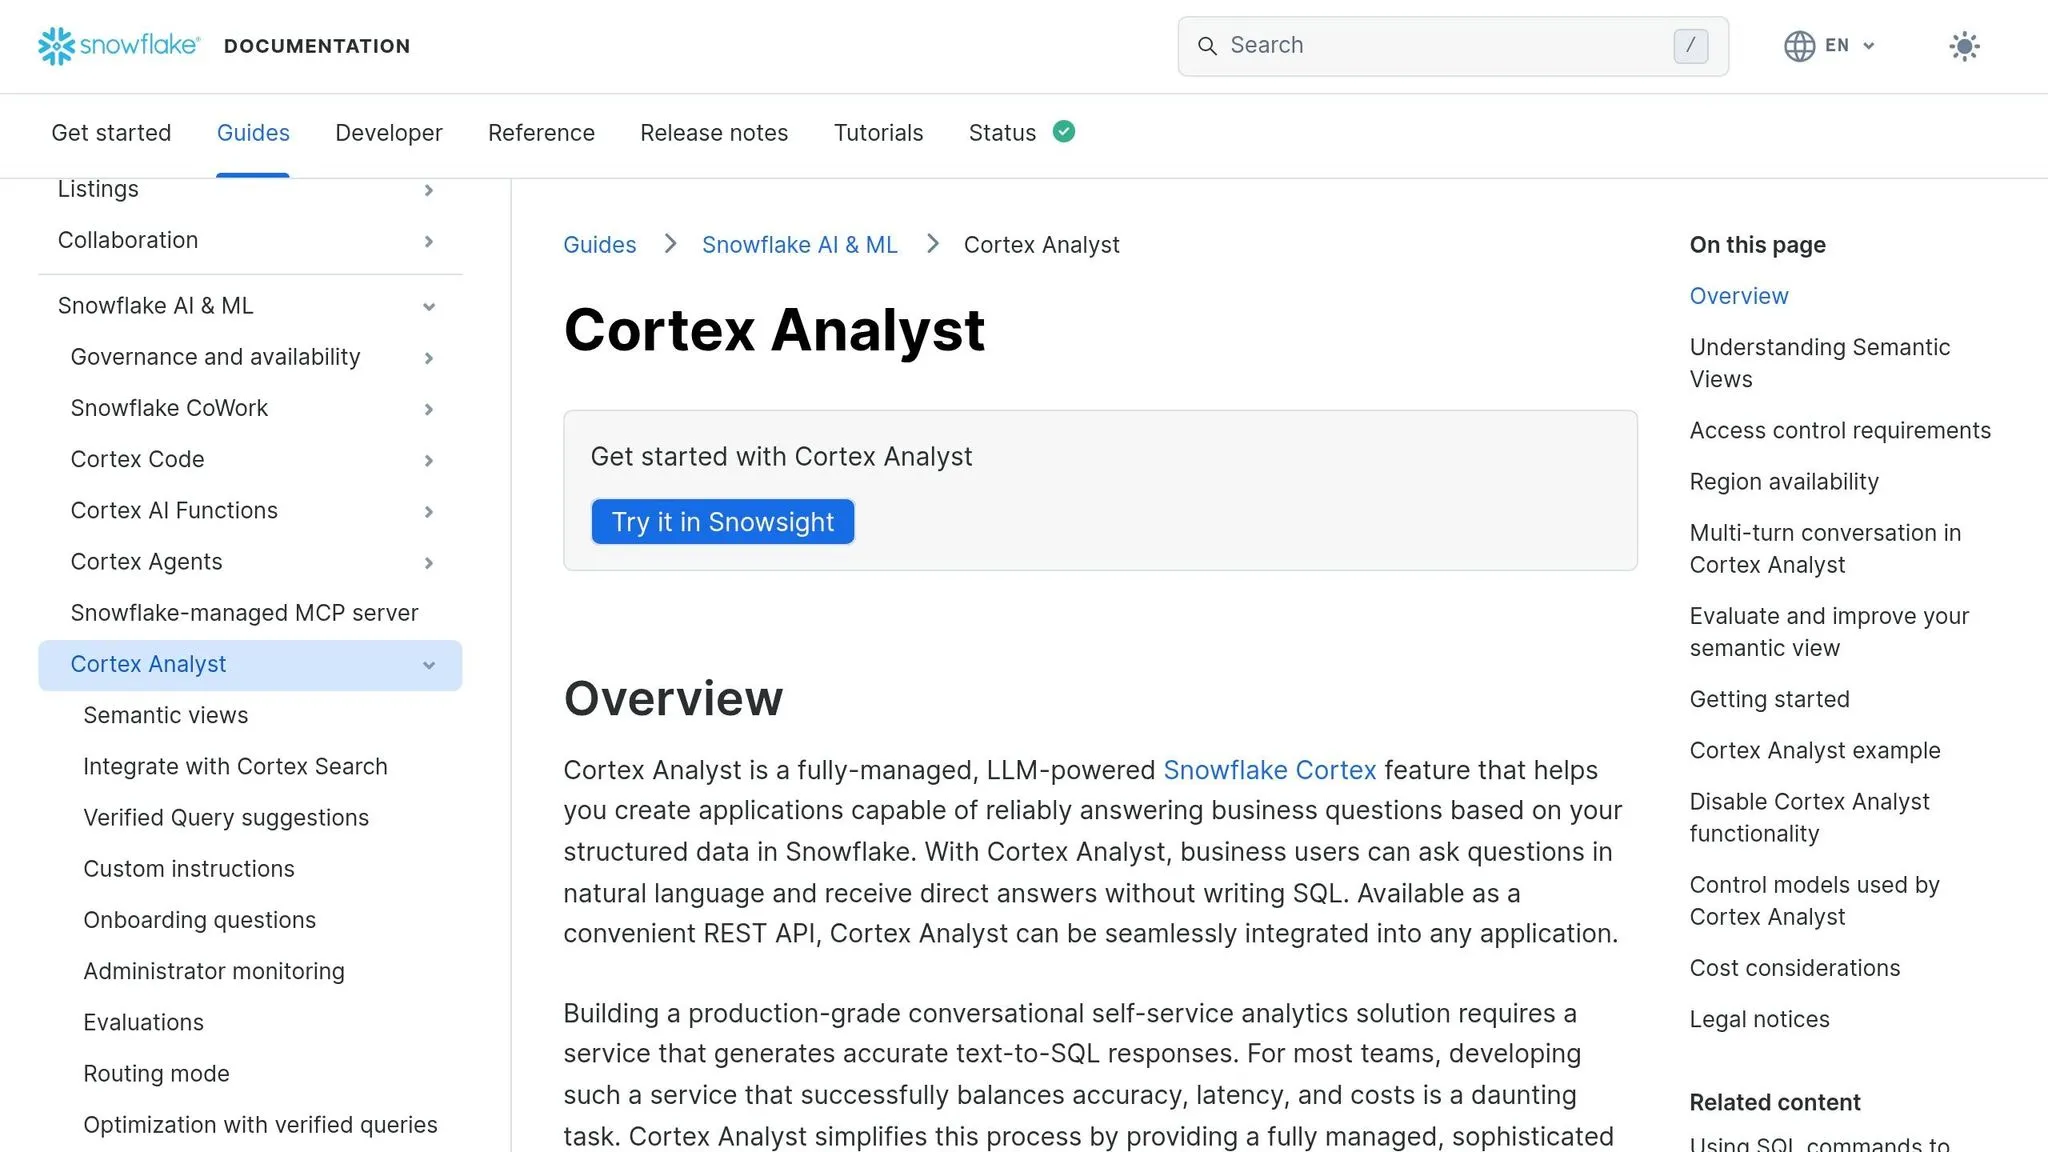
Snowflake Cortex Analyst is Snowflake’s native natural-language query layer for teams that already keep their data and governance inside Snowflake.
Warehouse Connectivity
Cortex Analyst queries data in Snowflake only. If your data lives in BigQuery, Databricks, or Redshift, you need to move it into Snowflake first. So for live analytics, this is a Snowflake-only setup.
Semantic Layer
Cortex Analyst uses YAML-based Semantic Views to map business terms to logical tables, dimensions, facts, metrics, and relationships. That mapping helps keep definitions like Daily Active Users steady across different questions.
"Semantic Views provide a semantic layer over your data by defining logical tables, dimensions, facts, metrics, and relationships. This metadata improves the accuracy and reliability of generated SQL." - Snowflake Documentation [6]
With a well-built semantic model, Cortex Analyst can reach 90%+ SQL accuracy in live use cases [2].
Governance Fit
Cortex Analyst inherits Snowflake’s native Role-Based Access Control (RBAC) and supports row-level and column-level security. That means access policies are enforced at query time, not patched on later.
AI Analytics Workflows
Cortex Analyst is API-first, so teams can embed it into custom apps, including Streamlit. That’s handy if you want to build your own interface instead of forcing people into one preset workflow. Technical users can also inspect the generated SQL before passing results along to business users [6].
It also supports the Model Context Protocol (MCP). In plain English, tools like Claude or ChatGPT can query Snowflake data through the Cortex interface while still following the access controls already in place [4][1].
Pricing is 67 credits per 1,000 messages through the API, plus standard Snowflake warehouse compute costs for query execution [1].
Cortex Analyst is strongest for Snowflake-first teams with a mature semantic model. If your team needs support across more warehouses, or wants a different way to work with governed AI analytics, the next tools take a different path.
4. ThoughtSpot Spotter
ThoughtSpot Spotter is a search-first analytics platform built for business users who want to ask questions in plain English against live warehouse data. That makes it a strong match for teams that want governed self-serve analytics without moving data out of their current warehouse setup.
Warehouse Connectivity
Spotter connects live to Snowflake, BigQuery, Databricks, Redshift, and Postgres. It also works across mixed-warehouse setups, which matters if your data lives in more than one place instead of sitting neatly in a single platform.
Semantic Layer
Spotter uses ThoughtSpot Modeling Language (TML) and Worksheets to connect business terms to the tables and relationships underneath. On top of that, SpotterModel automates parts of the semantic layer, which helps data teams set up synonyms, metrics, and joins so business definitions stay consistent from one question to the next.
Governance Fit
Spotter applies Row-Level Security (RLS) and Column-Level Security (CLS) at query time. If someone wants to see how an answer was built, Answer Explainer and Query Inspector show the calculation path and the fields used. That extra visibility can save a lot of back-and-forth.
AI Analytics Workflows
The workflow is simple: a user asks a question, and Spotter returns a visual answer. If the answer misses the mark, Spotter Coach lets users flag the issue and help tune how the AI responds over time. Teams can share results through Liveboards, and the Visual Embed SDK makes it possible to embed Spotter inside SaaS products.
Its sweet spot is clear: teams that want search-driven analytics, governed outputs, and light setup.
In early 2026, WEX Field Service Management rebranded Spotter as AssistIQ and reported 65% AI adoption in 90 days and 30x faster report-generation time [6]. Gartner Peer Insights rates Spotter at 4.6/5 based on 408 reviews [5].
Pricing is tiered:
- Essentials: $25/user/month
- Pro: $50/user/month or $0.10/query
- Enterprise: Custom
Teams that want a different workspace style should look at the next option.
5. Sigma Computing
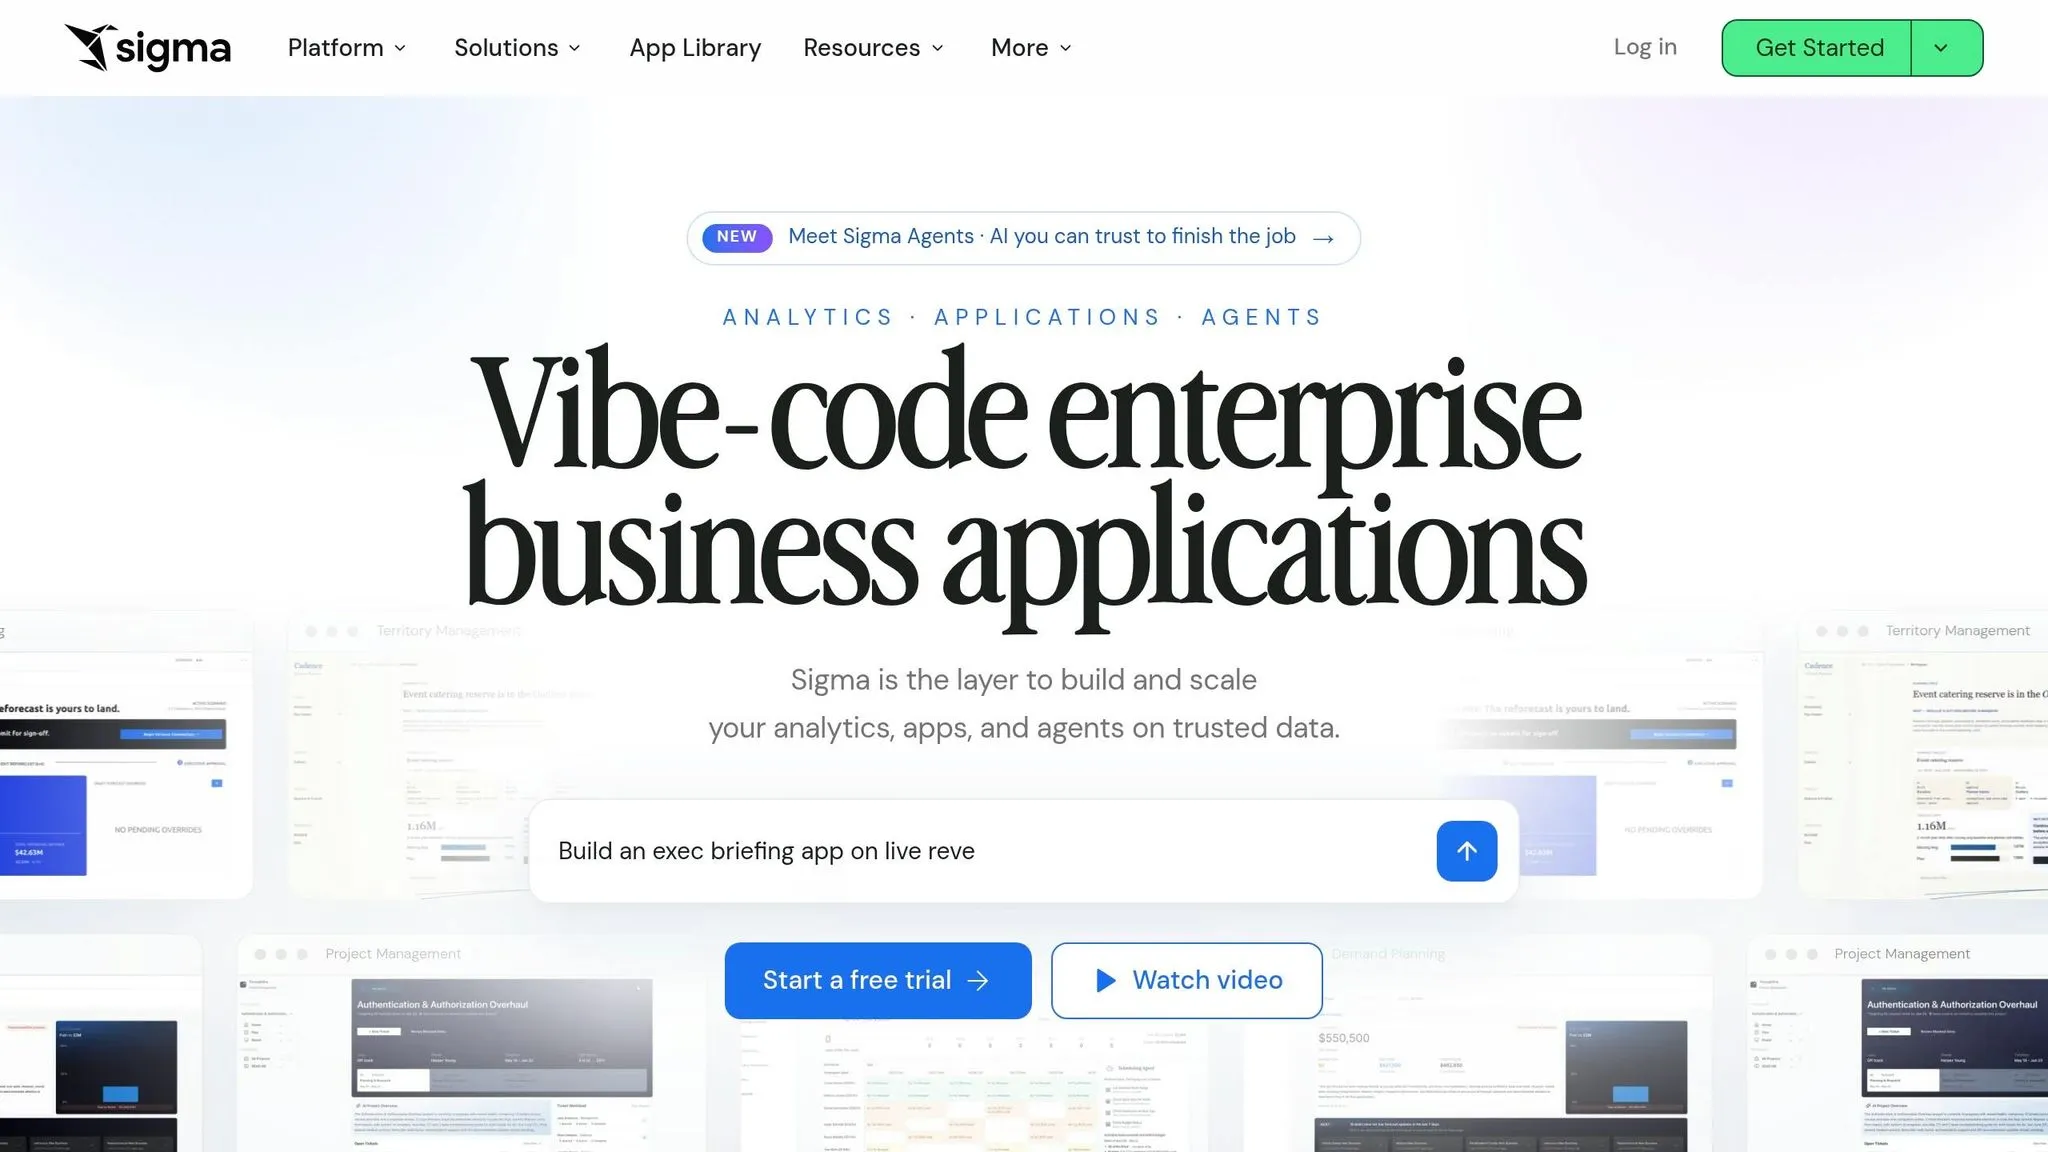
Sigma is the workbook-first pick in this group. It uses a spreadsheet-style workbook to analyze live warehouse data, which makes it a strong fit for teams that want governed, warehouse-native self-serve analytics in a format that feels familiar. If your finance or operations team already lives in rows, columns, and formulas, Sigma feels pretty natural.
Warehouse Connectivity
Sigma connects natively to Snowflake, BigQuery, Redshift, and Databricks, so teams can work with live data without using extracts.
Semantic Layer
Sigma’s Data Models set up metrics, relationships, and lineage before people start digging into the data. If your team is coming from LookML, Sigma may feel a bit less rigid.
Governance Fit
Sigma supports user attribute-based Row-Level Security (RLS) and also inherits security settings from the underlying warehouse. That keeps permissions in sync without giving your team another permission layer to manage.
AI Analytics Workflows
Users can ask natural-language questions inside a workbook and get formula suggestions or follow-up analysis back. Business users work inside the workbook, while analysts keep control through the underlying model and SQL view. More technical users can inspect SQL in a SQL view, but the workbook remains the default place to analyze data.
Pricing is quote-based.
If your team wants a notebook-first workflow, move to the next option.
sbb-itb-284a532
6. Hex
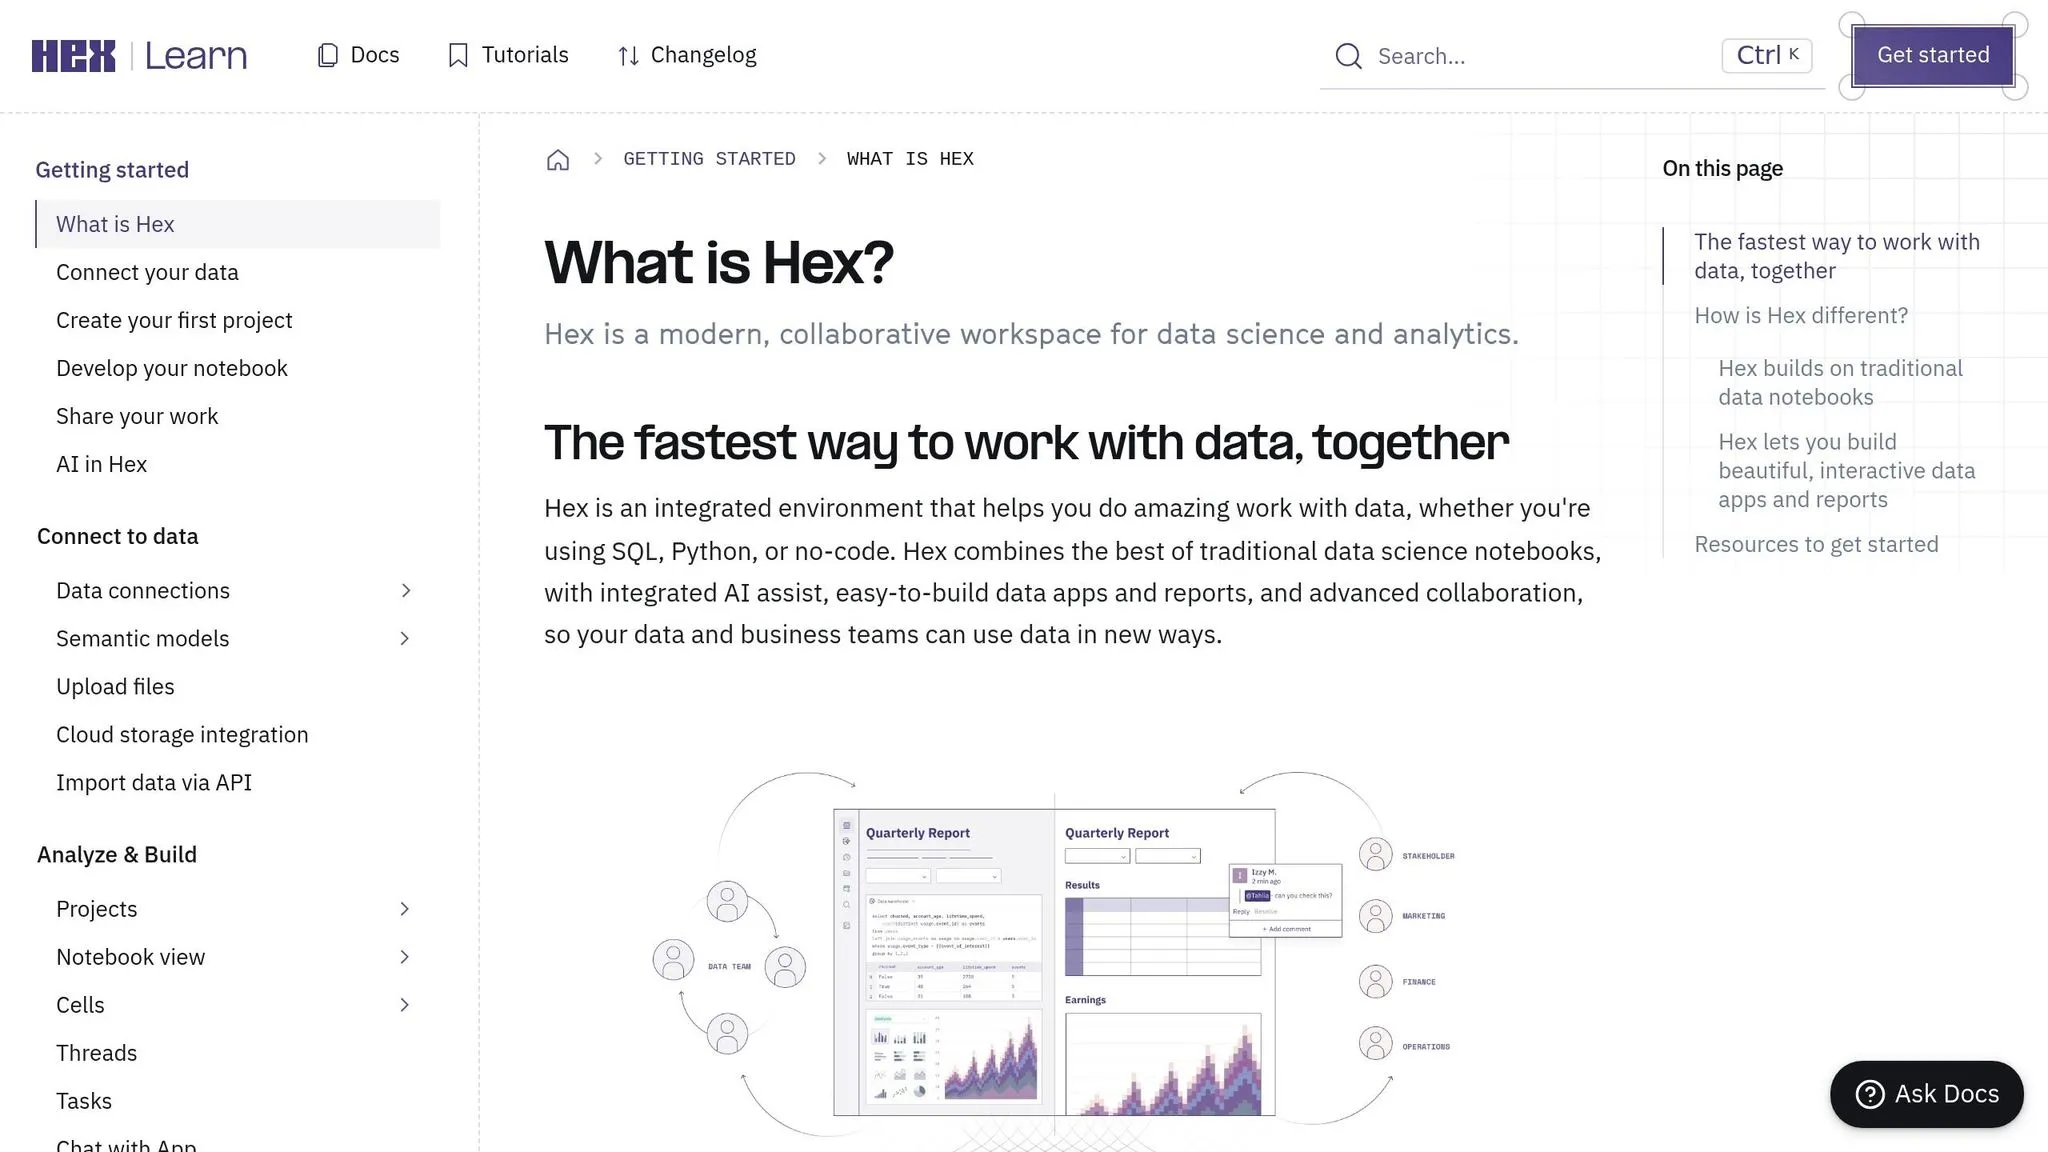
Hex is a notebook-first platform built for analyst teams that need to move between SQL, Python, and no-code charts in one shared workspace. That setup makes a lot of sense for teams that want analysts to go from early digging to polished output without bouncing between tools.
Warehouse Connectivity
Hex is one of several warehouse-native data analysis tools that connects straight to Snowflake, BigQuery, Redshift, and Databricks. Analysts can run SQL or Python cells on live data inside the notebook.
Semantic Layer
Hex creates shared context through notebook history, versioning, endorsed models, and Context Studio. Notebook Agent and Magic AI use that context to improve accuracy and flag ambiguous queries or definition drift[8].
Governance Fit
Governance in Hex centers on endorsed notebooks and versioning. That works well for analyst-heavy teams that want room to move and a shared source of context. But if your team needs tighter enterprise controls, it’s worth looking at the fit with extra care.
AI Analytics Workflows
The standout feature is the Notebook Agent, which turns natural-language prompts into complex SQL and Python right inside the notebook[7]. Analysts can also publish notebooks as interactive data apps, which gives business users a way to review governed output in a more hands-on format[7].
That means there’s a short path from question to analysis you can reuse.
Pricing ranges from about $36 to $75 per editor per month for higher-tier team features[7][8].
Hex is a strong match for analyst-led teams that want fast, shared exploration. If your main goal is governed self-serve for non-technical business users, Hex may line up less well than a platform built around more admin-led workflows.
7. Omni
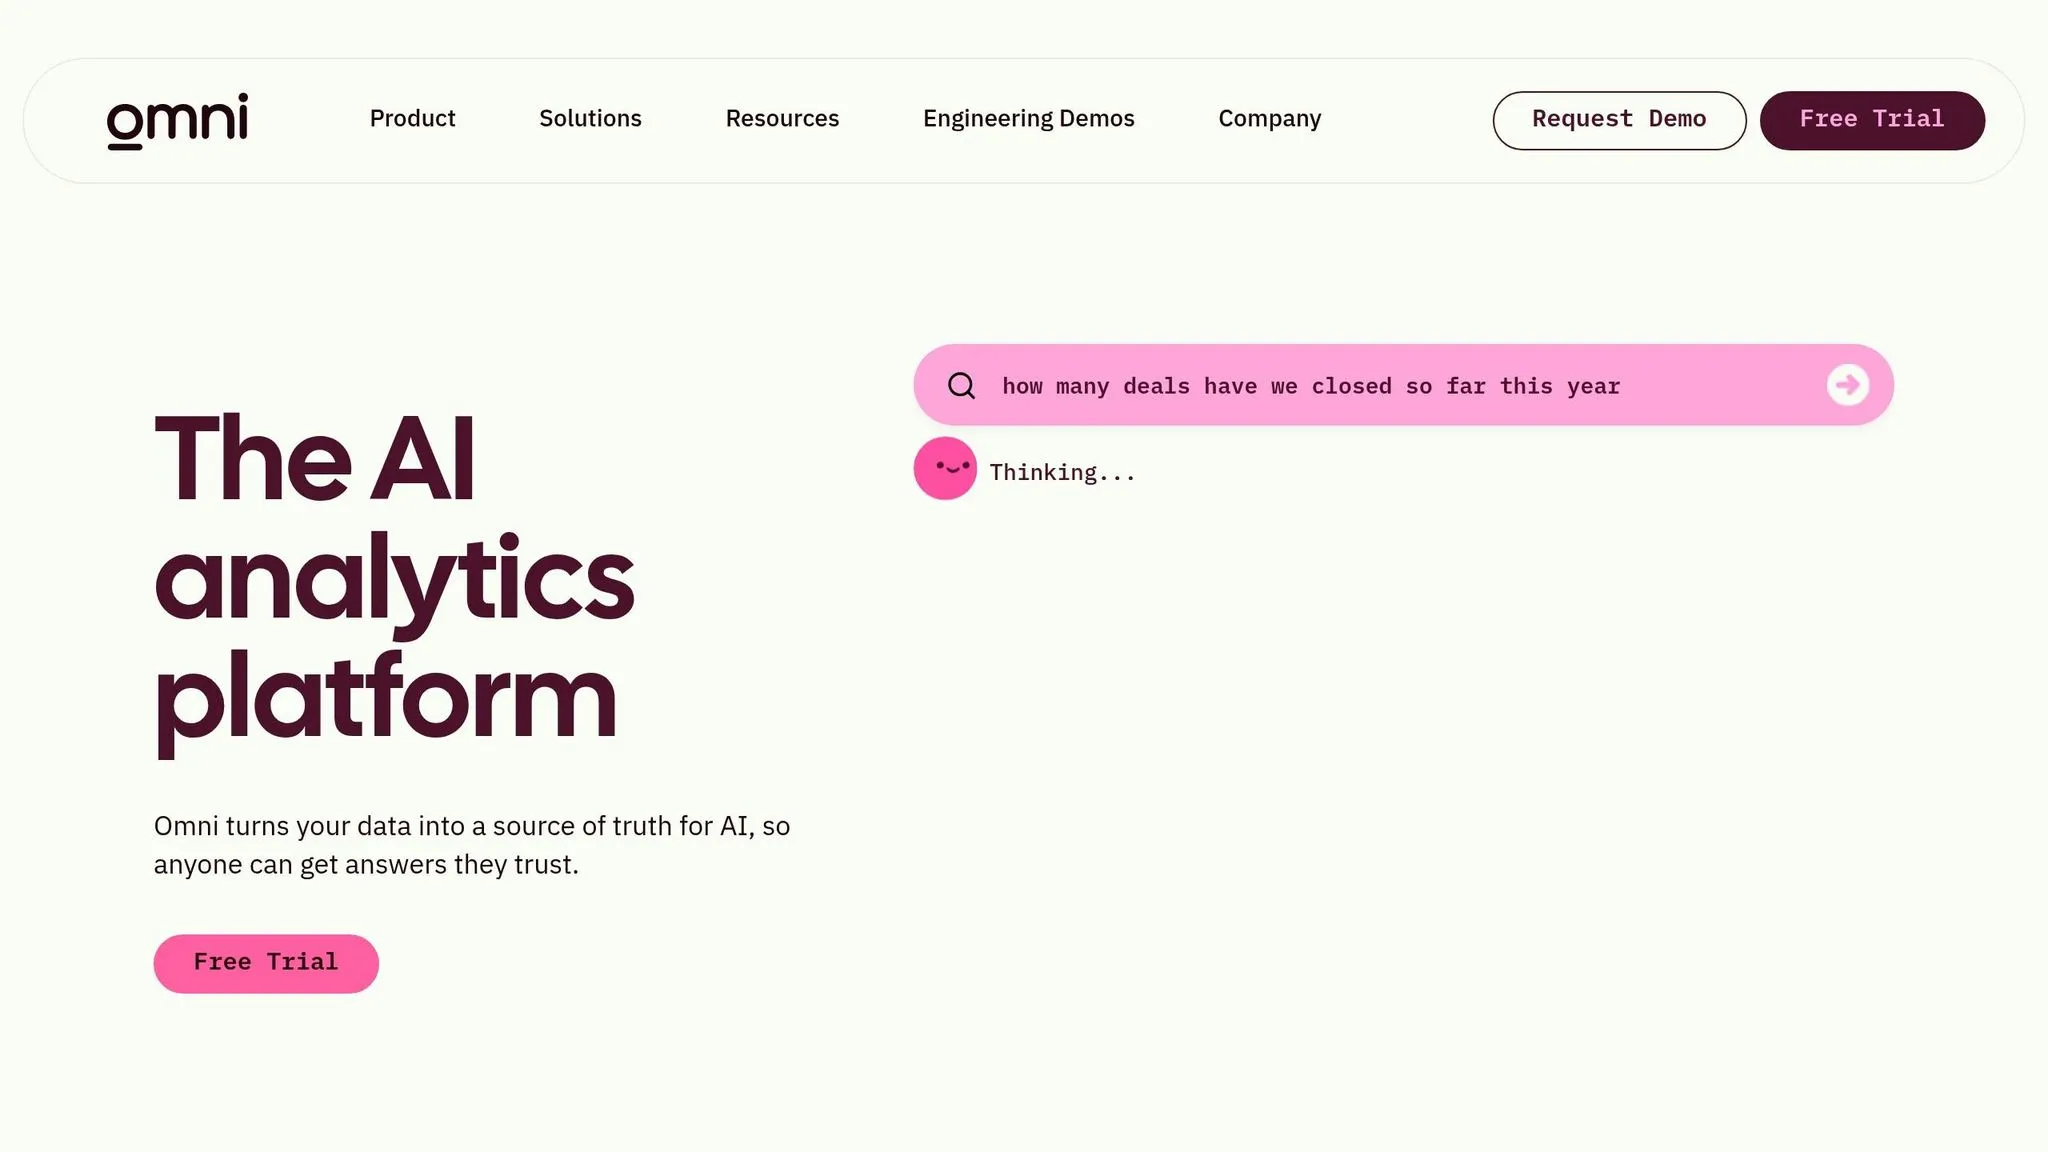
Omni is a model-first analytics platform built around a governed semantic layer. That semantic layer acts as the source of truth for AI analytics. So if your team wants AI answers based on business definitions, not raw table logic, Omni stands out.
Warehouse Connectivity
Omni connects straight to Snowflake, BigQuery, Redshift, Databricks, MySQL, ClickHouse, and Postgres. It does this without extracts.
Semantic Layer
Omni's semantic layer is warehouse-native and Git-versioned. It also works with dbt Semantic Layer, which means teams can keep one governed model across tools [4].
Governance Fit
Analysts build logic in workbooks and then move certified metrics into the governed model through Git review [4]. That setup gives teams a clear path from draft analysis to approved business logic for self-serve analytics.
AI Analytics Workflows
Omni's coordinator agent answers questions through the governed model, using approved business logic and join paths [4]. In plain English, the AI isn't guessing its way through tables. It works from rules the team has already set.
Omni also supports the Model Context Protocol (MCP). That lets external AI agents like Claude, Cursor, and ChatGPT query its validated semantic model [4].
8. Looker
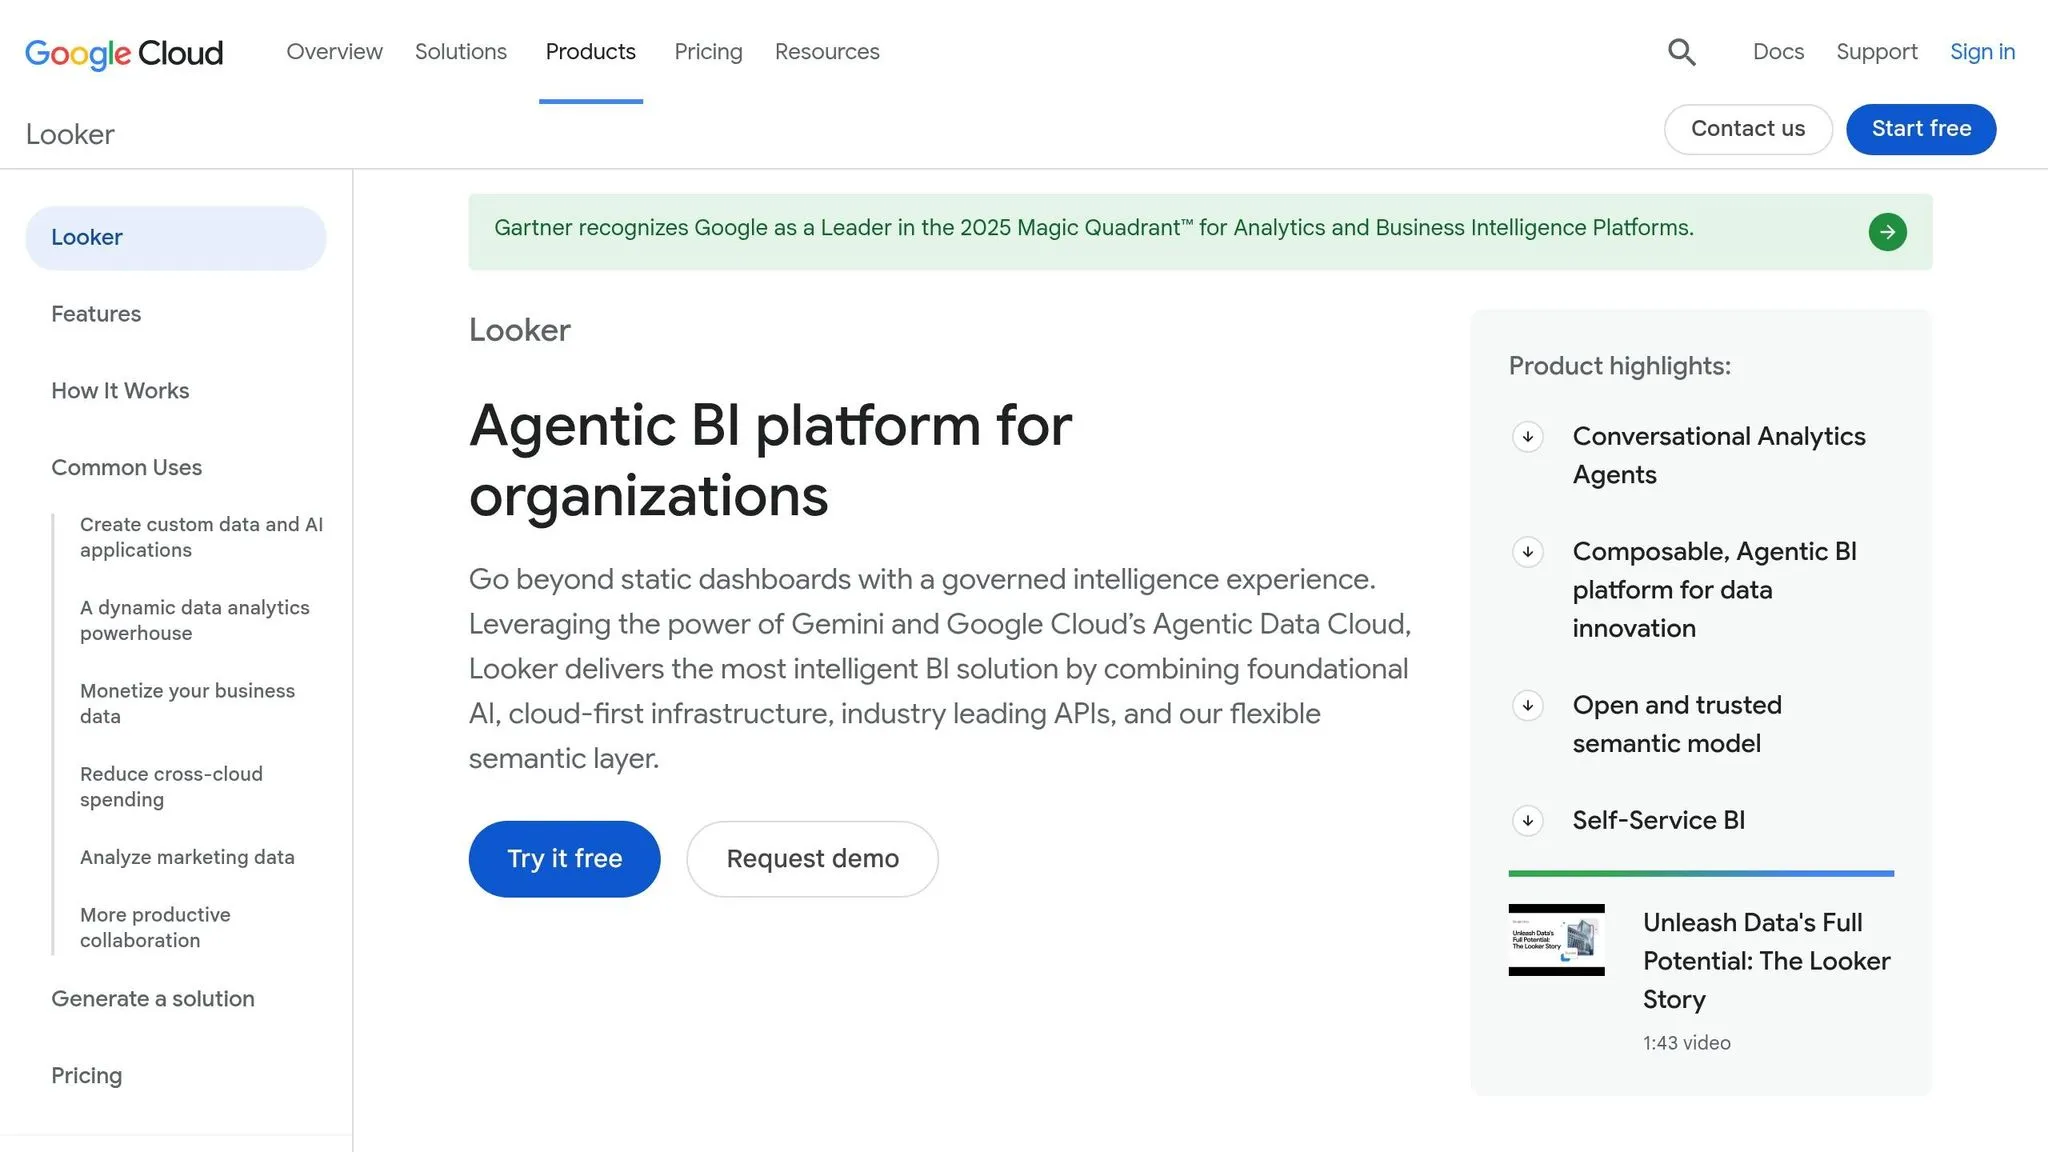
Looker is built around LookML, a Git-versioned semantic layer for metrics, dimensions, and joins. It’s a strong fit for teams that want governed AI on top of live Snowflake, BigQuery, or Databricks data without moving that data around.
Warehouse Connectivity
Looker connects natively to Snowflake, BigQuery, and Databricks, so data stays in the warehouse instead of getting copied into extracts [7][4]. That setup matters. It means teams can work from live data and keep tighter control over what the AI is using.
Its closest tie-in is with BigQuery and Google Cloud, where it can support Gemini-powered workflows.
Semantic Layer
LookML is Looker’s main edge. It gives teams a Git-versioned semantic layer that defines metrics, dimensions, and joins, which helps keep AI outputs grounded in the same business logic.
There’s a catch, though: Looker’s AI is only as steady as the LookML model behind it. If the model is messy, the answers can drift. So in Looker, model discipline matters more than it does with black-box AI layers.
Governance Fit
Access control starts with warehouse permissions. On top of that, LookML limits which metrics and joins AI and business users can use. That extra layer helps keep outputs auditable as users move from early exploration into deeper analysis.
AI Analytics Workflows
Looker Agent turns plain-English questions into live, governed answers based on LookML. It then returns the results as visualizations or SQL, so users can review what the system produced.
Teams that want a broader BI suite with AI built into the app layer should look at the next option.
9. Microsoft Power BI with Fabric/Copilot

Power BI with Fabric/Copilot connects to Snowflake, BigQuery, and Databricks through Microsoft Fabric [7]. It tends to work best for teams that already run on Microsoft 365 and Fabric.
The big day-to-day trade-off comes down to DirectQuery versus Import mode. DirectQuery gives you live access to the warehouse. Import mode usually gives you faster report performance. In plain terms, you’re choosing between fresher data and a snappier reporting experience. That choice shapes how the tool feels in use.
Semantic Layer
Power BI’s semantic layer runs on DAX (Data Analysis Expressions) [7]. Copilot relies on that semantic model to generate DAX queries, build report pages, and summarize data from natural-language prompts [7].
That also means the output is only as good as the model behind it. If the semantic layer is clean and well set up, Copilot has a much better shot at giving useful answers. If not, things can go sideways fast.
Governance Fit
Governance flows through DAX-based row-level security (RLS), Azure AD policies, and Microsoft Purview for data governance across the Fabric ecosystem [7].
So if your team already uses Microsoft tools for access control and governance, Power BI fits into that setup pretty naturally.
AI Analytics Workflows
Copilot adds a prompt layer on top of semantic models [7]. Users can ask questions in plain English, and Copilot can generate DAX, build visualizations, or summarize data [7].
That sounds smooth on paper, and often it is. But with more involved diagnostic work, things get trickier. For funnel analysis or cohort analysis, analysis errors can still show up if the model or query sequence isn’t defined well [3]. In other words, Copilot can help move faster, but it doesn’t remove the need for a well-structured model.
| Feature | Power BI with Fabric/Copilot |
|---|---|
| Warehouse Connectivity | Snowflake, BigQuery, Databricks via Fabric [7] |
| Query Language | DAX [7] |
| AI Interface | Copilot prompt layer over semantic models [7] |
| Governance | DAX RLS, Azure AD, Microsoft Purview [7] |
| Capacity Requirement | Fabric F2+ or Premium P1+ [7] |
For teams outside the Microsoft ecosystem, the Fabric dependency is a serious factor. For Microsoft-first teams, Power BI can be a strong governed analytics option with solid warehouse connectivity.
Which Tool Fits Which Use Case
Choose based on your warehouse setup, your users, and your governance needs - not just a feature checklist. The goal is simple: match the tool to how your team already works.
If your team works across multiple warehouses - Snowflake, BigQuery, and Databricks at the same time - you’ll want a tool with native connections to all three. Querio, ThoughtSpot, Sigma, and Omni fit that setup. Querio uses a shared context layer to keep definitions aligned across tools and teams. Omni and Looker, by contrast, lean on stricter semantic models.
For teams that live in a single warehouse, the native options usually go deepest. Snowflake Cortex Analyst reaches 90%+ SQL accuracy by pairing agentic AI with broad semantic models [2]. Databricks Genie is the natural pick for teams built around Unity Catalog. These native options tend to work best when governance and data already sit in the same stack.
For analyst-led work, Hex stands out when you need complex SQL and Python inside a shared notebook. Querio also supports reactive notebooks, along with inspectable SQL and Python. That matters when analysts want help from AI but still need to see what’s happening under the hood.
For non-technical users, the big test is speed to a trusted answer. If people need answers every day, the interface can’t get in the way. ThoughtSpot’s search-first setup and Querio’s plain-English chat are both built for that kind of self-serve use.
The table below maps each platform to a common buying scenario.
| Buying Scenario | Best-Fit Tools | Best Fit |
|---|---|---|
| Cross-warehouse / multi-cloud | Querio, ThoughtSpot, Sigma, Omni | Native connectors across warehouses |
| Snowflake-first | Snowflake Cortex Analyst | Native YAML-based modeling; inherits Snowflake RBAC |
| Databricks-first | Databricks Genie | Deep Unity Catalog integration |
| Non-technical self-serve | ThoughtSpot, Querio | Search-first or plain-English interfaces |
| Analyst-led notebooks | Hex, Querio | Complex SQL/Python with AI assistance |
| Governed metrics layer | Omni, Looker | Version-controlled metrics and joins |
| Microsoft ecosystem | Power BI with Copilot | Seamless Fabric, Teams, and Office 365 integration |
Pros and Cons of Each Tool
No tool wins in every area. The best choice comes down to where your data sits, who’s asking the questions, and how much control your team can handle day to day.
The table below trims the trade-offs into clear buying signals.
| Tool | Pros | Cons | Ideal Team Profile |
|---|---|---|---|
| Querio | Inspectable SQL/Python; governed context layer; live warehouse connections | No native ingestion or ETL layer | 100–500-employee B2B SaaS data teams |
| Databricks Genie | Native Unity Catalog governance; fast setup for Databricks-native stacks | Locked to Databricks; 30-table limit per Genie Space [1] | Databricks-first teams |
| Snowflake Cortex Analyst | High SQL accuracy with a strong semantic model; inherits Snowflake RBAC natively | Snowflake-only; message-based pricing can be unpredictable at scale | Snowflake-committed teams |
| ThoughtSpot Spotter | Search-first interface; strong embedded SDK; enterprise self-serve fit | Standalone app workflow; requires upfront modeling | Enterprise self-serve teams |
| Sigma Computing | Spreadsheet-familiar interface; solid multi-warehouse connectivity | Less code-centric than Looker or Omni | Finance and ops teams |
| Hex | Strong SQL and Python notebook experience; collaborative for analysts | Notebook interface can be too complex for non-technical users; per-editor pricing can scale quickly | Analyst-led teams |
| Omni | dbt-native semantic layer; AI grounded in a governed model | Requires upfront modeling, and AI only works within that model | dbt-heavy teams |
| Looker | LookML provides version-controlled, auditable metrics; tight BigQuery integration | Complex setup and strong Google Cloud dependency | Google-stack enterprises |
| Microsoft Power BI with Fabric/Copilot | Familiar to Microsoft-first teams; works naturally with Fabric and Microsoft 365 | Requires Fabric F2+ or Premium P1+ for Copilot features [7]; DAX has a steep learning curve | Microsoft-first teams |
Use these trade-offs to line up each platform with the right warehouse setup and user type. A tool that feels perfect for an analyst-led SQL team can feel like overkill for a finance group that just wants spreadsheet-style reporting.
Inspectability matters. Answers that show the SQL or Python behind them are much easier to audit than black-box outputs. If your team needs to check logic, trace a number back to the source, or catch errors before they spread, that visibility can save a lot of pain.
Conclusion
After comparing live warehouse tools across Snowflake, BigQuery, and Databricks, the choice comes down to one thing: Is your data in one warehouse or spread across several?
Native tools work best when your warehouse choice is already set. If your whole stack runs on Databricks, Genie is a sensible place to start. If you're all-in on Snowflake, Cortex Analyst is the clear match. Put simply, native tools make the most sense when the stack is fixed. Mixed stacks need a governed layer that can work across systems.
For single-warehouse teams, multi-warehouse teams, or analyst-led workflows, the decision follows warehouse scope. Stay native if the stack is fixed. Use a governed cross-warehouse layer if it isn't. And pick a notebook-first tool if analysts are leading the work.
One thing matters more than speed alone: inspectable SQL and consistent metrics. Choose the tool that shows its work, keeps metrics aligned, and queries live data. That is the benchmark for warehouse-native AI analytics in 2026.
FAQs
::: faq
How do I choose between a native tool and a cross-warehouse tool?
It comes down to a simple tradeoff: best-in-class performance inside one platform vs. one set of rules across your whole stack.
Choose a native tool when your data lives in a single platform and you want tight integration with that system.
Choose a cross-warehouse or warehouse-native tool when your data is split across Snowflake, BigQuery, and Databricks, and you want consistent metrics without moving data. :::
::: faq
What should I check before trusting AI-generated SQL answers?
Check that the platform gives you inspectable, editable SQL. That way, you can review the answer, test it, and make changes yourself instead of trusting a black box.
You’ll also want to confirm that it uses a governed semantic or context layer so metrics, joins, and business terms stay consistent across teams. On top of that, it should respect native warehouse security and log AI-generated queries for auditability. :::
::: faq
When does a semantic layer matter most for AI analytics?
A semantic layer matters most when teams shift from passive dashboards to AI-driven analytics. It keeps business logic consistent by grounding AI in certified metrics and defined relationships instead of raw SQL.
That means fewer conflicting numbers, less metric drift between dbt and your BI layer, and more confidence for non-technical users querying live warehouse data. :::