Business Intelligence
How to Build Self-Serve Analytics for Customers
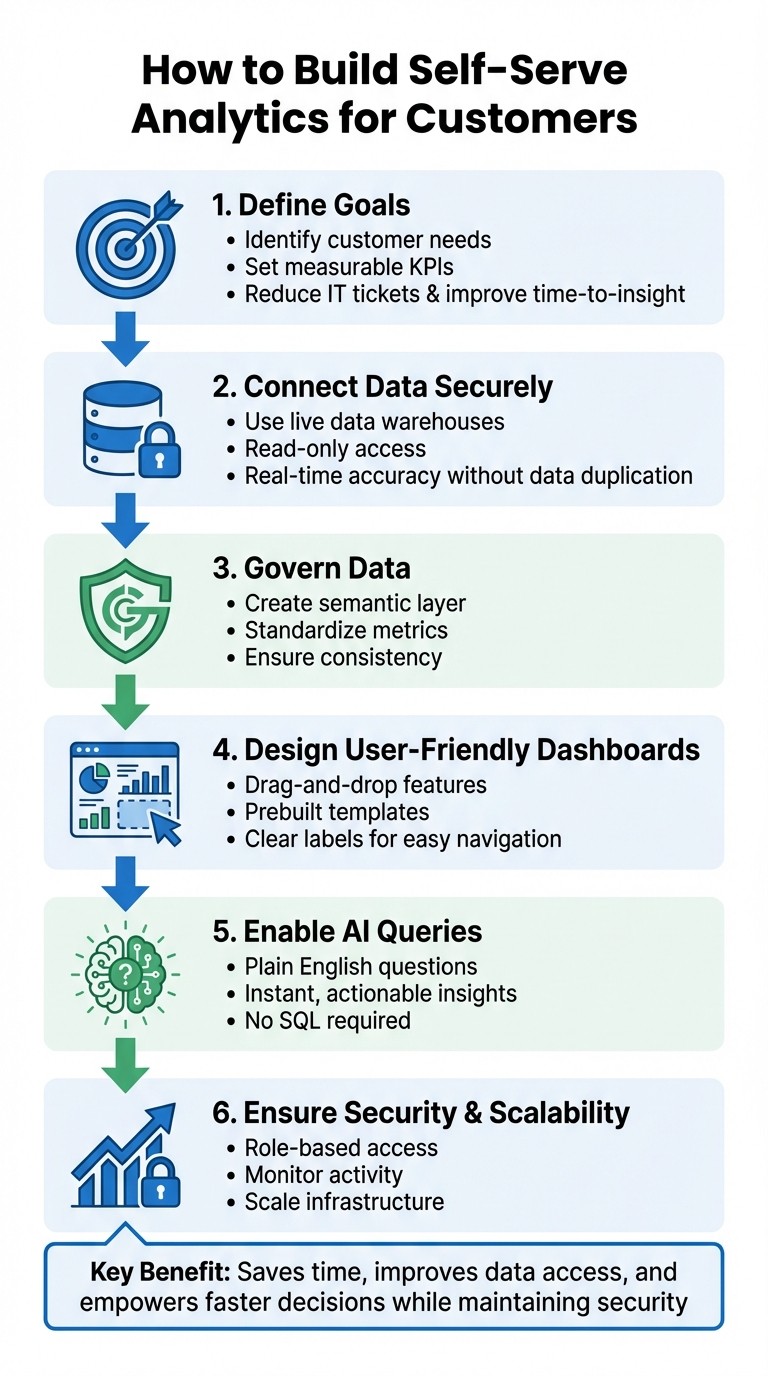
Build customer-facing self-serve analytics: define KPIs, connect live warehouses securely, create a governed semantic layer, design dashboards, and enable AI queries.
Self-serve analytics empowers customers to access and analyze data independently, cutting down wait times and reliance on technical teams. By enabling tools like AI-powered natural language queries and intuitive dashboards, businesses can improve decision-making and user satisfaction. Here's how to build a self-serve analytics platform effectively:
Define Goals: Identify customer needs and set measurable KPIs, such as reducing IT tickets or improving time-to-insight.
Connect Data Securely: Use live data warehouses with read-only access to ensure real-time accuracy without duplicating data.
Govern Data: Create a semantic layer to standardize metrics, ensure consistency, and simplify data exploration.
Design User-Friendly Dashboards: Use drag-and-drop features, prebuilt templates, and clear labels for easy navigation.
Enable AI Queries: Let users ask questions in plain English to get instant, actionable insights.
Ensure Security and Scalability: Implement role-based access, monitor activity, and scale infrastructure to meet growing demands.
By embedding analytics directly into customer applications and continuously refining based on feedback, you can provide a seamless and secure data experience. Tools like Querio make this process efficient and scalable, offering AI-driven insights and robust security measures.
Key Takeaway: Self-serve analytics saves time, improves data access, and empowers users to make faster decisions - all while maintaining security and consistency.
6-Step Process to Build Self-Serve Analytics Platform for Customers
How AI Tools can Finally Solve the Self-Service Analytics Problem?
Define Success Metrics and Objectives
Before diving into building your platform, take a step back and define what success looks like. This means pinpointing what your business and customers truly need. Are you aiming to reduce report wait times? Cut down IT support tickets? Or maybe improve customer retention by offering direct access to data? Whatever the goals, write them down and ensure they address real challenges.
Identify Business and Customer Goals
Your platform should solve real problems, not just check a box. To get there, collaborate with teams like sales, marketing, and customer success. They’re on the front lines and can help identify the metrics that matter. For example, when Rippling introduced self-service analytics, these teams cut their time-to-insight in half by honing in on the specific questions they needed answered daily. This kind of targeted approach highlights the power of actionable analytics.
Start with a quick win. Pick a routine task that eats up time - like tracking inventory turnover or analyzing campaign performance or identifying churn drivers - and automate it. This not only shows immediate value but also builds momentum for broader adoption. As management consultant Peter Drucker wisely said:
"A strategy without metrics is just a wish. And metrics that are not aligned with strategic objectives are a waste of time."
From there, translate these focused goals into measurable KPIs.
Establish Key Performance Indicators (KPIs)
Once you’ve set your goals, convert them into KPIs you can measure. According to research, 68% of organizations saw a boost in business development after adopting a formal KPI framework, and 43% found it improved their ability to evaluate results objectively. But here’s the catch: 32% admitted that identifying the right KPIs for their business was the toughest part.
Keep it straightforward. Zero in on three main goals, and assign no more than three KPIs per goal. Common examples include time-to-insight (how quickly users get answers), IT ticket reductions, data quality scores, or metrics tied to business outcomes like customer churn or revenue growth. Use SMART criteria - Specific, Measurable, Achievable, Relevant, and Time-bound - to ensure each KPI is actionable. Finally, establish a feedback loop to regularly review and refine these metrics.
Connect Data Sources Securely
After defining your metrics, the next step is to link your platform directly to your data sources, such as Snowflake, BigQuery, or Postgres. The goal? Avoid unnecessary data duplication. By connecting directly to these sources, you ensure users access real-time data without delays or outdated information.
Integrate Live Data Warehouses
Querio connects to your data warehouse using read-only, encrypted credentials. This setup allows your platform to pull data on demand without storing it elsewhere. The result? A secure connection that provides users with instant access to up-to-date numbers - no waiting for overnight batch jobs or dealing with outdated reports. This is a core component of AI-driven self-serve analytics, where speed and accuracy are paramount.
Before going live, take the time to validate your data for accuracy and fix any formatting inconsistencies. Non-technical users won’t notice database quirks, so it’s best to address these issues upfront. Once connected, use semantic domains to transform raw database tables into user-friendly categories. Instead of overwhelming users with complex database schemas, you can present them with curated datasets, complete with clear labels and descriptions. This approach not only simplifies data access but also enhances security - a topic we’ll dive into next.
Avoid Data Copies and Maintain Security
Direct integration is just one piece of the puzzle; maintaining strict security measures is equally critical. Avoid duplicating data to reduce security risks and ensure a single source of truth. Each copy of your data increases the risk of breaches and complicates compliance efforts. Keeping everything centralized in your warehouse makes data governance in self-service analytics simpler and more secure.
For customer-facing analytics, schema-level security (SLS) is a must. This method isolates customer data by assigning each client a dedicated database schema, such as corp_a or corp_b, keeping their information completely separate. Use API-generated tokens to control which semantic domains each user can access, maintain SOC 2 Type II compliance, and monitor audit logs to track activity. Regularly review these logs to detect unusual behavior early and adapt your security protocols as your customer base grows.
Build a Governed Semantic Layer
After connecting your data sources, the next step is creating a semantic layer. This layer translates complex database jargon into simple, business-friendly terms. By doing so, it ensures that everyone - whether they're product managers or end users - understands and interprets metrics the same way. This eliminates confusion and minimizes the chances of conflicting reports. At this stage, it's also important to define precise business metrics and establish clear relationships between tables, making data exploration more intuitive.
Standardize Metrics and Establish Joins
To keep everyone on the same page, standardize key metrics so they have consistent definitions across all teams. Define each KPI in a centralized location to ensure clarity and reliability. At the same time, manage table relationships carefully. For instance, specify how the orders table connects to customers or how products relate to inventory. When these joins are baked into the semantic layer, users can simply drag and drop fields without ever needing to write SQL.
Organize your tables into semantic domains like "Sales", "Marketing", or "Support" to align with how your teams work. Add clear, descriptive labels to fields - for example, "Total amount paid by the customer, excluding taxes and discounts." These descriptions help users instantly grasp what they're analyzing, making onboarding quicker and reducing the need for support.
Implement Governance for Trustworthy Data
To keep your semantic layer dependable and secure, strong governance is essential. Use role-based access control (RBAC) to ensure that users only see the data they're authorized to access. For example, a healthcare client might need row-level filtering to comply with HIPAA, while a SaaS company might require column-level masking to protect sensitive pricing details. By applying these rules at the source table level, you ensure that security policies automatically carry over into the semantic layer, eliminating the need to redefine them for every dashboard.
Mark datasets as "Certified" to signal that they’ve been validated and meet organizational standards. For instance, when a sales report has this certification, users immediately know the data is accurate and reliable. Companies like Rippling have seen significant benefits from this approach, cutting their time to insights in half by allowing non-technical teams to access critical metrics without relying on engineers[1]. Regular audits are key to maintaining both performance and compliance.
Design Intuitive Dashboards and Templates
Once your semantic layer is ready, it’s time to create dashboards that users will actually enjoy using. The trick? Swap out technical database terms for clear, business-friendly labels. For instance, instead of showing a field like cust_rev_ttl, display something like "Total Customer Revenue (excluding taxes and discounts)." This small but impactful change ensures that even non-technical users can easily interpret the data, making exploration feel approachable instead of overwhelming.
Build Drag-and-Drop Dashboards
Modern self-service platforms make it easy for users to design their own dashboards with drag-and-drop functionality. This allows them to pick the metrics they care about, arrange visualizations, and track the KPIs that matter most to them.
Kick things off by offering pre-built templates that address common use cases. For example, a SaaS company could provide templates like "Monthly Recurring Revenue by Region" or "Customer Churn Analysis." These templates deliver instant insights while giving users a foundation to personalize further. Organize dashboards into categories such as "Sales", "Support", or "Operations", so users can quickly find the information they need. Add brief, contextual descriptions to each report to explain what’s being measured and why it’s important - this builds trust and helps users feel confident in the data they’re working with.
Once your dashboards are ready, take it a step further by embedding them directly into your product to elevate the user experience.
Embed Analytics in Customer Applications
Instead of requiring users to log into a separate analytics platform, embed dashboards directly into your application using secure JavaScript integrations or iFrames. Tools like Querio make it possible to white-label the entire experience, allowing you to match your brand’s colors, fonts, and logos. This makes analytics feel like a natural extension of your product, not a disconnected add-on.
Take JobNimbus as an example. In 2024, they introduced a drag-and-drop self-service platform for enterprise customers in the renovation contracting industry. By embedding custom dashboards and reports directly into their CRM, they saw 70% adoption among large enterprise users within just a few months[2]. This also led to a noticeable drop in churn. To ensure security and data privacy, use server-side token generation to isolate data between tenants. This approach not only protects sensitive information but also delivers a seamless, professional experience that boosts user satisfaction and engagement.
Enable AI-Driven Querying and Notebooks
Once you've set up streamlined dashboards and secured your data connections, the next step is enabling AI-driven querying. This feature lets users go beyond static reports, diving into analytics with real-time, interactive exploration. Instead of relying solely on pre-built reports, users can now uncover insights on demand, paving the way for both simple queries and more advanced analytics workflows.
AI-Powered Natural-Language Querying
Today’s AI platforms are smart enough to understand business intent, not just keywords. This means users don’t need to master SQL or navigate complex filters. Instead, they can simply ask questions like, "Which products have declining margins despite increasing sales?" and get precise, visual answers - charts, graphs, or tables - in seconds. Behind the scenes, the AI takes care of the technical heavy lifting, including joins, filters, and aggregations.
This capability addresses a common workplace challenge: 47% of digital workers struggle to find the information they need to do their jobs effectively. With AI-powered querying, users can even ask follow-up questions, such as, "What does this look like for Q4 only?" This conversational flow reduces the time it takes to go from a question to actionable insights - from weeks to mere minutes. The key is using platforms that focus on intent-based querying, which is far more reliable than basic keyword matching. Unlike keyword-based systems, intent-based platforms can handle variations in phrasing or synonyms without breaking down.
In-House Python Notebooks for Advanced Analysis
For more complex analytics, natural language querying can be paired with in-house Python notebooks. These notebooks, like those provided by Querio, allow users to combine SQL, Python, and AI-driven tools to translate natural language into technical code using AI data analysis tools. This opens up advanced modeling and analysis to non-technical users while giving data experts full control over their workflows.
The notebooks are designed with security in mind. They offer read-only database access to prevent accidental modifications and ensure safe exploration. For multi-tenant environments, schema-level security keeps data isolated, so organizations only see their own information. With AI-assisted code generation and governed access, users can seamlessly move from basic visualizations to deep analytics - all within the same platform and without compromising on security or data integrity.
Ensure Governance, Security, and Scalability
As your self-serve analytics platform gains traction and reaches more users, the importance of data governance, security, and scalability becomes impossible to ignore. A single security breach could cost millions, erode trust, and invite hefty penalties - think GDPR fines of up to €20 million or 4% of your global revenue. This makes building a platform with strong governance, airtight security, and room to scale a non-negotiable starting point.
Implement Role-Based Access and Compliance
Role-Based Access Control (RBAC) is the backbone of any secure self-serve analytics platform. It assigns users to specific roles and grants permissions tailored to their needs, controlling which dashboards, schemas, and datasets they can access. When paired with Row-Level Security (RLS) and Column-Level Security, this approach ensures granular control over data access. RLS limits visibility to specific rows based on user attributes, while Column-Level Security masks sensitive data, like personally identifiable information (PII) or financial details.
"RBAC ensures that users only see the data they actually need, which keeps data secure and maintains data integrity." - Emma Vandermey, Revelate
Dynamic session variables further tighten security by applying real-time filters based on user group membership. For instance, a regional sales manager might only view data relevant to their territory, while sensitive columns - like employee salaries - remain hidden for unauthorized users. Querio supports these advanced security measures natively, making it easier to enforce strict data controls.
Regular audits are essential to keep permissions up to date. Review and adjust user access at least quarterly to ensure roles align with employees’ current responsibilities. Integrating enterprise identity providers like Okta or Azure AD for Single Sign-On (SSO) and Multi-Factor Authentication (MFA) adds an extra layer of security. Additionally, maintaining detailed audit logs of data access and changes not only helps meet regulatory requirements but also flags unauthorized activities before they escalate.
Once your security framework is rock solid, the next step is scaling your platform to meet growing customer demands.
Scale for Growing Customer Needs
Scaling isn’t just about handling larger datasets - it’s about ensuring your platform performs reliably and stays secure as your user base grows. A key strategy here is workload isolation, which separates tasks into tiers: mission-critical analytics (Tier 1), operational tasks (Tier 2), and ad-hoc queries (Tier 3). This prevents resource bottlenecks and ensures high-priority tasks always run smoothly. Facebook’s analytics model, as described by Data Product Manager Namit RaiSurana in 2023, exemplifies this approach, with IT teams managing the infrastructure while business users focus on analysis.
"The best analytics implementations are user-created dashboards running on top of IT-managed infrastructure." - Tableau Whitepaper
Scaling effectively requires gradual adjustments. Monitor peak usage patterns and expand capacity as needed. Tools like Infrastructure as Code (IaC) templates can streamline resource deployment, ensuring new infrastructure adheres to standard security policies from the start. Regular uptime checks help you maintain the health of your platform and identify issues before they affect users.
Querio is built with scalability in mind. Its architecture supports unlimited viewer users and guarantees a 99.9% uptime SLA, ensuring consistent performance even as demand grows. Features like read-only database access prevent accidental data changes, while schema-level security isolates data in multi-tenant environments. Plus, as your analytics capabilities expand, you can layer on advanced tools - like AI-powered Python notebooks - without needing to overhaul your entire setup. Everything operates on the same secure, governed foundation, empowering users to explore data confidently and independently.
Deploy, Test, and Monitor Usage
With robust security, governance, and a user-friendly design already in place, deploying the platform is the final step in making data more accessible. This phase determines whether your platform becomes a go-to resource or just another tool that sits unused.
Embed and Launch the Platform
Implementing a perfect embedded analytics architecture directly into your customers' existing applications is one of the best ways to encourage adoption. When users can access insights right within their workflow - without switching tools or exporting data - they're more likely to engage regularly. This seamless integration eliminates friction, such as downloading CSV files or logging into separate platforms, and encourages consistent use.
Kick off the launch with a brief feature tour that specifically highlights how the platform solves key challenges for different teams. For instance, show a marketing team how to analyze campaign performance or guide a finance team through tracking monthly recurring revenue. This kind of hands-on introduction helps reduce the intimidation that non-technical users might feel when faced with a new tool.
Focus on delivering quick wins during the initial rollout. Identify one common, time-consuming task for each team and demonstrate how the platform simplifies or speeds it up. As Mike Chen, Content Strategist at Oracle, explains:
"The best way to get employees to fully utilize your new platform is to show how it helps each team accomplish one frequent, time-consuming task more easily."
To make the transition easier, provide prebuilt templates and reports that allow users to see immediate value without starting from scratch. Organize these resources into Collections tailored to specific roles or departments - like Sales, Marketing, or Operations - so users can quickly locate relevant insights.
Querio's embedded analytics features make deployment straightforward while ensuring full data access control and accommodating unlimited viewer users as adoption scales. After the launch, keep a close eye on how users interact with the platform to fine-tune its performance.
Monitor Adoption and Refine Features
Once the platform is live, tracking user behavior is critical to ensuring its continued value. Pay attention to which dashboards are most popular, which queries are run repeatedly, and where users encounter challenges. Audit logs can provide a dual benefit: they highlight security issues while also revealing patterns in how customers use the platform. Are they confidently exploring data, or sticking to just a few familiar reports?
Establish a feedback loop to quickly address gaps and keep the platform relevant. Robert Sheldon, Technology Writer at TechTarget, emphasizes:
"Users can benefit from templates and prebuilt reports to get started with self-service analytics. Set the projects up with a feedback loop that collects user input to ensure the platform's ongoing relevancy."
Make it easy for users to flag missing data, request new metrics, or report usability issues. This ensures the platform evolves alongside business needs and avoids becoming outdated.
Keep an eye out for "report sprawl", where users create overlapping or redundant reports that clutter the system and slow performance. Set clear guidelines on when to create a new report versus updating an existing one. Regular audits can help identify which reports are actively used and which should be archived. Additionally, track support tickets and FAQ usage to pinpoint common issues that might require better documentation or training.
Measure time-to-insight as a key performance indicator (KPI) to ensure users can get answers quickly. If delays persist, investigate the cause - whether it’s missing data, overly complex dashboards, or a need for more training.
Querio's architecture supports this kind of iterative improvement. As you gather feedback and uncover new requirements, you can add advanced features - like AI-powered Python notebooks for deeper analysis - without overhauling the entire system. The platform’s governed foundation ensures users can explore data confidently while you maintain control over security and quality.
A successful deployment bridges the gap between building the platform and achieving user adoption, solidifying it as a scalable and reliable self-service analytics solution.
Conclusion and Key Takeaways
Recap of Key Steps
Creating self-serve analytics for customers hinges on delivering data in a clear and guided manner. Start by identifying success metrics and defining business objectives to focus on the outcomes that truly matter. Use secure live connections to minimize data duplication risks. Establish a governed semantic layer to standardize business metrics, joins, and terminology, ensuring everyone operates from the same reliable data source.
Design dashboards and templates that are intuitive enough for users without SQL expertise to navigate. Incorporate AI-driven natural language querying so users can ask questions in plain English and get immediate, actionable insights. For those needing deeper analysis, include advanced Python notebooks. Ensure compliance standards are upheld to protect sensitive information while scaling to accommodate growing user demands. Finally, integrate embedded analytics tools directly into customer applications, track usage patterns, and refine features based on real-world feedback.
By following these steps, you're set to elevate your analytics game.
Next Steps with Querio
Ready to make the shift from manual reporting to seamless self-serve analytics? Querio provides the tools you need to make it happen. The platform connects directly to your existing data warehouse with read-only access, eliminating the need for data copies and maintaining SOC 2 Type II compliance to ensure security. Jennifer Leidich, Co-Founder & CEO of Mercury, shared how Querio revolutionized their approach to data exploration:
"What used to be weeks, now takes minutes!"
Querio's AI agents empower customers to ask questions in natural language and receive precise, visually compelling charts built on your governed semantic layer. The embedded analytics seamlessly align with your brand's design, and with unlimited viewer users, you can scale adoption without worrying about per-user licensing fees. Get started with a free pilot or book a demo to see how drag-and-drop dashboards and AI-powered Python notebooks can transform your analytics experience. This isn't just about speeding up reporting - it's about making data accessible to everyone in your customer base.
FAQs
How can businesses protect customer data when using self-serve analytics?
To protect customer data in self-serve analytics, start by building a robust data governance framework. This involves setting up clear access policies with role-based permissions, ensuring users only access the data they are permitted to see. A centralized data catalog can serve as a vital tool to organize data assets, monitor their use, and maintain consistent control measures.
On the technical side, prioritize safeguards like encryption (both during storage and transit) and data masking to shield sensitive information. Implement automated monitoring systems with audit logs to spot and address unusual activity quickly. Regularly conducting security reviews and compliance checks is another key step in keeping potential breaches at bay.
Don't overlook the human element - provide security training for all users. Teach them best practices for handling data responsibly, creating a culture of shared accountability for data protection while ensuring the self-serve analytics experience remains smooth and efficient.
What are the benefits of using AI-powered natural language queries in analytics?
AI-powered natural language queries transform how businesses interact with data. By letting users ask questions in plain English, these tools deliver clear, visual insights in no time. This not only simplifies decision-making but also reduces the need for constant IT support, giving non-technical users the freedom to explore data on their own.
When access to information becomes this straightforward, businesses see a boost in efficiency and a stronger foundation for data-driven decisions. Plus, these tools make analytics feel like a natural part of daily workflows, bridging the gap between complex systems and everyday users. The result? A smoother process and happier users.
What are the best ways to measure the success of a self-serve analytics platform?
To gauge how well a self-serve analytics platform is performing, start by setting clear goals and tracking key performance metrics. These could include metrics like user adoption rates, the number of active users, how many reports or dashboards are being created, and a drop in support requests. Other helpful indicators might be time-to-insight - how fast users can get the answers they need - and feedback metrics like customer satisfaction scores (CSAT) or Net Promoter Scores (NPS).
It's also important to assess the platform's return on investment (ROI) or cost savings. For example, look at reductions in support costs or gains in operational efficiency. By displaying these metrics on a dashboard, businesses can regularly review the platform’s performance and make informed adjustments to improve the user experience and drive better results.
Related Blog Posts


