Omni vs Lightdash: Semantic Layer BI Compared
Pick app‑governed workbooks for analyst freedom or Git/dbt governance for engineering control.
If I had to cut this down to one line: Omni is the better pick for teams that want BI managed inside the product, while Lightdash is the better pick for teams that want BI managed in dbt and Git.
That’s the whole buying call.
Here’s how I’d frame it for you:
Choose Omni if you want a workbook-style BI tool, governed self-serve, in-app SQL work, and stronger support for customer-facing embedding.
Choose Lightdash if your team already lives in dbt + Git and wants metrics, dimensions, and dashboard logic reviewed through pull requests.
Both tools work with major warehouses like Snowflake, BigQuery, Redshift, and Postgres.
Both tools show the SQL behind results, which helps teams check metric logic instead of treating BI like a black box.
The biggest difference is simple: Omni keeps governance in the app; Lightdash keeps governance in code.
AI also follows that split: Omni leans toward in-product AI help, while Lightdash ties AI answers to dbt-defined metrics and semantic layers through places like Slack and MCP.
If you’re deciding by use case, I’d keep it this simple:
Use case | Better fit | Why |
|---|---|---|
Analyst-led self-serve | Omni | More room to work inside the BI interface |
dbt-first metric management | Lightdash | YAML + Git workflow next to dbt models |
Embedded analytics for SaaS | Omni | iframe and SDK options |
Git review for BI changes | Lightdash | Pull-request-based workflow |
AI tied to dbt metrics | Lightdash | AI routes through the dbt semantic layer |
A few facts stand out from the comparison: 4 shared core warehouses, 2 different governance models, and 1 main decision - do you want metric control in the app or in Git?
So if your team wants a Looker-style workflow with analyst freedom, I’d lean Omni. If your team wants BI-as-code with dbt at the center, I’d lean Lightdash.
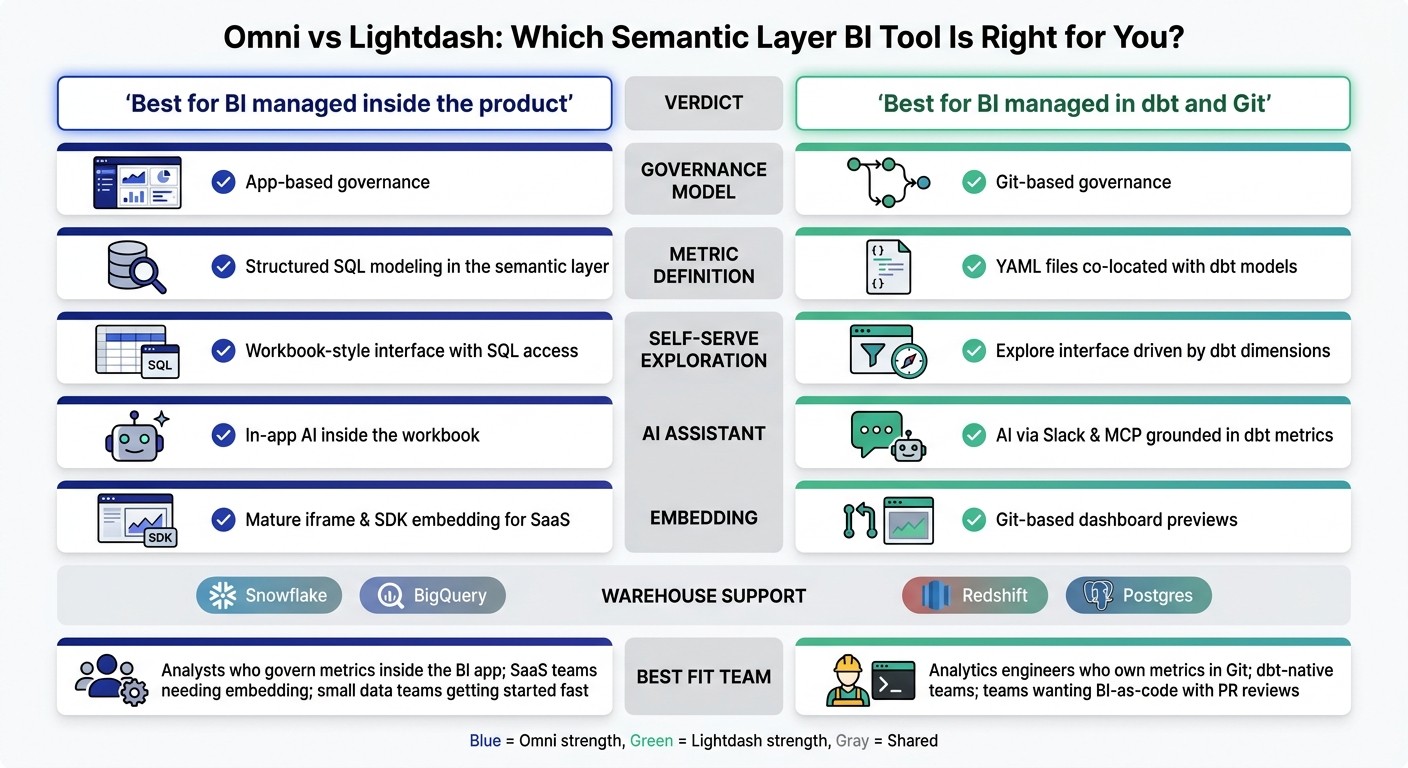
Omni vs Lightdash: BI Tool Comparison at a Glance
Exploring the dbt - BI workflow (Omni Live: April 2024)
Omni vs Lightdash: Key Differences Side by Side
For warehouse-native BI teams, the main choice comes down to where governance lives. With Omni, it lives inside the app through a governed semantic layer and a workbook-style interface. With Lightdash, it lives in Git as YAML files next to dbt models. That split shapes the tradeoffs that matter most.
Comparison Table: Core Semantic-Layer BI Criteria
Criterion | Omni | Lightdash |
|---|---|---|
Warehouse support | Snowflake, BigQuery, Redshift, Postgres | Snowflake, BigQuery, Redshift, Postgres, plus broader warehouse coverage |
dbt integration | Supported; complements the semantic layer | Native; metrics, dimensions, and relationships live alongside dbt models |
Metric definition | Structured SQL modeling, similar to the LookML pattern | YAML files co-located with dbt models |
Governance and change management | Governed definitions managed inside Omni | Git-based BI-as-code with preview environments and code reviews |
Self-serve exploration | Workbook-style interface for self-serve | Explore interface driven by dbt-defined dimensions |
SQL visibility | Inspectable SQL in the product | Inspectable SQL alongside dbt-defined metrics |
AI assistants | AI assistance built into modeling and exploration | AI agents grounded in the dbt semantic layer; accessible via Slack and MCP |
Embedding | Mature embedded analytics for SaaS teams | Embedding supported |
Lightdash puts the workflow in dbt and Git. Omni keeps the workflow inside the app. On paper, that may sound like a small setup choice. In day-to-day work, though, it affects how people model metrics, review changes, and keep definitions under control.
Best-Fit Summary by Team Type
For dbt-heavy analytics engineering teams, Lightdash is a clean fit if dbt is already your source of truth and you want BI definitions reviewed in Git.
For teams that need centralized KPI governance with analyst flexibility, Omni fits better. Its workbook-style interface gives analysts room to explore while staying inside a structured semantic layer.
For teams evaluating AI assistants, both tools ground AI in governed definitions instead of raw schema. The buying call is simpler than it first seems: do you want that grounding managed in Git, or inside the product?
That split becomes easiest to see when you look at modeling, version control, and SQL review. From there, the workflow differences carry straight into how each tool handles modeling, SQL, and version control.
Semantic Layer and Developer Workflow: How Each Tool Works Day to Day
Modeling and Metrics: Omni's Semantic Layer vs Lightdash's YAML Approach
On a day-to-day level, the biggest difference comes down to where metric definitions live. Lightdash stores metrics in Git as YAML files next to dbt models. Omni keeps them in its governed semantic layer inside the app. That one choice shapes how teams review edits, troubleshoot metrics, and keep definitions aligned.
In Lightdash, metrics and dimensions live in YAML files in Git alongside dbt models. If your team already works comfortably in dbt and Git, that setup will feel familiar. Definitions are version-controlled, tied to the dbt project, and handled through a Git-based workflow.
Omni takes a different path. It defines metrics in the app's governed semantic layer, which lets analysts work in the workbook and publish shared definitions from there. In plain English: Lightdash tends to fit dbt- and Git-native teams, while Omni tends to fit analysts who begin their work in the BI interface.
So who usually prefers which? It often comes down to metric ownership:
Lightdash fits teams where analytics engineering owns metrics in Git
Omni fits teams where analysts manage shared logic inside the BI app
Version Control, Change Management, and SQL Visibility
Lightdash's clearest edge here is Git-based change management. Because metric definitions live in Git, teams can review edits in pull requests. If you want your semantic layer handled like the rest of your software, that's a big deal.
Omni handles changes through publish and approval workflows in the product's governance layer. SQL is inspectable right in the interface, which makes it easier for analysts to debug a metric, follow the logic, and reconcile BI results with warehouse SQL.
Both products expose SQL, and that matters. It gives teams a way to check metric logic instead of treating the BI layer like a black box. The core difference is where changes are governed: Git in Lightdash, the app in Omni. That choice also affects permissions, dashboarding, and how safely nontechnical users can self-serve.
Self-Serve Analytics, Permissions, and AI Readiness
Once the semantic layer is in place, the next thing to sort out is simple: How do people use it day to day? That means how business users dig into data, how access gets managed, and whether AI works from that same metric layer or drifts off on its own.
Governed Exploration and Dashboard Workflows
In Lightdash, users explore approved dimensions and metrics inside Lightdash Explores. The experience stays closely tied to what’s already defined in dbt. That gives teams a tighter guardrail: people can work with trusted content without wandering too far from the source setup.
Omni takes a looser approach. Users can start with spreadsheet-style filters, pivots, and drill-downs, then move into SQL in the same interface. So the main difference isn’t just the UI. It’s how much room nontechnical users get after governance is already set. Lightdash keeps exploration closely connected to dbt-defined content, while Omni gives users more space to move between governed analysis and direct SQL.
Permissions follow that same pattern. Lightdash handles access at the project and space level, which limits what users can explore or publish based on role. Omni manages access through its semantic layer, where analysts decide which definitions are published and who can view or build on them.
AI Assistants Querying Warehouse Data
AI is another place where the two tools split in a pretty clear way.
Lightdash sends AI queries through its dbt semantic layer, so answers in Slack or through MCP stay tied to the same metrics used in dashboards. That matters if your team wants AI responses to match the numbers people already see elsewhere. No side path, no second set of logic.
Omni brings AI help straight into the workbook. Users can generate queries and make sense of results without leaving the interface. It feels more like an in-app assistant sitting next to the analysis itself.
So the choice is fairly direct:
Use Lightdash for Slack or MCP assistants grounded in dbt metrics
Use Omni for in-app AI help inside the workbook
Those same governance choices also shape how teams send analytics into products or other external surfaces.
Embedding and External Delivery
Omni supports embedded dashboards through iframe or SDK embedding, which makes it a practical fit for SaaS product teams that need analytics inside a customer-facing product.
Lightdash supports embedding too, but its standout edge is Git-based dashboard previews. That lets teams review BI changes in much the same way they review application code. For teams that like a code-first workflow, that can be a big deal.
Delivery Need | Stronger Fit |
|---|---|
Customer-facing embedded dashboards | Omni |
Git-based dashboard previews | Lightdash |
AI agents querying via Slack | Lightdash |
In-product AI query assistance | Omni |
These tradeoffs set up the buying scenarios in the next section.
Recommendation Matrix and Final Verdict
Omni is a good match for teams that want governed self-serve and embedded analytics. Lightdash is a better match for dbt-native teams that want metrics managed as code in Git.
The scenarios below turn those feature differences into a clearer buying call.
Comparison Table: Which Tool to Choose by Buying Scenario
Scenario | Better Fit | Why |
|---|---|---|
Startup with a small data team | Omni | Modeling happens in the app, so teams can get started without first defining every metric in dbt. |
Centralized metrics governance | Lightdash | Metrics live in YAML alongside dbt models. |
dbt-first analytics engineering | Lightdash | BI definitions stay in Git with dbt. |
Embedded analytics for SaaS products | Omni | It supports iframe and SDK embedding for customer-facing analytics. |
AI assistants grounded in governed metrics | Lightdash | AI queries run through the dbt semantic layer, so answers stay tied to the same metrics used in dashboards. |
The pattern here is pretty straightforward: pick the tool that lines up with where your team already governs metrics.
Key Takeaways
Omni fits teams that want a workbook-style interface, app-governed self-serve, and iframe or SDK embedding for customer-facing analytics.
Lightdash fits dbt-native teams that want metrics, dimensions, and dashboards version-controlled in Git alongside dbt models.
FAQs
Which tool is easier to adopt if our metrics aren’t fully defined in dbt yet?
If your metrics aren’t fully defined in dbt yet, Omni is the harder path to adopt. It relies on a real, centrally governed semantic layer built from dbt-style model definitions. So if that layer isn’t in place, setup can feel like trying to build the road while driving on it.
Lightdash is also dbt-first, which means data that hasn’t been modeled in dbt yet can add friction.
In this case, Querio is usually the easiest tool to get started with. It can work with raw warehouse schemas from day one, use dbt metrics where they already exist, and let your team build definitions bit by bit.
How much technical skill do business users need to self-serve in each tool?
Business users usually need less technical skill in Omni. Its semantic layer and workbook-style exploration are built for non-technical use, so people can get answers without writing code.
Lightdash works a bit differently. Self-serve relies on a strong dbt-backed semantic layer set up by the data team. Its YAML/Git workflow is aimed more at data-team authoring, which means non-technical users mostly use dashboards that have already been built instead of creating models on their own.
What changes operationally when metric governance lives in Git instead of the app?
When metric governance lives in Git, changes to metrics, dimensions, and relationships happen in code-reviewed files like YAML, LookML, or dbt, not through app UI edits. That cuts down on silent metric changes, gives you a clear audit trail, and makes promotion safer with PR and preview workflows.
On the day-to-day side, analytics engineering owns the semantic layer. BI tools and dashboard surfaces then render those governed definitions, so users see the same numbers wherever they look.
Related Blog Posts



