Business Intelligence
8 Metabase Alternatives When You Outgrow It
Choose the right BI replacement by your primary bottleneck—permissions, metric governance, analyst workflows, embedding, or AI-led self-serve.

If Metabase is starting to slow your team down, the fix is usually one of 8 tools: Querio, Looker, Tableau, Power BI, Sigma, Hex, Mode, or Lightdash.
I’d narrow it down like this:
- Looker for governed metrics and tight permission control
- Tableau for polished dashboards and visual analysis
- Power BI for Microsoft-heavy teams
- Sigma for spreadsheet-style work on live warehouse data
- Hex for analyst notebooks with SQL and Python
- Mode for SQL-first reporting and controlled publishing
- Lightdash for dbt-based metrics and Git-backed definitions
- Querio for AI-led self-serve analysis on live warehouse data
The article’s core point is simple: when teams grow, Metabase often starts to strain in 4 areas: permissions, metric consistency, analyst depth, and embedded analytics platforms. That’s why the right replacement depends less on “best BI tool” and more on your main bottleneck.
A few hard facts from the piece:
- Power BI Pro starts at $14/user/month
- Querio starts at $500/month
- Hex starts at $75/editor/month
- Lightdash managed cloud starts around $600/month
- Mode Pro references start around $75/user/month
- 8 out of 8 tools connect well with major warehouses like Snowflake, BigQuery, Redshift, or Postgres, with a few stack-specific exceptions
::: @figure 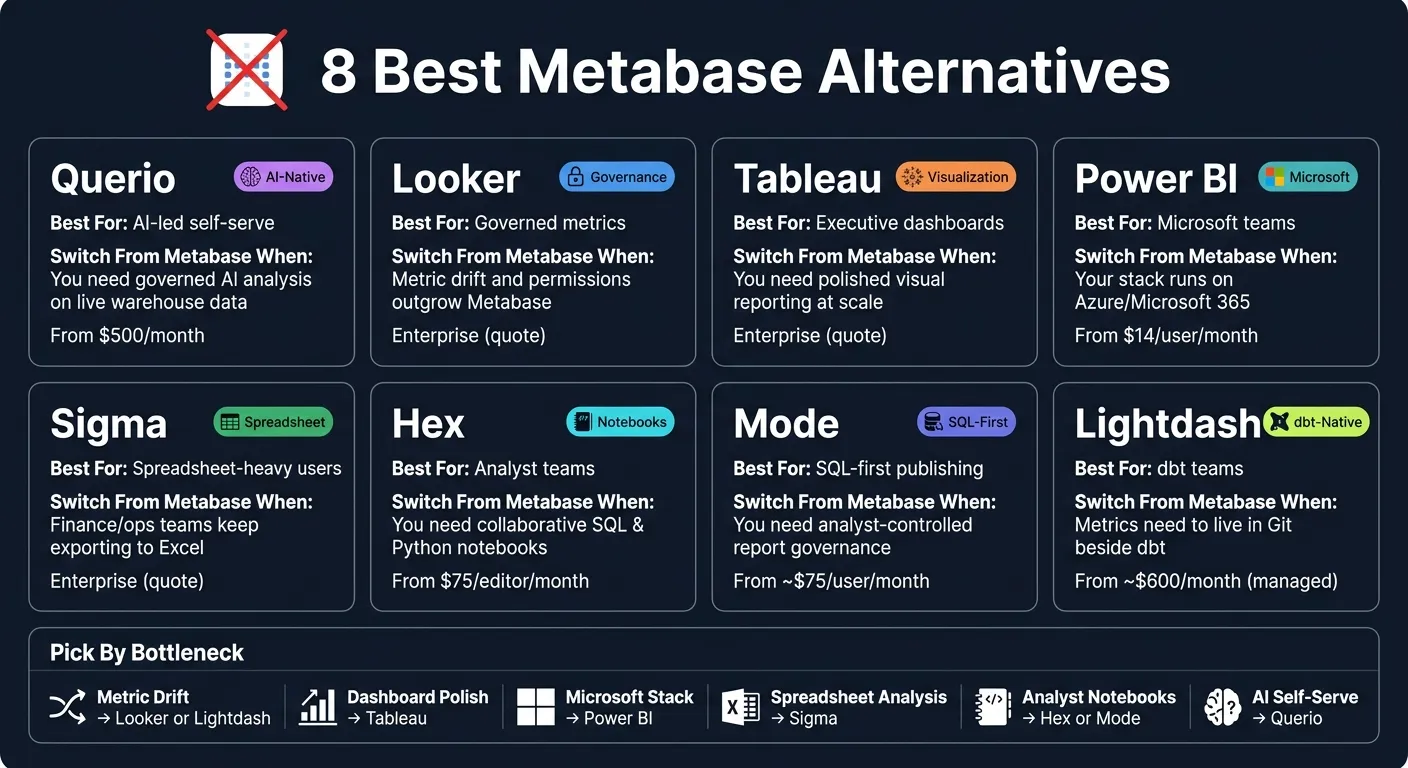 {8 Best Metabase Alternatives Compared (2024)}
:::
{8 Best Metabase Alternatives Compared (2024)}
:::
Quick Comparison
| Tool | Best for | Main reason to switch from Metabase | Main drawback |
|---|---|---|---|
| Querio | AI-led self-serve | SQL/Python notebooks plus Git-backed context | Best with a warehouse-first stack |
| Looker | Governed metrics | LookML semantic layer in Git | High cost and setup load |
| Tableau | Executive dashboards | Strong visual reporting | Cost and admin overhead |
| Power BI | Microsoft teams | Tight Azure, Excel, and Teams fit | DAX and Microsoft lock-in |
| Sigma | Spreadsheet-heavy users | Grid interface on live warehouse data | Metric logic can sprawl |
| Hex | Analyst teams | Shared SQL/Python notebooks | Less suited to non-technical users |
| Mode | SQL-first publishing | Analyst-controlled reports and notebooks | Less self-serve for business teams |
| Lightdash | dbt teams | Metrics live in dbt and Git | Needs a mature dbt setup |
My short take: if you want one answer fast, pick based on your biggest pain point, not feature count. If your issue is metric drift, look at Looker or Lightdash. If it’s dashboard polish, go with Tableau. If it’s Microsoft fit, choose Power BI. If it’s analyst workflow, check Hex or Mode. If it’s SQL vs. AI-led analysis, start with Querio. If it’s spreadsheet-style self-serve, look at Sigma.
That’s the whole article in one view.
Where Metabase Starts to Break Down
Metabase works well at the start. Then teams grow, needs pile up, and the tool can start getting in the way.
The slowdown usually shows up when teams need tighter permissions, shared metric definitions, deeper SQL work, or smoother embedded reporting. In practice, the cracks tend to appear in four places: permissions, metric governance, analyst workflow depth, and embedded delivery.
Governance and Permissions
Metabase covers basic access control. But once more teams start relying on the same warehouse data, things get messy fast.
Row-level security, cross-team permissions, and audit trails all get harder to manage as usage spreads across departments. What feels fine for a small group can turn into extra manual work once finance, ops, product, and leadership all need access to the same data.
Semantic Modeling and Metric Consistency
Metabase's in-app Models feature works for simple cases. But it doesn't hold up as a semantic layer for SaaS.
Because definitions live inside the app, version control becomes hard to manage, and shared governance starts to slip as teams grow. That matters when the same metric needs to show up across dashboards, ad hoc analysis, and embedded views on Snowflake, BigQuery, Redshift, or Postgres. At that point, in-app definitions usually stop being enough. Teams often need version-controlled modeling or a dbt-native setup instead.
| Tool | Semantic Modeling Approach | Governance Strength |
|---|---|---|
| Metabase | In-app Models | Limited at scale; lacks version control |
| Querio | Context files (SQL, Markdown, Python) synced to GitHub | High; governed context tied to repo-based workflows |
| Looker | LookML (version-controlled code) | Very high; centralized and enforced |
| Lightdash | Built directly on dbt models and metrics | High for dbt-native teams |
Self-Serve Exploration and Analyst Workflow Depth
Permissions and metrics are only part of the story. The next friction point is analyst depth.
Metabase's question builder is fine for simple filters and aggregations. But it can slow analysts down when they need complex SQL, multi-step analysis, or a more shared way to investigate a problem. Teams that want both self-serve exploration and deeper analysis often end up looking for SQL-first or notebook-based workflows.
Embedded Delivery, AI Workflows, and Deployment Fit
Metabase embedding handles basic delivery. But if you're dealing with multi-tenant products or white-label reporting, teams usually want tighter control over how data is presented and managed.
Its AI layer is also fairly limited. So teams running Slack- or chat-based workflows often look for systems built around notebooks or MCP instead. The eight tools below line up with these gaps in different ways: some focus on governance, while others lean into notebooks, AI workflows, or warehouse-native self-serve.
1. Querio
Querio closes those gaps by keeping governed context in GitHub and analysis in editable notebooks. Metric definitions live as plain SQL, Markdown, and Python files synced to a GitHub repo next to your dbt project, and every answer comes back as inspectable SQL and Python. The agent can suggest new definitions, but a logged-in human has to approve the commits.
Each answer opens in a reactive notebook, and when you make edits, the charts update on the spot. Questions asked in Slack and Teams open that same reactive notebook, which means the analysis stays open for review instead of turning into a black box.
Querio also queries your warehouse directly through encrypted, read-only warehouse credentials. So there are no CSV round-trips and no duplicate data sitting somewhere else.
Here’s what that looks like in day-to-day work.
| Dimension | Querio | Metabase |
|---|---|---|
| Primary Interface | AI Agent + Reactive Notebook | Graphical Question Builder + SQL Editor |
| Context Location | Plain files in GitHub (beside dbt) | Defined inside the application |
| Python Support | Native; agent writes and runs Python | Not a core workflow |
| Delivery | Slack, Teams, MCP, API, Web | Web, Slack (limited), API, Embedded |
| AI Approach | Agent platform with BI surfaces | BI application with AI added |
Best fit: Data teams that need governed self-serve, editable SQL and Python, and live warehouse access without extract-based workflows. It also makes sense for teams that want to stop acting as the manual middle layer for ad hoc questions. In that setup, Querio works well when governed self-serve matters more than a simple question builder.
2. Looker
When Metabase’s in-app models start drifting, Looker tackles that with LookML: a version-controlled semantic layer. It takes a code-first approach, which means metrics live in LookML instead of inside the app. That helps teams keep definitions steady, cut down on dashboard sprawl, and avoid metric drift. If shared metrics and permissions are starting to outgrow Metabase, that change can make a big difference.
Because LookML lives in Git, teams can review updates in pull requests, roll changes back, and apply fine-grained access controls. That includes row-level filters and column masking, which can matter a lot for regulated teams in healthcare and financial services.[5][10][6][8]
Looker’s Explores let business users dig into governed metrics without stepping outside LookML.[11][12] On top of that, Gemini adds conversational analytics grounded in LookML.[4][8][13]
Looker also supports iframes, SDKs, APIs, and an Extension Framework. And here’s the key part: embedded content still inherits LookML governance, so the same metric definitions carry into both customer-facing and internal apps.[3][7] Its semantic layer can also connect to other tools, including Tableau, Power BI, and Connected Sheets, through an Open SQL Interface. That makes Looker a strong choice when you want one metric backbone across a mixed-tool stack.[5][9]
| Dimension | Looker | Metabase |
|---|---|---|
| Modeling layer | LookML, version-controlled in Git | More UI-driven modeling |
| Governance | Fine-grained controls across models, Explores, fields, and row-level filters | More basic collection- and group-based permissions |
| Self-serve exploration | Governed Explores on top of the semantic model | Point-and-click exploration |
| AI approach | Gemini-powered conversational analytics grounded in LookML | Basic text-to-SQL (Metabot) |
| Embedded analytics | Iframes, SDKs, APIs, and Extension Framework | Can hit limits around customization, performance, and fine-grained access control |
| Multi-tool semantic layer | Open SQL Interface can feed tools like Tableau, Power BI, and Connected Sheets | Semantic definitions are less portable |
Best fit: Teams that need enterprise-grade metric governance, governed self-serve, and embedded analytics on a version-controlled semantic layer. It’s a strong match for BigQuery-centered stacks. The tradeoff is the setup work and the day-to-day ownership that comes with LookML.
If your main goal is broader visual reporting and executive dashboards, the next option leans more in that direction.
3. Tableau
If your team already has governed metrics and the next slowdown is reporting, Tableau is a strong next move. It helps self-serve analytics grow by pairing certified data sources with enterprise permissions. In plain English: business users get approved datasets they can explore with less risk.
Governance and Self-Serve at Scale
Tableau leans on certified data sources to keep self-serve reporting under control. These are approved datasets that business users can use without wandering into messy or untrusted numbers. Add enterprise permissions on top, and data teams get a clear way to open access while still keeping a hand on the wheel.
AI Features and Embedded Delivery
Tableau Pulse surfaces metric changes proactively. That matters for teams that want proactive metrics or customer-facing dashboards without giving up control. Embedded analytics is one of Tableau’s stronger areas, especially for polished delivery, but licensing costs can add up fast.
Deployment Options
Tableau Server gives tighter control over data residency. Tableau Cloud is a better fit for teams that want a faster setup and less infrastructure work.
| Dimension | Tableau | Metabase |
|---|---|---|
| Visualization depth | Richer visual analytics and more polished dashboards | Straightforward dashboards for everyday use |
| Governance | Certified data sources and enterprise permissions | Lighter-weight permissions |
| AI features | Tableau Pulse and proactive metric experiences | AI assistant for query help |
| Embedded analytics | Strong fit for internal apps and customer-facing products | Easier to start, but lighter for large-scale embedding |
| Deployment | Tableau Server or Tableau Cloud | Cloud or self-hosted |
Best fit: Pick Tableau when your main issue is presentation quality and governed scale, not lightweight ad hoc analysis. The tradeoff is cost and complexity. Without a BI admin, getting up to speed can be steep.
If Microsoft integration matters more than visual depth, Power BI is the next option.
4. Power BI
Power BI makes the most sense for teams that already run on Microsoft 365, Azure, or Dynamics 365. In that setup, a lot of the usual setup hassle fades away. You get single sign-on through Azure Active Directory, governance through the same Microsoft admin centers your team already knows, and Excel can sit on top of the same governed data models built in Power BI Desktop.[18]
That said, there’s a tradeoff. Power BI tends to work best for Microsoft-first teams, but it also asks for more structure in how you model data than Metabase does.
Semantic Modeling via Analysis Services
Power BI includes a full semantic model powered by the mature Microsoft Analysis Services engine. That gives teams support for calculated measures, complex relationships, and reusable business logic, so the same measures stay consistent across reports.[14][15]
In Premium, XMLA opens that same model to Excel, paginated reports, and other BI tools.[17]
Governance, AI, and Embedded Analytics
One of Power BI’s big draws is that the same semantic model sits behind browser reports, Excel, and embedded apps. In plain English: governance stays tied to the data no matter where people use it.
Role-based security (RLS) and fine-grained semantic model permissions - Read, Build, Write, and Owner - apply in the same way whether someone opens a report in the browser, pulls data into Excel, or runs a query through an embedded app.[15][21]
On the AI side, Power BI includes Key Influencers, Smart Narratives, and Decomposition Tree to help users spot patterns and dig into results. Copilot for Power BI adds chat-based analysis and report creation.[16][22]
For embedded analytics tools, Power BI Embedded on Azure lets teams launch customer-facing portals without per-user external licenses. Its capacity-based pricing can make external access easier to plan at scale.[19][20]
| Dimension | Power BI | Metabase |
|---|---|---|
| Semantic modeling | Analysis Services engine, DAX, XMLA endpoint | Lightweight models and metrics |
| Governance | RLS, semantic model permissions | Basic permissions |
| AI features | Copilot, Key Influencers, Smart Narratives | AI assistant for query help |
| Embedded analytics | Power BI Embedded (Azure capacity-based) | Lighter-weight embedding |
| Ecosystem | Microsoft 365, Azure, Fabric, Excel | Standalone, cloud or self-hosted |
Pricing: Power BI Pro is $14/user/month, Premium Per User is $24/user/month, and enterprise capacity (P1) is $4,995/month. Organizations on Microsoft 365 E5 often already have Pro rights included.[1][23][24]
Best fit: Power BI is a strong pick when your team is deep in the Microsoft stack and needs enterprise-grade semantic modeling, tight governance, and AI-assisted analysis. But the tradeoff is real. DAX takes time to learn, Premium capacity brings admin work, and the Windows-only Desktop app can box in some workflows. If Microsoft isn’t already at the center of your stack, that extra weight often isn’t worth it.
Teams that want a lighter, spreadsheet-first workflow can look at the next option.
5. Sigma
Sigma is a good match for teams that like the feel of spreadsheets but don't want to move data out of the warehouse. It uses a spreadsheet-style interface on live warehouse data in Snowflake, BigQuery, Redshift, and Databricks. That setup lets people pivot, filter, and dig into data while staying in the warehouse, which can make analysis faster and more familiar.
Governance and Self-Serve Exploration
Here's the catch: governance depends on what you already have upstream. Sigma doesn't come with its own semantic layer. Instead, it leans on dbt models and your warehouse's access controls to keep metrics and permissions lined up.
If your warehouse models and permissions are in good shape, Sigma gives non-technical users a strong self-serve path. They can explore data without needing to write SQL or wait on analysts for every small question. But if dbt or warehouse-level modeling is loose, Sigma can expose metric mismatches pretty fast. In plain English, it won't clean up messy definitions for you.
Embedded Analytics and AI
For product teams that need embedded analytics, Sigma is among the best embedded analytics tools for SaaS, supporting iFrame embedding, plus a React SDK and REST API for more custom integrations.[25][26]
Sigma AI and Cortex Agents support natural-language analysis on live warehouse data.
| Dimension | Sigma | Metabase |
|---|---|---|
| Primary interface | Spreadsheet-style interface on live warehouse data | Visual question builder / SQL |
| Semantic layer | Relies on dbt or warehouse modeling | Relies on dbt or warehouse modeling |
| AI features | Sigma AI and Cortex Agents | Metabot (text-to-SQL) |
| Warehouse-native | Yes (live queries only) | Direct query with optional caching |
Best fit: Sigma works well for spreadsheet-heavy teams that already manage data in dbt and want business users to explore live warehouse data without exports. The tradeoff is upstream governance: Sigma won't fix inconsistent modeling for you.
6. Hex
Hex is built for analyst-led teams that want SQL, Python, and shared notebooks in one place. Change an upstream cell, and every downstream output updates on its own through auto-updating notebooks. That makes Hex a stronger match when Metabase's dashboard-first setup falls short for multi-step analysis.
Analyst Workflow and Collaboration
Hex lets multiple analysts work in the same notebook at the same time. It also connects with dbt, Cube, and Snowflake's Context Studio, so teams can work with governed metrics. In plain terms, analysts can go from digging into data to shipping results without bouncing between tools.
Self-Serve and Delivery
For business users, Hex acts more like a delivery layer than a self-serve query tool. Non-technical users usually interact with data apps that analysts have already built, rather than building their own queries from scratch.
AI Features
Hex Magic and the Notebook Agent help analysts write and debug SQL and Python with less manual effort.
| Dimension | Hex | Metabase |
|---|---|---|
| Primary interface | Collaborative SQL & Python notebooks | Visual question builder / SQL |
| Primary user | Data analysts and scientists | Business users and analysts |
| AI focus | Analyst productivity and code generation | Business-user help with natural-language questions |
| Distribution | Interactive data apps | Dashboards and saved questions |
| Self-serve model | Curated apps built by analysts | Users build their own questions |
| Learning curve | Steeper; requires SQL/Python comfort | Lower; easier for non-technical users |
Best fit: Hex works well for analyst teams that need to handle advanced analysis, like statistical tests, Python transformations, and other complex work, and want a better way to share results than a shared dashboard. At $75 per editor per month on the Team plan, with unlimited viewers included on paid plans [2], it can be a good choice for analyst-led teams that are comfortable working in notebooks.
7. Mode
Where Hex leans into team analysis, Mode leans into controlled publishing. It’s a notebook-first BI tool built for analyst-led teams that want tighter control over what gets shared.
Use Mode when Metabase’s open-ended workflow starts to cause messy KPI logic and too many dashboards. The tradeoff is pretty simple: you get more control, but less self-serve access for business users.
Analyst Workflow and Governance
Mode gives analysts one place to write, version, and share SQL-based analysis, with Python or R cells alongside it. That setup makes notebook work easier to manage and easier to repeat. It also puts report and data access under tighter control, while shared workspaces and reusable assets help teams work from the same playbook.
Self-Serve and Embedded Delivery
For non-technical users, Mode works more like a read-only publishing layer. Business users consume published notebooks and dashboards instead of writing their own queries.
That means outputs stay consistent and analyst-curated. But there’s a catch: executives or operators who want to answer their own questions without SQL will usually find Mode less approachable than Metabase.
| Dimension | Mode | Metabase |
|---|---|---|
| Primary interface | SQL notebooks with Python/R cells | Visual question builder / SQL |
| Primary user | Data analysts | Business users and analysts |
| Self-serve model | Analyst-curated reports and notebooks | Users build their own questions |
| Governance approach | Centralized, analyst-controlled | More open, user-driven |
| Embedded delivery | Analyst-authored outputs and reports | Dashboard embeds |
| Learning curve | Steeper; SQL required | Lower; friendlier for non-technical users |
Pricing and Deployment
Buying Mode is usually more formal than buying Metabase. It’s a commercial platform with quote-based enterprise plans. Public pricing references mention a free Studio tier for up to 3 users with a 10 MB per-query limit, plus a Pro tier starting at about $75/user/month with a 3-user minimum.[27][29]
Packaging can change, so it’s smart to confirm current tiers with sales before you shortlist it.[27][28]
Best fit: Mode works well for analyst-led teams that need reproducible SQL, controlled publishing, and curated outputs. It’s a better fit than Metabase when your team wants cleaner SQL governance and a more structured analyst-led operating model.
8. Lightdash
If your team already runs dbt and is starting to feel Metabase’s limits around in-app models and metric drift, Lightdash takes a different path. It uses dbt models and schema.yml as the semantic layer behind data exploration. In plain English, your metric definitions stay in Git and live right next to your transformation code.
Here’s the short version of how Lightdash differs from Metabase.
| Dimension | Lightdash | Metabase |
|---|---|---|
| Semantic layer | dbt schema.yml and dbt models |
Built in the BI tool |
| Primary user | dbt-centric analysts and business users | Business users and analysts |
| Self-serve model | Governed Explorer backed by dbt metrics | Ad-hoc questions and dashboards |
| Lineage visibility | Upstream/downstream dependency views tied to dbt models | Limited |
| Deployment | Cloud or self-hosted | Cloud or self-hosted |
dbt-First Semantic Governance
Because business logic stays in dbt, teams can review and test changes the same way they handle any other code update.[30][33][34] That makes it easier to keep metrics aligned over time, instead of watching definitions slowly drift across reports.
Lightdash also pulls dbt descriptions and metadata into the UI, so people have more context while they browse and build reports.[30][32]
Self-Serve Exploration
Lightdash includes a drag-and-drop Explorer where users pick dimensions and measures from dbt models and build analyses and charts without writing SQL.[30][32][33] They can also drill from high-level charts into source rows, then save that work as reusable explores or dashboards.
For teams that share reports on a set schedule, Lightdash supports delivery through Slack, email, and Microsoft Teams.[31]
Deployment and Pricing
Lightdash supports both open source self-service BI tools and managed cloud deployment. Teams with compliance or on-prem needs can self-host. Teams that want less infrastructure work can go with managed cloud.[31]
Best fit: Lightdash works well for teams that already use dbt and want tighter metric consistency, lineage, and governed self-serve than Metabase offers.
Next, compare Lightdash’s tradeoffs with the rest of the stack.
Pros and Cons of Each Tool
Here’s the fast shortlist, sorted by the bottleneck each tool handles best.
| Tool | Biggest Pro | Biggest Con | Best Fit Team | Skip if |
|---|---|---|---|---|
| Querio | Inspectable SQL/Python on live warehouse data with an owned context layer | Requires an AI-led workflow | Data teams in 100–500-employee B2B SaaS, healthcare, or fintech companies that need governed self-serve without a BI backlog | Your team wants a traditional BI workflow with a large existing dashboard library |
| Looker | Semantic modeling keeps metrics consistent across the org | Requires someone to own LookML | Enterprise data teams with BI engineers and complex governance needs | No team member available to own the semantic layer |
| Tableau | Strong visual flexibility for polished, executive-facing dashboards | Governance gets harder as dashboards and models grow | Teams where presentation-quality reporting matters most | You care more about warehouse-native self-serve than dashboard polish |
| Power BI | Works well in Microsoft-centric environments with DAX modeling | Weak fit outside Microsoft-first stacks | Organizations standardized on Azure and Microsoft 365 | Your stack centers on Snowflake, BigQuery, or Redshift |
| Sigma | Spreadsheet-style analysis on live warehouse data | Less natural for notebook or AI-led workflows | Analyst teams that want a familiar grid on Snowflake or BigQuery | Your team wants notebooks, code, or AI-assisted exploration |
| Hex | Collaborative notebooks with SQL and Python side by side | Built for analysts, not broad business-user self-serve | Data and analytics teams that publish interactive work from notebooks | You need governed self-serve for non-technical users |
| Mode | SQL, Python, and dashboards in one workflow | Less AI-native than Querio | Analyst-heavy teams that want a single environment for querying and reporting | You want agent-driven analysis or an AI-led workflow |
| Lightdash | dbt-native metric governance keeps definitions close to transformation code | Depends on dbt already being the source of truth | dbt-centric analytics teams that want governed exploration | You are not already using dbt as the foundation of your metric layer |
By Bottleneck
Same eight tools. Just grouped by the job they do best.
Governed metrics and enterprise modeling: Looker, if someone on the team can own the semantic layer.
Visual and executive reporting: Tableau, if polished dashboards matter more than warehouse-native self-serve.
Microsoft-centric BI: Power BI, if your stack already runs on Azure and Microsoft 365.
Spreadsheet-style warehouse analysis: Sigma, for analysts who want a familiar grid on live warehouse data.
Notebook-centric analyst workflows: Hex for collaborative analysis and interactive apps. Mode for SQL, Python, and dashboards in one place.
dbt-first semantic governance: Lightdash, if dbt is already the source of truth for metrics and transformations.
AI-native self-serve on live data: Querio, for teams whose main bottleneck is manual ad hoc analysis. Its context layer stays in GitHub beside dbt.
Use the next section to narrow the shortlist by stack, governance, and workflow.
How to Pick the Right Tool for Your Team
Start with your biggest bottleneck. That's the whole game.
Are you stuck on governed metrics? Better dashboards? Microsoft stack fit? Spreadsheet-heavy analysis? Notebook-based work? dbt-led modeling? Or AI-first self-serve? Each tool below beats Metabase in one of those areas. None fixes everything at the same time.
Use that lens to make the call.
Choose Looker when you need one governed source of truth for metrics across multiple teams. The tradeoff is simple: expect enterprise pricing and plan for someone to own the model day to day.
Choose Tableau for executive dashboards and stronger visual reporting. The catch? It still leans on upstream modeling to keep metrics consistent, and it's a weaker pick when setup speed matters.
Choose Power BI if your team already works inside Microsoft 365, Azure, or SQL Server. In a Microsoft-first setup, it makes a lot of sense. Outside that world, the fit gets weaker.
Choose Sigma when finance, revenue operations, or ops teams keep pushing Metabase data into Excel for analysis. It feels familiar for spreadsheet-heavy work. The tradeoff is that governance depends fully on whatever you already have upstream in dbt or the warehouse.
Choose Hex for collaborative SQL/Python notebooks. Hex and Mode both fit analyst-led teams, but they lean in different directions. Hex is better for notebook collaboration, while Mode is better for controlled publishing. Choose Mode for SQL-first reporting with Python layered on top and analyst-controlled publishing, with less business-user self-serve.
If dbt already owns your metrics, the next decision should happen in the transformation layer, not the BI layer. Choose Lightdash when dbt already defines your metrics and transformations. If dbt is not already your source of truth, you lose most of what makes Lightdash a strong fit.
Choose Querio when the bottleneck is ad hoc request volume and you need governed, AI-native self-serve on live warehouse data. The tradeoff: it works best when your team is ready to move away from a dashboard-first workflow.
Pick the tool that matches your main constraint, then stop there.
FAQs
::: faq
When should a team leave Metabase?
A team should move past Metabase when basic reporting stops being enough and it needs tighter governance, AI-native workflows, and better performance as usage grows.
That point usually comes when data lives in too many places, semantic modeling starts to feel thin, or the business needs consistent, governed metrics, audit trails, inspectable AI-generated logic, and live warehouse-native connectivity. :::
::: faq
Which tool is best for governed metrics?
For governed metrics, Querio fits teams that want a shared semantic layer with the same definitions across AI-generated answers, dashboards, and notebooks. Data teams set up joins and metrics once, which creates a single source of truth and cuts down on metric drift.
Looker is also a strong pick for code-based metric governance, and ThoughtSpot works well for search-driven exploration on top of governed models. Querio stands out because it pairs governance with inspectable, AI-driven SQL and Python. :::
::: faq
How do I choose the right replacement?
Choose based on your team’s technical maturity, data setup, and governance needs. Put the most weight on:
- Metric governance so KPIs stay consistent across teams
- AI workflow that matches how non-technical users or analysts work
- Integration and deployment with your warehouse
It also helps to compare pricing models side by side. Then test your shortlist with free trials or startup tiers to see how each option holds up as usage grows. :::