Business Intelligence
open source self service BI tools
Compare Metabase, Apache Superset, and Redash — setup, connectors, visualizations, governance, and which tool fits non-technical teams or data engineers.
Open-source self-service BI tools let teams analyze data, build dashboards, and share insights without vendor lock-in or expensive licenses. These tools are especially helpful for reducing IT dependency and empowering non-technical users to explore data independently. Popular options include Metabase, Apache Superset, and Redash - each offering unique strengths for different use cases.
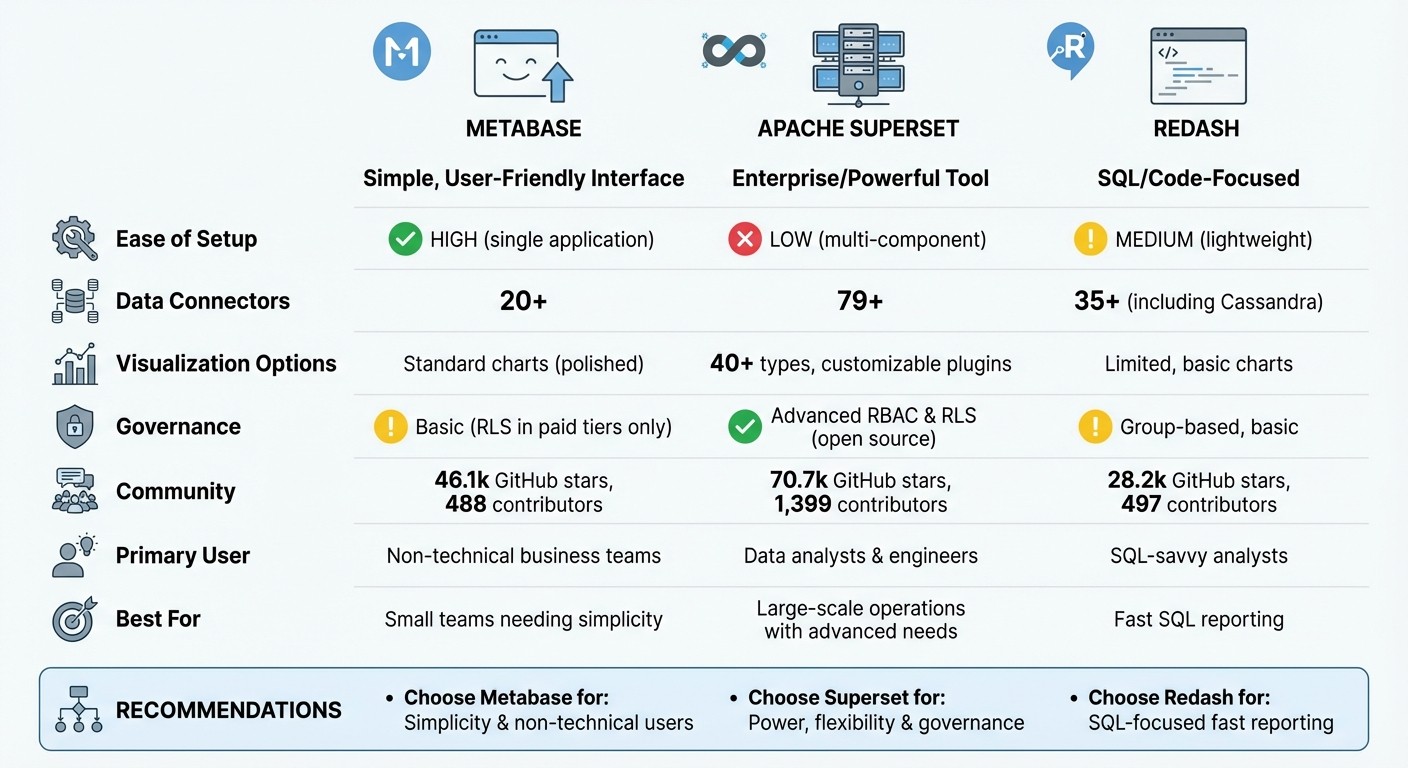
Metabase: Easy to set up, ideal for non-technical users, supports 20+ data sources, and features a visual query builder for business users. Great for small teams but limited in governance features unless upgraded.
Apache Superset: Designed for large-scale operations, with 79+ data connectors and advanced governance tools like RBAC and RLS. It requires more technical expertise for deployment but offers extensive visualization options.
Redash: Lightweight and SQL-focused, with 35+ data connectors and a simple interface. Best suited for technical teams but offers fewer visualization options compared to the others.
Quick Comparison:
Feature | Metabase | Apache Superset | Redash |
|---|---|---|---|
Ease of Setup | High (single app) | Low (multi-component) | Medium (lightweight) |
Data Connectors | 20+ | 79+ | 35+ |
Visualization | Standard charts | 40+ types, plugins | Basic charts |
Governance | Basic (paid tiers) | Advanced (RBAC, RLS) | Basic |
Primary User | Non-technical teams | Data engineers | SQL-savvy analysts |
Choosing the right tool depends on your team's skills and needs. For simplicity, go with Metabase. For power and flexibility, pick Superset. For fast SQL reporting, Redash is a solid choice.
Open Source BI Tools Comparison: Metabase vs Apache Superset vs Redash
1. Metabase
Ease of setup
Metabase simplifies deployment by functioning as a single, unified application. You can get it up and running in about five minutes using Docker or a JAR file. This straightforward setup requires minimal technical know-how, making it an excellent choice for small to medium-sized businesses. Unlike platforms with multiple components that need separate configurations, Metabase's design minimizes operational complexity, saving both time and resources.
Data connectors
Metabase connects to 20+ data sources, including both SQL and NoSQL databases like PostgreSQL, MySQL, Snowflake, BigQuery, Redshift, and MongoDB. This broad compatibility means most teams can integrate their existing data systems without needing custom setups. Designed with non-technical users in mind, the platform allows connections to be established through an intuitive visual interface, avoiding the hassle of manual configuration.
Visualization options
Metabase offers a wide variety of business data visualization methods, ranging from standard charts like line, bar, and pie charts to more advanced options such as Sankey diagrams, waterfall charts, funnels, and pivot tables. Its visual query builder lets users create queries by navigating menus instead of writing SQL code. Tools like Metabot AI, drill-through menus, and X-rays enhance interactive data exploration.
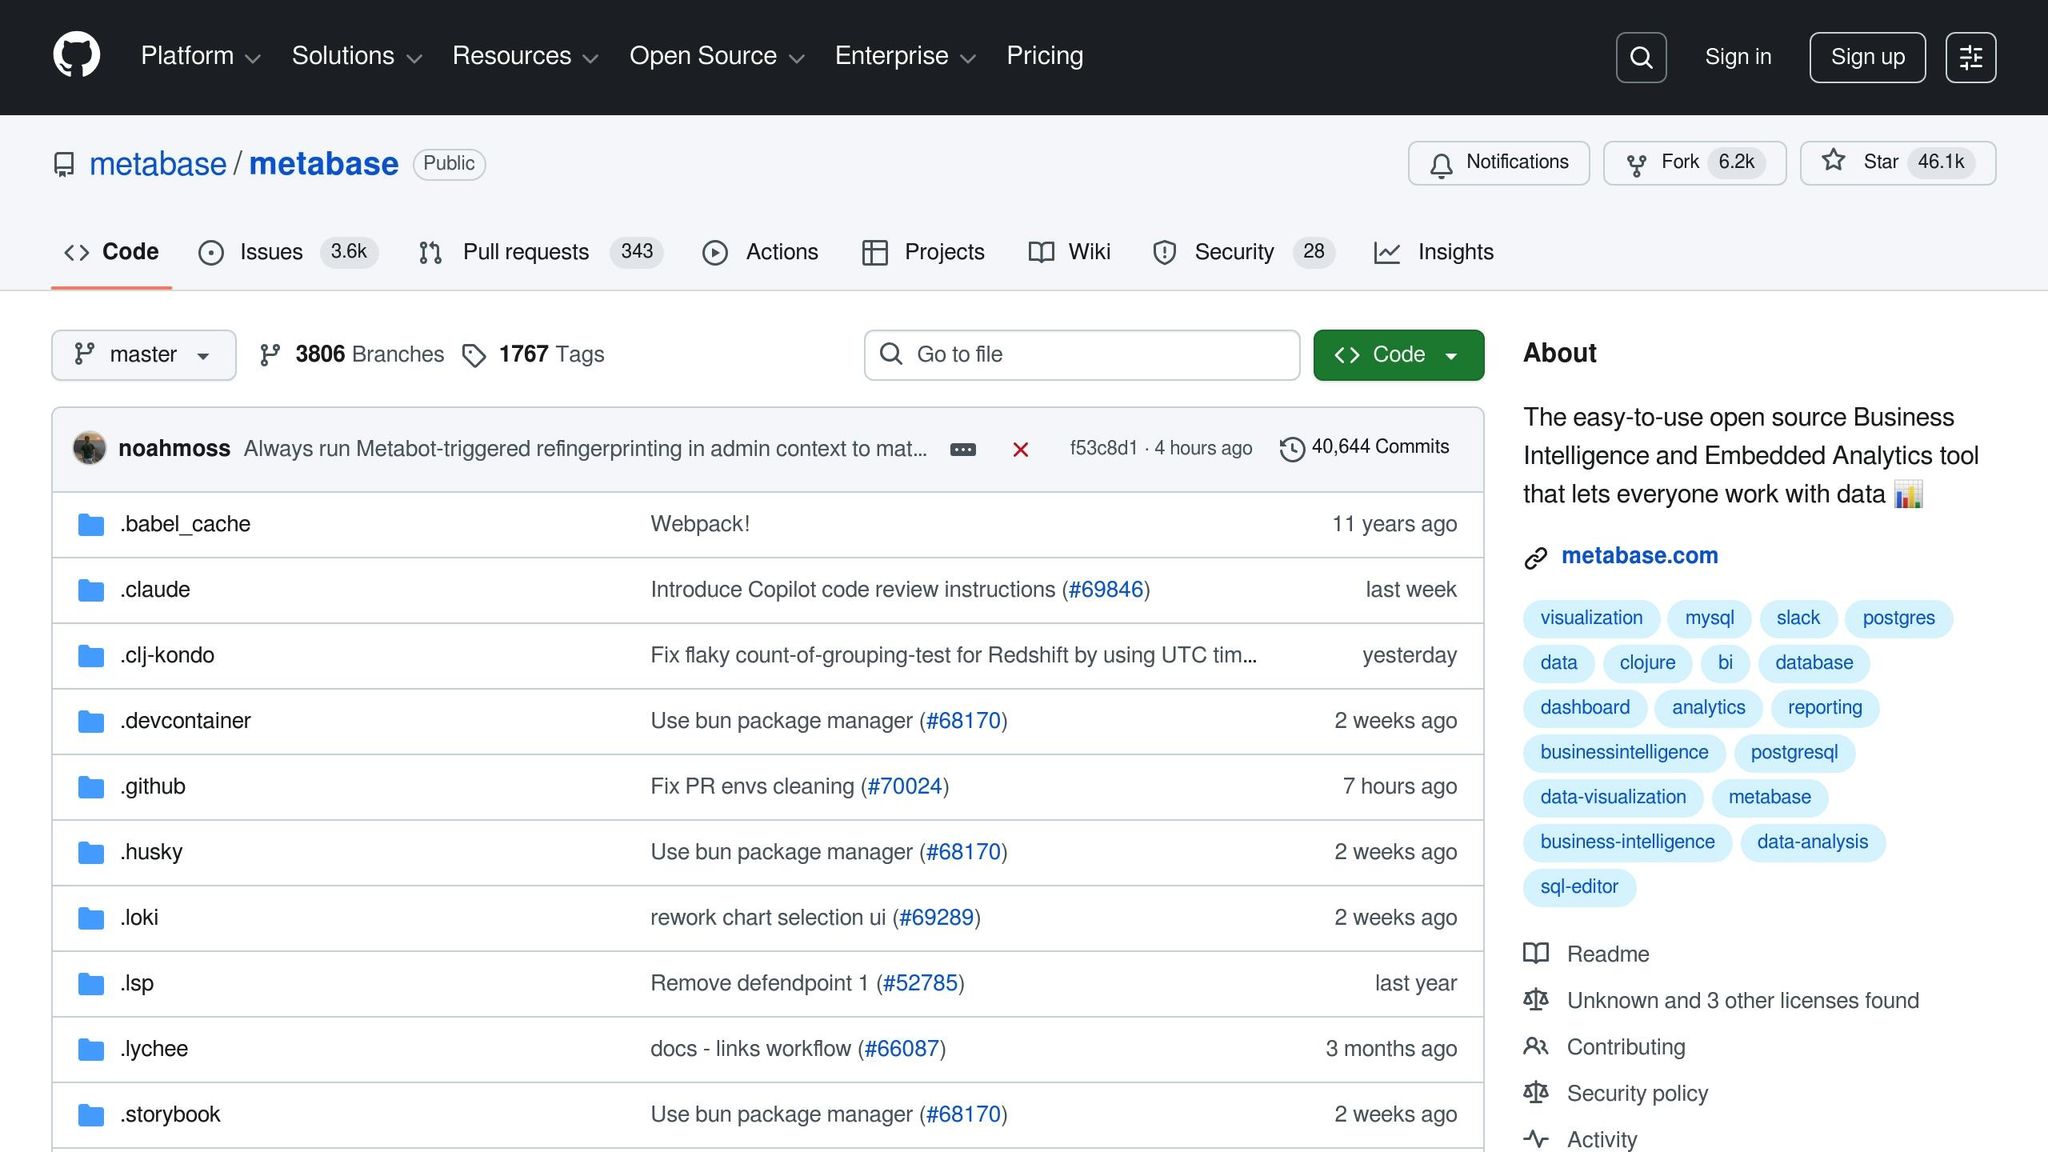
For actionable insights, Metabase supports Slack and email alerts, scheduled dashboard subscriptions, and interactive dashboards. When building these, it is crucial to avoid common BI dashboard pitfalls to ensure data clarity. Its popularity is evident, with the project amassing over 46,100 stars and 6,200 forks on GitHub as of February 2026 [5].
Community support
Metabase's open-source repository boasts 488 contributors [5], showcasing an active and engaged community. This strong involvement ensures regular updates, quick bug fixes, and new features, making the platform reliable and continuously evolving. With this level of community activity, Metabase remains a competitive tool for production environments. Next, we’ll explore another platform to continue the comparison.
2. Apache Superset
Ease of Setup
Apache Superset provides a quickstart guide that utilizes Docker Compose for fast local testing. However, deploying it in production requires a more elaborate setup involving Kubernetes, Helm charts, Celery workers, and a caching layer to ensure scalability and reliability[8][10]. While it may not be as straightforward as some other tools, this complexity underscores its design for enterprise-level data management. It's a tool built for environments that prioritize scalability and robust infrastructure.
Data Connectors
Superset supports connections to 79 databases[6], making it highly versatile. Integrations are handled through a Python DB-API driver and a SQLAlchemy dialect for each supported database engine[6]. It works seamlessly with modern cloud-based platforms like Snowflake, BigQuery, and Redshift, as well as traditional databases such as PostgreSQL, MySQL, Presto, Trino, and Apache Hive[6]. Users can input a SQLAlchemy URI through the web interface and use the "Test Connection" feature to verify credentials before saving[7]. For Docker-based installations, additional database drivers can be specified in the requirements-local.txt file. Beyond its connectivity, Superset’s visualization tools add another layer of sophistication to its analytical capabilities.
Visualization Options
Superset offers more than 40 visualization types, ranging from basic line charts to advanced geospatial visualizations[4]. Its plug-in architecture allows developers to create and integrate custom visualization plugins, expanding its functionality even further[4]. Users can build charts using a no-code "Explore" interface with drag-and-drop features or use SQL Lab for more complex data preparation tasks[4]. Dashboards are highly customizable, supporting features like custom CSS templates, color palettes, and interactive elements such as cross-filters, drill-to-detail, and drill-by options. Jinja templating adds flexibility by enabling dynamic dashboards and SQL queries[4].
Community Support
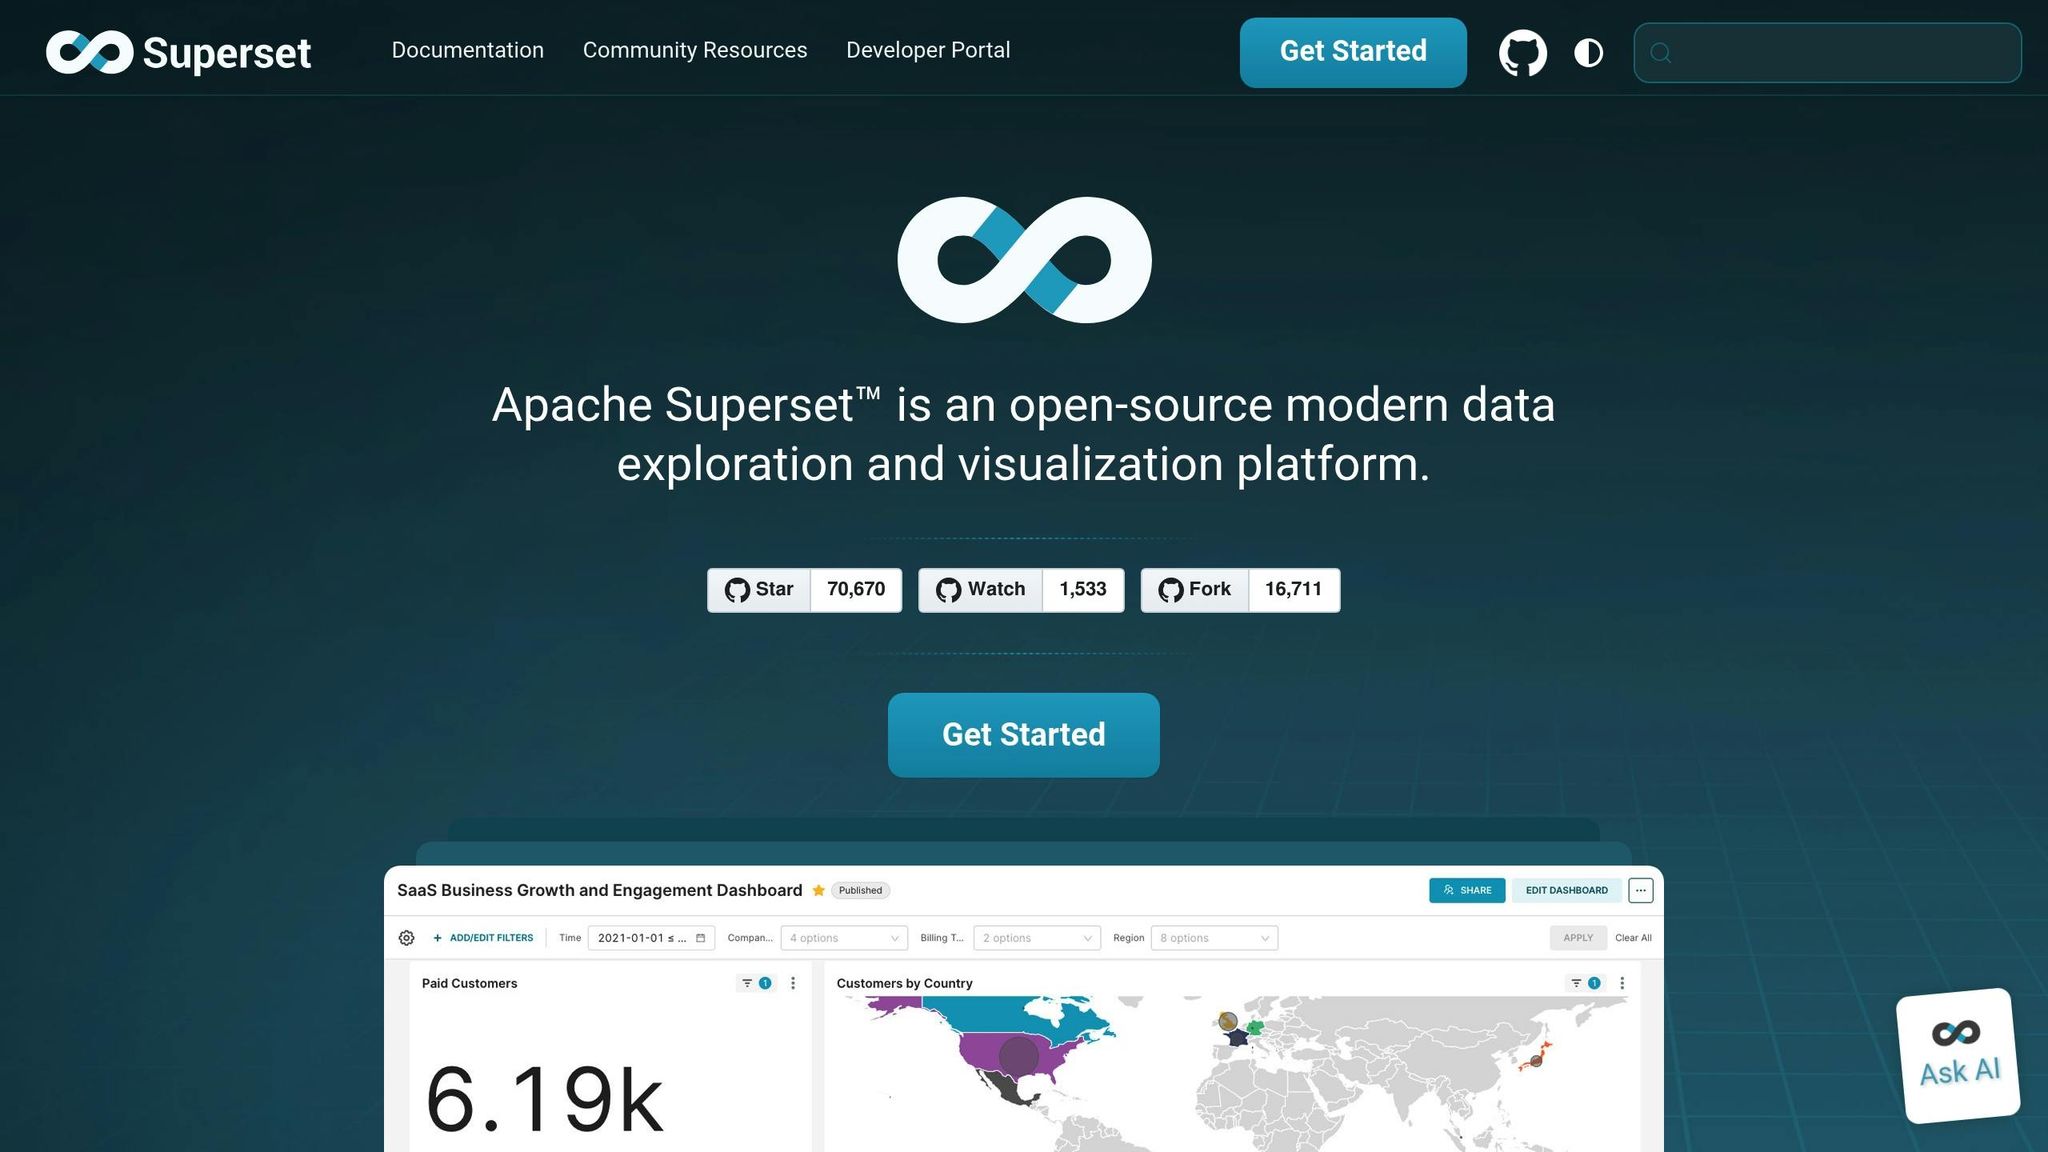
Apache Superset boasts a strong community, with 1,399 contributors and over 243 releases, including version 6.0.0, which launched in December 2025[9]. On GitHub, the project has earned over 70.7k stars and 16.7k forks, reflecting its widespread adoption and active development[9]. Users can access support through a variety of channels, including a Slack workspace with over 20,000 members, GitHub Discussions, StackOverflow (via the "apache-superset" tag), and multiple mailing lists[11]. Comprehensive documentation is available, featuring user guides like "Creating Your First Dashboard", a Developer Portal, and an extensive API reference.
"Superset shines when you have data engineers/analysts comfortable with SQL and a need for advanced governance and performance tuning." - Valentina Vianna, Community Manager, BIX Tech[1]
3. Redash
Ease of Setup
Redash provides several deployment options to fit different needs. You can use preconfigured images for AWS EC2 and Google Compute Engine, run a setup script tailored for Linux distributions, or deploy via Docker for containerized environments. For a basic setup, ensure your system has at least 4GB of RAM and a capable CPU to handle background tasks and API processes. Once deployed, you’ll complete a simple web-based setup to create an admin account. For production environments, it’s recommended to enforce HTTPS and limit traffic to ports 22, 80, and 443. Advanced configurations, like setting up email alerts or enabling Google OAuth authentication, can be managed using environment variables in a .env file. After setup, Redash is ready to connect with a wide range of data sources.
Data Connectors
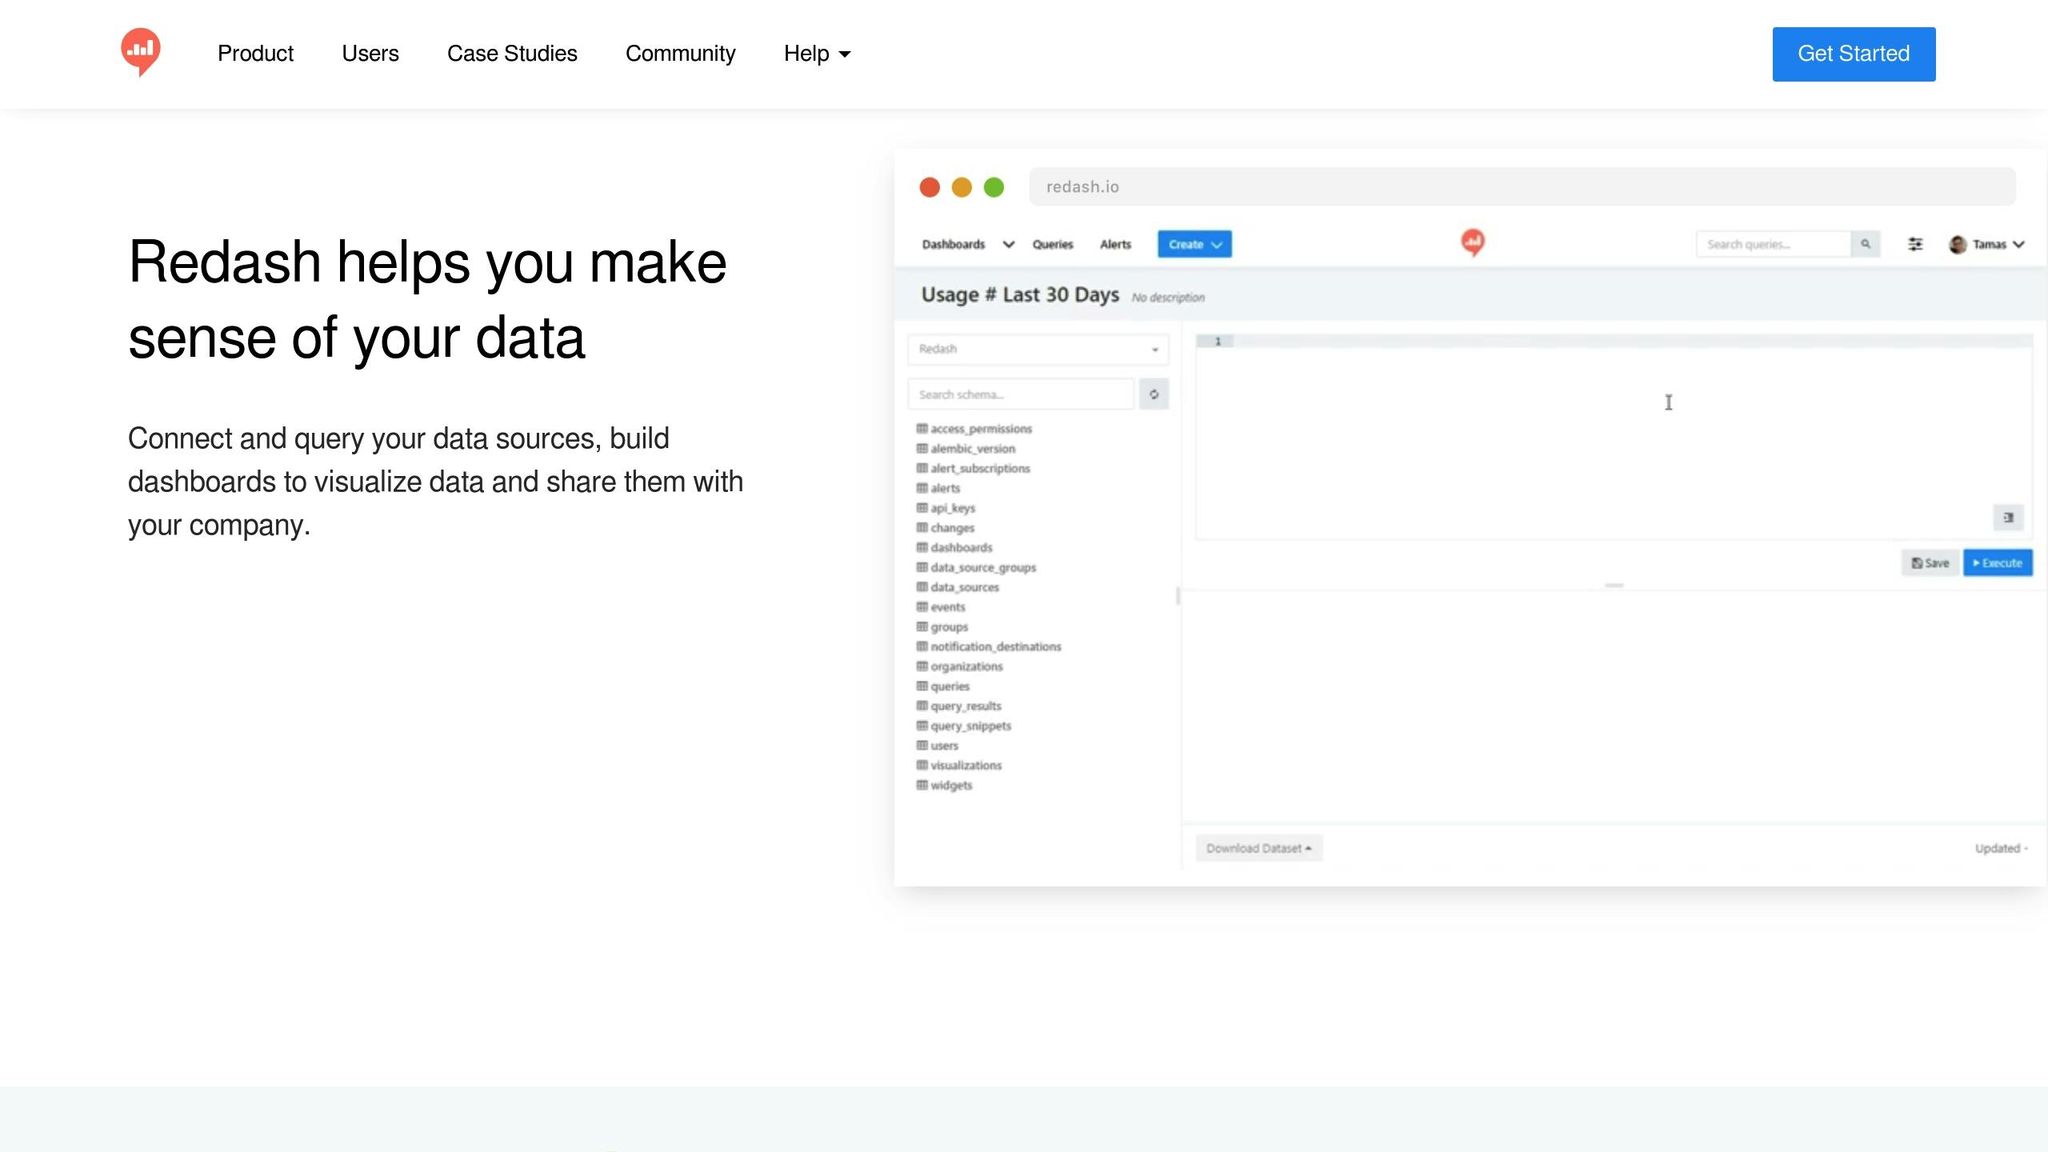
Redash supports over 35 native data connectors, spanning both SQL and NoSQL platforms [12]. This includes popular relational databases like PostgreSQL and MySQL, as well as Big Data solutions like Snowflake, BigQuery, and Databricks. It also integrates with APIs such as Google Analytics, Salesforce, and JIRA. For platforms not included by default, you can use Redash’s extensible API to add custom connectors. The browser-based SQL editor simplifies query building with features like a schema browser, click-to-insert functionality, and auto-complete. Redash even allows querying across multiple data sources at the same time, and scheduled refreshes ensure your visualizations stay up-to-date.
Visualization Options
Redash transforms query results into actionable visuals. While tables are the default output, the platform supports a variety of visualization types. Dashboards are highly interactive, with drag-and-drop controls for reordering columns, applying filters, and setting automatic refresh intervals (from one minute to 24 hours). It also renders JSON documents, inline images from URLs, and clickable HTML links. To provide additional context, teams can embed Markdown text boxes directly into dashboards for commentary or explanations.
Community Support
Redash has a strong presence on GitHub, boasting 28.2k stars and 4.6k forks, with contributions from 497 developers [13]. It’s trusted by millions of users across thousands of organizations worldwide. For support, users can turn to the Discussion Forum, GitHub Issues, or the Discord server for developer-focused questions. Detailed documentation walks you through the entire workflow - from adding data sources and writing queries to creating visualizations, building dashboards, and collaborating with teammates.
"Redash is as essential as email to my company. We love data but accessing the data is a pain without Redash. Any company I go to, I get them hooked on Redash." - Ben Dehghan, Co-Founder, Data Miner
Getting Started w/ Metabase | Open Source Data Visualization Tool
Advantages and Disadvantages
Each of these tools brings its own strengths and trade-offs, catering to different needs and team setups.
Metabase stands out for its simplicity, thanks to its single Java application deployment. This makes it a great choice for small teams without dedicated DevOps support. Its visual query builder is another highlight, empowering non-technical users to create dashboards without relying on technical teams. However, its governance features, like row-level security, are quite limited in the free version. Teams requiring advanced controls will need to upgrade to paid tiers for those features [1].
Apache Superset is all about power and flexibility. With over 40 visualization types and a plugin system for custom charts, it’s a top pick for teams that need extensive options. It also offers robust governance features, including role-based access control (RBAC) and row-level security (RLS), even in its open-source version. This gives it a clear edge for teams focused on data governance best practices [1].
"Superset wins when your data team needs power, extensibility, and granular control - in open source - at scale." - Valentina Vianna, Community Manager at BIX Tech [1]
However, the complexity of its multi-component architecture - requiring web servers, Celery workers, and a metadata database - makes it the most challenging to set up and maintain [1].
Redash strikes a balance by offering over 35 data connectors, including unique options like Cassandra [14]. It’s especially appealing to SQL-savvy analysts who need quick access to queries and parameterized reports. The tool also benefits from an active community. On the downside, it offers fewer visualization options than Metabase or Superset, and its interface feels less polished. Additionally, its limited visual query builder makes it less user-friendly for non-SQL users [3].
Here’s a side-by-side comparison of key features for each tool:
Feature | Metabase | Apache Superset | Redash |
|---|---|---|---|
Ease of Setup | High (single application) | Low (multi-component) | Medium (lightweight) |
Data Connectors | Solid coverage | Extensive, requires configuration | 35+, including Cassandra |
Visualization Options | Standard library, polished | 40+ types, customizable plugins | Limited, basic charts |
Community Support | Very high (46.1k GitHub stars) | High (70k+ GitHub stars) | Active (28.2k GitHub stars) |
Open Source Governance | Basic (RLS in paid tiers) | Advanced RBAC & RLS | Group-based, basic |
Primary User | Non-technical business teams | Data analysts & engineers | SQL-savvy analysts |
Conclusion
Choosing the right BI tool depends on your team's specific skills and requirements. Metabase is a great choice for non-technical users who need quick access to KPIs without diving into SQL. Its single-application deployment and visual query builder make it easy to get started. Apache Superset, on the other hand, is tailored for data teams that need more power, flexibility, and advanced governance features like row-level security and RBAC. It's particularly useful for managing complex datasets or multi-tenant setups. Meanwhile, Redash shines for SQL-savvy teams looking for a lightweight, fast reporting tool.
"In 2026, the winning BI tool is the one your teams adopt - and your data team can operate - without friction." - Valentina Vianna, Community Manager, BIX Tech [1]
These tools each bring unique strengths to the table, but selecting the right one requires a strategic approach. Start by using the 10-Question Framework: assess who will build dashboards (business users or analysts), your security needs (basic vs. row-level), how fast deployment needs to happen, whether custom visualizations are required, and the expected workload. Answering these questions will guide you toward the best fit. For example, organizations leveraging open-source analytics tools often see a 30% drop in licensing costs compared to commercial options. Plus, self-service BI tools can reduce report generation time by up to 80% [15], making the investment in setup and training well worth it.
"If you're building a self-service data culture, Metabase is a strong default compared to other tools. If you're building a centralized, scalable BI layer led by data teams, Superset is often the better foundation." - Laura Chicovis, Technology Enthusiast, BIX Tech [2]
To put these insights into action, follow a structured rollout plan. Start with a 90-day timeline: dedicate 30 days to a small proof of concept, 30 days to scale models and governance, and 30 days for production hardening and training. Before launching, create a Golden Dataset with clear naming conventions and well-documented metrics. This step minimizes confusion and encourages team-wide adoption, ensuring a smoother transition to your chosen BI tool.
FAQs
Which tool fits my team’s skill level?
If your team isn't deeply technical or is just starting with data analysis, Metabase could be a solid choice. Its user-friendly interface and drag-and-drop tools make it simple to create dashboards and dig into data without needing advanced skills.
On the other hand, if your team has strong SQL expertise and requires more advanced customization or the ability to scale, Apache Superset might be a better fit. It provides robust data exploration capabilities and the flexibility to tackle complex visualizations and manage large datasets effectively.
What security controls do I need (RBAC/RLS)?
Managing access in open-source BI tools often relies on Role-Based Access Control (RBAC) and Row-Level Security (RLS). These mechanisms are essential for ensuring that users can only interact with the data and features that align with their specific roles.
For instance, Superset utilizes Flask AppBuilder to define roles and assign precise permissions. This allows administrators to control who can view or modify certain data and functionalities. Similarly, Metabase offers built-in tools to manage permissions and segregate data effectively, ensuring users only see what they’re supposed to.
By implementing RBAC and RLS, these tools provide a structured way to maintain data security and streamline user access based on their responsibilities.
How do I roll out self-service BI in 90 days?
Rolling out self-service BI in just 90 days is entirely doable with a clear, step-by-step plan. Start by selecting the right BI tool that aligns with your organization's needs. Then, focus on preparing your data sources to ensure they're ready for integration. Once that's in place, deploy the platform and make it accessible to your teams.
To drive success, prioritize user training so everyone understands how to use the new system effectively. Encourage adoption by promoting the platform's benefits and gathering user feedback to refine the experience. Finally, establish governance policies to maintain data accuracy and security.
By sticking to this structured approach, you'll empower your teams to make informed, data-driven decisions within the 90-day timeline.
Related Blog Posts


