Business Intelligence
How to Switch BI Tools Without Losing Your Metrics
Audit KPIs, centralize metric logic, rebuild dashboards in parallel, validate 7–14 days, then cut over in phases.

Switching BI tools without changing your numbers comes down to one rule: move metric logic before you move dashboards.
If I were doing this today, I’d keep it simple:
- Audit every KPI, dashboard, alert, and dependency first
- Put metric rules in one governed semantic layer outside the BI tool
- Rebuild old and new dashboards side by side
- Compare outputs for 7–14 days
- Cut over in stages only after owners approve results
That matters because even if the warehouse stays the same, numbers can still shift. A new BI tool can change filters, time zones, date logic, cache timing, row-level security, and drill-down behavior. And a gap of even $1.50 in a finance metric or a small change in a conversion rate can trigger hours of doubt.
Here’s the short version of the process:
-
List your top metrics first
I’d start with the 10–15 KPIs leadership uses most. -
Write down the exact logic
That includes formula, grain, source tables, fixed exclusions, SQL, and owner. -
Map old metrics to new canonical metrics
If two dashboards define churn or MRR differently, settle that before any rebuild starts. -
Test old vs. new line by line
Compare totals, trends, dimensions, drill-downs, scheduled reports, and role-based access. -
Log every mismatch
Mark each one as a defect, timing gap, approved change, or rounding issue. -
Roll out in phases
Move executive and finance dashboards first. Archive stale assets instead of rebuilding all of them.
A few failure points show up again and again: duplicate joins, wrong date fields, null handling, default filters, and broken row-level security. So I’d test under the same snapshot, date range, time zone, role, and freshness cutoff every time.
The goal isn’t just to move dashboards. It’s to keep historical comparability, avoid trust issues, and make sure people still believe the numbers on day one.
The rest of the article walks through that process step by step, from the first audit to the final cutover.
::: @figure 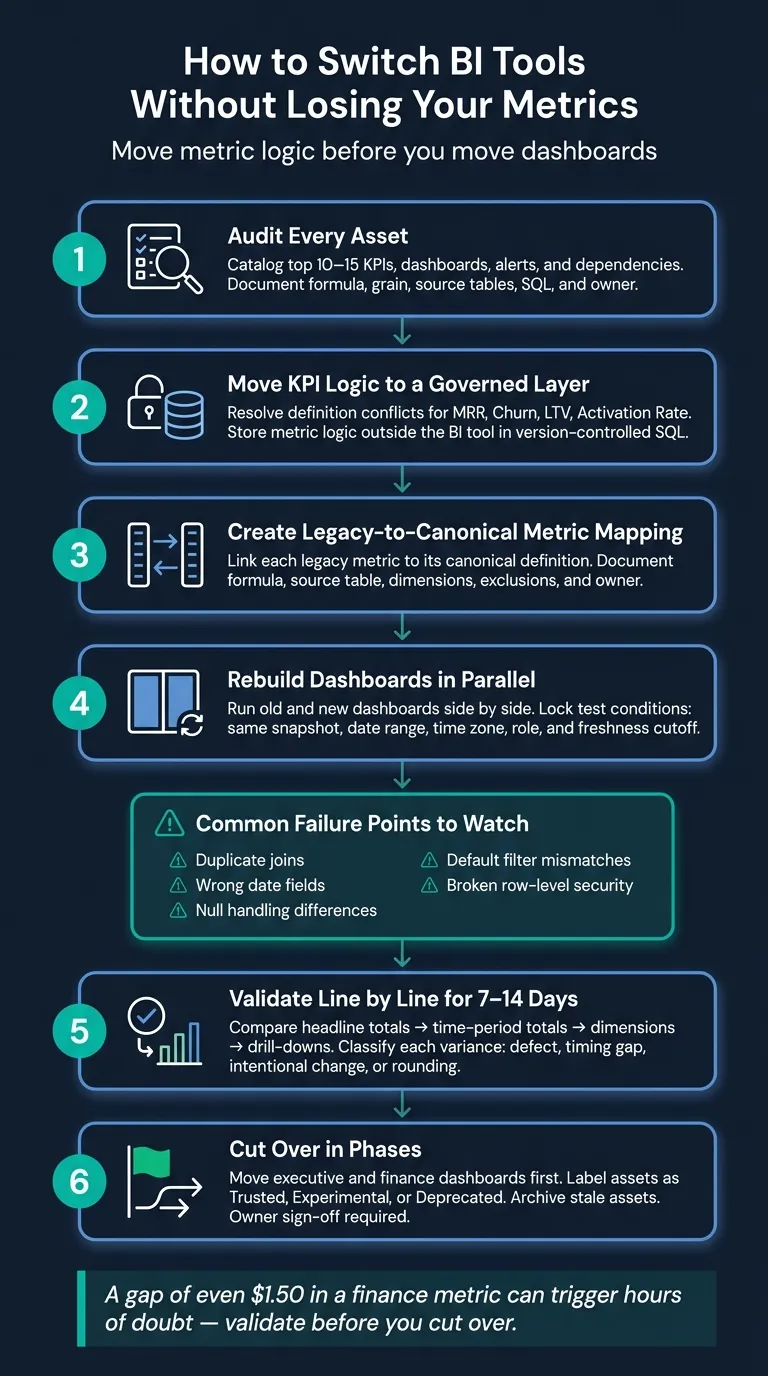 {How to Switch BI Tools Without Losing Your Metrics}
:::
{How to Switch BI Tools Without Losing Your Metrics}
:::
How to migrate BI tools faster using AI
::: @iframe https://www.youtube.com/embed/_T-nLoryw54 :::
Audit your current metrics, dashboards, and dependencies
Start with the metrics and assets that leadership already uses in reports. The goal here is simple: build the audit artifact itself. That means a clear record of what exists, what each item means, and what depends on it. If you do this well, you can keep metric definitions steady and preserve historical comparability during the tool switch.
Build a metric inventory table
Create a single metric inventory that spells out the exact definition of each KPI. Start with the 10–15 metrics that appear in board decks and executive reviews most often.
For each metric, document these fields:
| Field | What to capture |
|---|---|
| Metric Name | Plain-English name (e.g., ARR, Gross Margin) |
| Business Owner | Named individual responsible for the definition |
| Grain | Level of detail (e.g., per account, per day, per seat) |
| Formula | Exact calculation, including denominator logic |
| Source Tables | Authoritative warehouse tables and approved join paths |
| Fixed Filters | Exclusions like test accounts or internal users |
| Exact SQL Definition | The specific code that produces the number |
| Known Exceptions | Edge cases or overrides that affect the output |
Pay close attention to fixed filters. Exclusions like test accounts or internal users must be written down plainly, because they can change the number even when the underlying data does not.
This inventory becomes the source of truth when KPI logic starts to conflict.
Catalog dashboards, alerts, and downstream consumers
After your metric inventory is in place, catalog every dashboard, alert, scheduled report, embed, and Slack or email delivery tied to those metrics. For each asset, note who owns it, who uses it, how often it runs, and what breaks if it is wrong.
Pull usage data from audit logs in Snowflake, BigQuery, Redshift, or Postgres. Track executions per week or month, unique consumers, and the last execution date. For each dashboard, document the warehouse models it queries, row-level security rules, freshness requirements, and any scheduled deliveries attached to it.
Embedded reports and customer-facing analytics need extra care. They often come with API or SDK dependencies, which means you may need a full rebuild instead of a simple port.
| Asset Type | Migration Reality | Risk Level |
|---|---|---|
| Semantic Models | Require manual translation of logic (e.g., LookML to YAML) | High |
| Row-Level Security | Must be remapped to new user groups and roles | High |
| Embedded Analytics | Usually require manual rebuild of API/SDK workflows | High |
| Scheduled Reports | Low-risk to migrate; validate for broken deliveries | Moderate |
| Warehouse Connections | Usually go live in days in Snowflake, BigQuery, Redshift, or Postgres | Low |
Use execution frequency and consumer count to decide what gets validated first. If two dashboards use the same KPI, but one is checked every day by executives and the other has not run in months, the choice is pretty obvious.
Separate critical assets from dashboard sprawl
Treat the audit as a way to cut scope. Focus first on the assets that executives, finance, and customer-facing teams rely on to make decisions. Migrate executive scorecards first. Then move to finance and operational dashboards. Archive stale or duplicate assets instead of rebuilding them.
That kind of scope reduction shrinks the number of places where things can fail and keeps the team focused on the dashboards that people actually use.
Use the audit to settle definition conflicts before you rebuild anything. Once the audit is done, move the highest-value metrics into a governed layer, then rebuild the dashboards around them.
Move KPI definitions into a stable, governed metrics layer
Take KPI logic out of dashboards and put it into one governed metrics layer. That stops definitions from drifting every time a team rebuilds a chart or report. Before you touch any dashboard, lock the canonical definition for each KPI.
Resolve definition conflicts before rebuilding anything
The same metric often means different things in different dashboards. That's where rebuilds go off the rails. Before rebuilding anything, choose one definition and write down why that definition won.
For each KPI, document:
- the business decision it supports
- the source table
- the formula
- the grain
- the owner
- the refresh cadence
- known limitations
Once that contract is approved, encode it in version-controlled models and semantic definitions.
| Priority Metric | High-Risk Ambiguity to Resolve | Recommended Owner |
|---|---|---|
| MRR | Treatment of discounts, taxes, and cancellation timestamps | Head of Finance |
| Activation Rate | Specific actions and time window (e.g., 7 days post-signup) | Head of Product |
| Churn | Exact point of "loss" - end of period vs. cancellation date | Customer Success |
| LTV | Full formula, time horizon, and segment handling | Head of Marketing |
Store metric logic as inspectable, reusable code
After definitions are settled, keep joins, aggregations, and fixed filters in warehouse SQL models such as dbt. Store metric definitions in a governed semantic layer. Keep ad-hoc work in a notebook environment, and leave presentation formatting in the visual layer.
Querio's context layer fits this setup well: metric definitions, approved joins, and trusted queries are stored as plain SQL, Markdown, and Python files synced to GitHub in the same repo as your dbt project. The agent can suggest new definitions, but only a human can approve and commit them. That keeps the logic in version-controlled SQL, Markdown, and Python, so teams can inspect it and move it when needed.
Create a legacy-to-canonical metric mapping sheet
Create one mapping sheet that links each legacy metric to its canonical metric. This becomes your migration control document - the handoff artifact between the person who ran the audit and the person rebuilding dashboards.
Each row should include the legacy metric name, canonical metric name, formula, source table, approved dimensions, exclusion rules, owner, usage rank, and parity status. That sheet then becomes the source for dashboard rebuilds and parity checks.
Don't copy every legacy metric as-is. If an old metric is just a reusable base metric plus a segment filter, split it. Define the base metric once, then apply the segment filter at the dashboard level. That cut makes parity issues easier to manage and makes new segments simpler to add without changing the metric definition itself. Use the canonical mapping as the baseline for line-by-line parity testing.
Rebuild dashboards in parallel and validate outputs line by line
Only validate metrics that already map to canonical definitions. And don't shut down the old setup the second the new one looks ready. Run both side by side for 7–14 days and use that stretch as a test window. [5] The point is simple: make sure every KPI, filter, drill-down, and security rule returns the same result before anyone's day-to-day work gets thrown off. [3][4][7]
Run an apples-to-apples validation protocol
Start by locking the test conditions: the same warehouse snapshot, date range, time zone, currency, user role, and data freshness cutoff. [3] If you skip that step, a mismatch doesn't tell you much. It could be a bug, a timing issue, or just a different default filter.
Then compare results in layers. Begin with headline totals. Next, check totals by time period. After that, break the numbers out one dimension at a time, like region, product, channel, or customer segment. Finish with at least one full drill-down from the top-line number to the underlying records. Say the old tool shows $12,450,000 in U.S. revenue and the new tool shows $12,449,998.50. If that falls within a pre-approved tolerance, it passes. If the gap is bigger, it stays open until someone resolves it or documents it. [3][5][8]
Set variance thresholds by metric type instead of using one blanket rule. Exact-count metrics, like active customers, may need a zero-difference rule. Financial totals may allow a small approved rounding gap. Rates and ratios may need a percentage-point threshold, since small denominators can swing the result more than you'd expect. Classify each variance as one of these:
- defect
- timing gap
- intentional change
- accepted rounding
The owner signs off only after every out-of-tolerance item is closed. [3][5][8]
If results split, go after the most likely failure mode first.
Common failure points and how to diagnose them
Most mismatches come from grain, filters, joins, or security rules. This table shows the failure modes teams run into most often and the fastest way to isolate each one. [3][9]
| Symptom | Likely Cause | Diagnostic Check |
|---|---|---|
| Customer count is higher in the new tool | Join duplication or missing DISTINCT |
Compare row count vs. COUNT(DISTINCT customer_id) before and after each join |
| Revenue differs despite matching transaction volume | Different date fields or refund treatment | Compare revenue by each candidate date field; reconcile refunds separately |
| Conversion rate shifts while numerator looks stable | Different denominator population or null exclusion | Validate numerator and denominator independently by day and channel |
| Totals differ only for certain users | Row-level security or role filters aren't equivalent | Run the same query under each role; compare permitted keys and drill-down results |
| Historical totals match except near month-end | Late-arriving data, fiscal-calendar differences, or snapshot timing | Re-run both tools against an identical historical snapshot; compare refresh timestamps |
| Summary doesn't match even though detail rows do | Aggregation, rounding, or distinct-count behavior differs | Recalculate the summary from exported detail rows; compare precision and aggregation method |
| Results match interactively but scheduled reports differ | Cache, stale data, or subscription-specific filter | Compare delivery query, cache age, and refresh completion time |
Null handling and default filters are easy to miss, but they often explain the gap. One dashboard may open to "last 30 days" while another includes the current partial day. One tool may group null dimensions under "Unknown" while another drops them altogether. Test with filters cleared, set to a single value, and set to multiple values. Then export the applied filters from both tools so you can compare defaults directly. [3][6]
Dashboard parity checklist and validation queries
Use this checklist as the cutover gate. A good parity check usually starts with a spot check against the source tables in your warehouse. In Snowflake, BigQuery, Redshift, or PostgreSQL, a query like this lets you check whether the new semantic layer returns the same revenue total as the legacy calculation for a fixed period:
SELECT
  'legacy' AS source,
  SUM(revenue) AS total_revenue,
  COUNT(DISTINCT customer_id) AS unique_customers
FROM legacy_revenue_source
WHERE order_date BETWEEN DATE '2026-08-01' AND DATE '2026-08-31'

UNION ALL

SELECT
  'new_layer' AS source,
  SUM(revenue) AS total_revenue,
  COUNT(DISTINCT customer_id) AS unique_customers
FROM canonical_revenue_source
WHERE order_date BETWEEN DATE '2026-08-01' AND DATE '2026-08-31';
Run this for every priority metric in your canonical mapping sheet. Log the output in a variance table with one row per dashboard, metric, filter state, and comparison period. Then automate the check so it runs nightly and writes results to a warehouse table such as metric_parity_diffs. That gives the team a clean way to watch drift across the entire parallel window. [3][5][8][9]
A dashboard is ready for cutover only when all of these checks pass: [3][4][7][8]
- Headline totals match within approved tolerances
- Trends reconcile across daily and monthly views
- Critical dimensions agree
- Row-level security returns equivalent results for at least two representative roles
- Scheduled deliveries pass parity checks
- Dashboard owner has signed off in writing
Any unresolved discrepancy stays open in the variance log until it's fixed or clearly marked as an intentional change.
When the checklist passes, move to phased cutover.
Cut over in phases and keep stakeholder trust intact
Once parity passes, move the cutover in phases. That keeps risk under control and helps people trust what they’re seeing. Each asset should move only after permissions, row-level security, and data freshness are checked in the target warehouse. Use the variance log from validation as the gate for each phase.
Roll out by trust level, owner approval, and rollback readiness
Push assets forward in stages, not all at once. For each one, remap and verify permissions and row-level security for every role, then confirm freshness in the target environment. [1]
It also helps to label migrated assets in plain language:
- Trusted
- Experimental
- Deprecated
An asset should move ahead only after it passes in production with the approved roles and refresh window.
Once a domain is standardized, retire the legacy queries. Don’t leave them running in parallel, where they can confuse users or split trust. [2]
Record intentional differences instead of hiding them
Not every difference is a defect. Some are planned, approved, and expected. Treat those separately.
Keep an exception log for intentional differences such as restated historical data, changed time zones, and approved backfills. [1] That way, teams don’t waste time chasing changes that were made on purpose.
Final migration assets checklist
Leave the migration with these concrete deliverables in hand:
| Asset | Purpose |
|---|---|
| Asset labels | Trusted, Experimental, or Deprecated status per asset |
| Verified access and freshness record | Confirmed permissions, RLS remapping, and freshness per role |
| Exception log | Intentional differences: restated history, time zone changes, approved backfills [1] |
| Retired-query register | Legacy queries fully removed from active use [2] |
FAQs
::: faq
How do I choose parity thresholds by metric type?
Start by grouping metrics based on business impact. Give the strictest validation to the 10–15 headline metrics used in board decks, executive dashboards, and weekly reviews.
For those critical metrics, aim for exact parity during a 30-day shadow period, with matching filters, grain, and time-zone conventions. For less critical metrics, small variances may be fine if they come from intentional logic changes and are documented and approved. :::
::: faq
What should I rebuild first if I have too many dashboards?
Start with a usage audit before rebuilding anything. First, retire reports no one uses. Then narrow your focus to the 10–15 metrics that actually matter in board decks, executive dashboards, and weekly reviews.
Here’s the order that makes sense:
- Audit the top 20 most-viewed dashboards and assign an owner to each critical metric.
- Standardize definitions in a governed semantic layer using version-controlled SQL or Python.
- Rebuild only the dashboards that survive the audit.
- Validate the old and new systems in parallel for one reporting cycle.
That approach keeps the work tight. It also helps you avoid a common trap: rebuilding a pile of dashboards that looked important at some point, but don’t drive decisions now. :::
::: faq
How do I preserve historical comparability during the switch?
Run the old and new systems in parallel for at least one full reporting cycle. Then formally reconcile the key metrics. Compare outputs line by line with the same date ranges and filters so you can spot gaps in logic, data grain, or filter behavior before you shut down the legacy tool.
Also review high-value dashboards, shift business logic into a governed semantic or context layer, and confirm parity with inspectable SQL or Python. :::