Business Intelligence
How to Migrate Dashboards Between BI Tools (Checklist)
Step-by-step checklist to inventory, map logic, rebuild visuals, validate parity, and cut over BI dashboards safely.

A BI dashboard migration works when I treat it like a rebuild, not a copy job. I need to audit every dashboard, map every metric and join, rebuild filters and row-level security access, and test source vs. target before cutover.
Here’s the short version:
- I inventory dashboards, charts, metrics, filters, schedules, embeds, and permissions
- I retire low-use and ownerless reports instead of moving everything
- I map tables, joins, grains, date logic, and KPI formulas before rebuilding visuals
- I rebuild filters, drill paths, subscriptions, and RLS
- I run a parity test for totals, row counts, date boundaries, and restricted-user views
- I cut over only after technical review and business approval
A few numbers stand out. About 30% of enterprise reports may have had no opens in the last 12 months. And many teams need a 2- to 4-week parallel run to check that the new tool matches the old one.
If I had to reduce the whole process to one line, it would be this: move the logic first, then move the dashboards.
Quick comparison
| Step | What I check | Main risk if skipped |
|---|---|---|
| Audit | Usage, owners, dependencies, schedules | I move dead or broken reports |
| Map logic | Joins, data types, KPI rules, calendars | Numbers change |
| Rebuild | Visuals, filters, drill paths, access | Users lose key behavior |
| Validate | Totals, counts, dates, RLS output | Bad cutover |
| Cutover | Parallel run, freeze, sign-off | Confusion and trust issues |
What I like about this checklist is that it keeps the work plain: know what exists, know how it works, rebuild it carefully, and prove the numbers match.
::: @figure 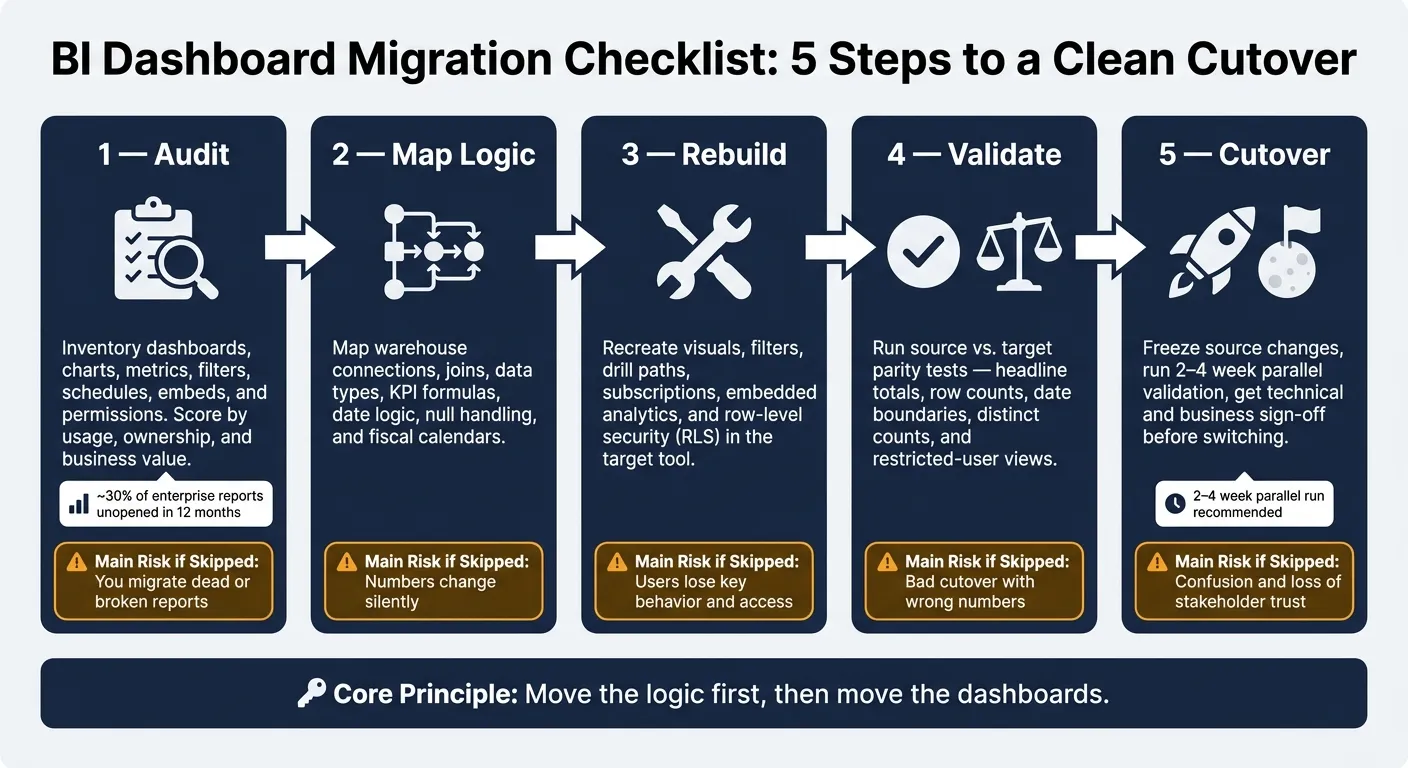 {BI Dashboard Migration Checklist: 5 Steps to a Clean Cutover}
:::
{BI Dashboard Migration Checklist: 5 Steps to a Clean Cutover}
:::
Migrate from Power BI, Tableau & Qlik to AI-Ready Analytics
::: @iframe https://www.youtube.com/embed/iyfhhZtgBqc :::
1. Audit the source environment before you rebuild anything
Start by auditing the source environment. That gives you a clear picture of what should move, what should be retired, and what needs to be rebuilt from scratch.
Build a complete migration inventory
List every asset in your current BI estate: dashboards, reports, charts, data sources, calculated fields, filters, drill paths, schedules, alerts, embeds, and permissions. For each asset, note the owner, intended audience, last-used date, refresh cadence, subscriptions, and any downstream alerts or scheduled reports.
Usage telemetry is the most objective signal here. Track the average number of views per week, month, or quarter, the number of people who use the asset, and the most recent open date so you can sort high-value assets from the rest [1].
About 30% of typical enterprise reports have not been opened in the last 12 months. So low-usage assets should not move by default [3].
If an asset has no named owner, no measurable usage, and no live source system, put it on hold.
Once the inventory is done, the next job is to map each dependency into the target semantic model.
Score assets by business value, complexity, and risk
After the inventory is in place, score each asset based on decision-criticality, ownership, and duplication [3].
| Asset Category | Priority | Key Risk |
|---|---|---|
| Executive scorecards | Critical | KPIs with no tolerance for definition drift |
| Financial statements | High | Rigid hierarchies, complex formatting |
| Operational dashboards | High | Interactive monitoring, frequent use |
| Redundant or legacy reports | Low - retire | Low usage, outdated or duplicate sources |
Mark duplicates, unowned dashboards, and anything with no measurable usage for retirement, not rebuild. A migration is a good time to clean up the report estate [3].
Record layout, filters, drill paths, and dependencies
Don’t stop at the visuals. Document the full dependency chain. That means the visual layout, filter behavior, drill paths, and navigation links. It also means the plumbing behind the scenes: data sources, warehouse connections, tables, joins, dbt models, and dataflows.
| Dependency Category | Key Items to Document |
|---|---|
| Data infrastructure | Warehouse connections, tables, joins, dbt models, dataflows |
| Business logic | Metric definitions, DAX/SQL measures, calculated fields, parameters |
| Access control | Row-level security (RLS), workspace permissions, SSO/IAM config |
| Operational metadata | Refresh schedules, gateway settings, stored credentials, API calls |
| User context | Owners, audience, last-used date, view frequency, subscriptions |
| Interactivity | Filters, drill-down paths, navigation links |
Check workspace-specific settings, stored credentials, and semantic model links. Those do not transfer automatically between environments [1]. A report can look fine on the surface and still serve stale data if the source credentials were never revalidated.
Use this inventory as the baseline for mapping models, calculations, and metric definitions.
2. Map data models, calculations, and metric definitions
Semantic mapping comes before visual rebuilding. If joins, grains, or calendars drift, rebuilt dashboards won't match the source. Use the inventory from section 1 as the source map for this step.
Map connections, tables, joins, and data types
Start by making sure every warehouse connection in the source setup has a verified match in the target tool. If you're working with Snowflake, BigQuery, Redshift, or Postgres, confirm that the target tool connects to that same warehouse.
After that, audit every join. Check cardinality for each relationship, and make sure you know how the model handles many-to-many relationships before rebuilding any dashboard. It's also smart to run row-count checks at the intended grain before you touch charts.
Data types can quietly break things. If a field needs casting, do it in the warehouse model - ideally in a dbt staging layer - not in the BI layer, where logic can drift over time. Rebuild the dashboard layer only after the model matches.
Rewrite calculated fields without changing business meaning
Every calculated field, DAX measure, LookML dimension, or custom SQL expression needs to be rewritten in the target tool's syntax. But this isn't just a syntax swap. Treat each rewrite as a parity check.
For every metric, document:
- numerator
- denominator
- grain
- null handling logic
- fiscal calendar rules
- time zone assumptions
Pay close attention to date logic, null handling, fiscal calendars, time zones, and currency formatting.
| Transformation Type | Recommended Location |
|---|---|
| Joins, aggregations, base filters | Warehouse SQL model (e.g., dbt) |
| Business metric definitions (KPIs) | Semantic layer |
| Exploratory logic | Notebook environment |
| Visual formatting | Dashboard layer |
Keeping joins and aggregations in the warehouse - not inside the BI tool - makes the logic reusable across tools and easier to audit.
Store approved definitions where the team can review them
Once metrics are rewritten, store the approved definitions somewhere analysts, data owners, and business stakeholders can review and reuse them. A good setup is version-controlled SQL, Markdown, and Python in the same Git repo as dbt.
After definitions are aligned, rebuild visuals, filters, and platform permissions in the target tool.
3. Rebuild dashboards, filters, and permissions in the target tool
Once the semantic layer is approved, rebuild the dashboard layer in the target tool. The aim is simple: get the same answers, the same filters, and the same drill behavior in the new tool. If someone opens the target dashboard, they should be able to answer the same business questions and follow the same filter and drill paths.
Recreate visuals, filters, and drill behavior
Go dashboard by dashboard. Rebuild each chart, then check the details that tend to trip teams up: starting filters, date ranges, filter dependencies, sorting, tooltips, and formatting. That includes decimal separators, percentage displays, and currency symbols such as $1,234.56.
Then test drill paths and cross-filtering. This part matters more than people expect. Two tools can point to the same data and still behave differently once a user starts clicking around.
Handle unsupported visual types and embedded use cases
Not every chart type will have a one-to-one match in the target tool. In those cases, rebuild the business intent, not the exact visual. A custom waterfall chart, for example, might need a different chart that still shows the same trend clearly.
Embedded analytics need their own pass. Rebuild them, then reconnect any API, SDK, or iframe dependencies. Do the same for scheduled delivery setups by recreating rules, recipient lists, and output formatting in the target tool.
| Asset Type | Effort | Rebuild Focus |
|---|---|---|
| Dashboards | Moderate | Visual tiles, drill paths, filter interactivity |
| Embedded Analytics | High | API/SDK custom workflows, iframe implementations |
| Scheduled Reports | Moderate | Delivery triggers, recipient lists, formatting |
Recreate row-level and column-level access deliberately
Map identity and access controls before rebuilding reports, not after, to avoid access drift and rework [2]. Start by mapping source users and groups to target roles. Then rebuild RLS and column restrictions, and test each role one by one.
Executives, analysts, managers, and restricted users should each see exactly what they’re supposed to see - nothing more.
These rebuilt visuals, filters, and access rules set the baseline for source-versus-target testing in the next step.
4. Validate output parity and plan cutover
With dashboards rebuilt and permissions set, the last step is simple in theory and picky in practice: prove the new tool gives the same answers as the source system.
That’s the final gate before cutover. Once visuals, filters, and access rules are in place, validation tells you whether the rebuilt dashboard actually matches the source.
Run a source vs. target test matrix
Use a structured comparison for every dashboard marked critical in your inventory. Check the metrics, filters, drill paths, and access rules that matter most. The table below covers the main areas to test.
| Test Area | Source Value | Target Value | Tolerance | Reviewer | Status |
|---|---|---|---|---|---|
| Headline Totals | $1.2M | $1.2M | 0% | Finance Lead | Pass |
| Row Counts | 45,201 | 45,201 | 0% | Data Eng | Pass |
| Distinct Counts | 12,400 | 12,398 | <0.1% | Analyst | Review |
| Subtotals (Region) | $400k | $400k | 0% | Sales Ops | Pass |
| Date Boundary | Dec 31 | Jan 1 | 0% | QA | Pass |
| Drill Paths | Level 3 | Level 3 | N/A | Product | Pass |
| Restricted User | 5 Rows | 5 Rows | 0% | Security | Pass |
Treat any Review or Fail row as an open issue before cutover.
The date boundary check matters more than it may seem. It often catches week-start settings or fiscal year rules that shift numbers into the wrong period.
If a row fails, use that result to trace the root cause in the next table.
Diagnose the most common migration breakpoints
Most mismatches come from a short list of usual suspects. If you know where to look, debugging gets a lot less painful.
| Breakpoint | Cause | Detection Test | Fix |
|---|---|---|---|
| Date Logic Mismatch | Different week-start or fiscal year settings | Compare "Week 1" totals across both tools | Standardize calendar in semantic layer |
| Null vs. Zero | Tool-specific handling of empty cells | Filter for nulls in both tools | Use COALESCE in SQL or the data model |
| Metric Drift | Logic duplicated in the visual layer vs. the model | Compare the same KPI across 3 reports | Centralize logic in the semantic layer |
| Filter Scope | "Include" vs. "Exclude" logic differences | Apply multi-select filters and compare results | Re-map filter interactions in the target tool |
| Currency Rounding | Floating point vs. decimal precision | Compare results at 6 decimal places | Cast to Decimal in the warehouse |
| Performance Regression | Unoptimized live queries vs. cached extracts | Measure load time and flag slow load times | Optimize warehouse joins and indexing |
Metric drift is usually the trickiest one. A KPI can look fine in one report and still be off in another if the logic lives in several places. The safer move is to keep the definition in one semantic layer so the problem doesn’t pop up again after migration.
After fixes are in place, rerun the matrix until every critical row passes.
Cut over only after technical and business sign-off
Once every critical test passes, freeze source changes so both tools are being compared against the same data state.
Complex enterprise setups often need a 2- to 4-week parallel validation period per report [1]. During that window, both systems run side by side so teams can spot gaps before the switch.
After that, get explicit sign-off from both groups:
- The technical team, such as data engineering and security
- Business owners, such as Finance, Sales Ops, or whoever owns the numbers
Also keep a close eye on refresh failures, stale caches, and permission drift, especially on RLS-protected reports [1]. In import-mode setups, broken refresh credentials can quietly leave stale data in place after cutover [1].
Conclusion: Keep one migration record per dashboard and standardize the checklist
Dashboard migrations run much more smoothly when each dashboard has its own migration record. Keep it simple: one migration record per dashboard.
That record should hold the full picture of how the dashboard works, not just a status note. Capture the data chain, metric definitions, security rules, filter behavior, validation results, and sign-off dates.
| Migration Record Component | Details to Capture |
|---|---|
| Inventory | Owner, audience, usage frequency |
| Data Chain | Source tables, joins, calculated field logic |
| Security | RLS rules, user roles, SSO config |
| Interactivity | Filters, drill-downs, tooltips |
| Validation | Parity test results, SQL verification |
| Status | Sign-off date, sunset date, archive link |
Think of this record as the single source of truth for each dashboard migration. It gives the team one place to follow the dashboard from inventory to validation to retirement, without digging through scattered docs, tickets, and Slack threads.
The bigger point is portability. You want metric logic to move cleanly before the next tool switch shows up. A lot of migration issues start when business logic is buried inside the BI tool’s metadata layer. That’s when teams end up doing painful reverse engineering instead of a clean handoff.
A better path is to store approved logic in SQL, Markdown, or Python alongside dbt. Then the next migration is a code port, not a rescue mission. Keep the context layer outside the BI tool so the logic stays with the team.
FAQs
::: faq
How long does a dashboard migration usually take?
A dashboard migration usually takes 6 to 10 weeks for smaller mid-market setups and 10 to 16 weeks for larger, more complex environments. That timeline does not include post-cutover stabilization, which often adds a 30- to 90-day dual-run phase to confirm parity.
What drives the schedule? In most cases, it comes down to data readiness, semantic-layer complexity, and whether dashboards need to be rebuilt from scratch.
If you're talking about full-scale modernization, teams should plan for a 6- to 12-month operating window. :::
::: faq
What should we migrate first?
Start with a full inventory of your existing dashboards. Don’t just lift and shift every report into the new setup.
Instead, audit what you have, keep the dashboards people use most, and retire the ones that are unused or overlap with others. That step alone can save a lot of time and cleanup later.
From there, focus on stable, high-impact workflows first, like executive KPIs or finance reports. Leave fast-changing logic for later. The idea is simple: move only clean, defensible business logic into the new environment. :::
::: faq
How do we catch KPI mismatches before cutover?
Run the old and new systems side by side for 30 days. Then compare the top-line numbers line by line, including revenue, active users, and pipeline.
If the numbers don’t match, dig into the cause. In most cases, the gap comes from one of three places:
- transformation mismatches
- metric definition drift
- filters applied the wrong way
Don’t stop at headline metrics. Check the drill-downs, date slicers, and row-level permissions too. A report can look fine at the top and still fall apart once someone clicks deeper.
It also helps to use a 30-question test with ground-truth answers. That gives you a simple way to confirm the new system matches what you know to be correct.
A governed, shared semantic layer can help stop metric drift before it turns into a bigger mess. :::