A Practical Guide to Standardization of Data in Analytics
Learn the essentials of standardization of data. This guide covers governance, schemas, and tools to create a single source of truth for reliable analytics.
published
Outrank AI
standardization of data, data governance, data management, business intelligence, analytics strategy
b46893f4-4491-4f4a-8f1a-f19a7815011a

Data standardization is all about bringing data from different places into one common, consistent format. It’s the practice of making sure every team agrees on and uses the same definitions and structures for the metrics that matter most. This simple act gets rid of ambiguity and makes your analytics trustworthy, turning a mess of information into a solid asset for making smart decisions.
Why Data Standardization Is Your Most Critical Analytics Investment

Before we jump into the technical steps, let's talk about the real-world impact of data chaos. When your data isn't standardized, every department is essentially speaking a different language.
Marketing's definition of an "active user" might not match the product team's definition. This leads to conflicting reports and those painful meetings spent debating whose numbers are "right." This isn't just a small annoyance; it's a serious roadblock to progress.
Inconsistent data can tank your product roadmaps, mess up financial forecasts, and waste countless engineering hours on tedious, manual data cleanup. It kills trust and forces teams to fall back on gut feelings instead of solid evidence. Data standardization is the cure for this confusion.
Building A Foundation of Trust
The ultimate goal here is to establish a single source of truth. This is a centralized, agreed-upon set of data that everyone in the company can rely on. When metrics like 'Monthly Recurring Revenue' (MRR) or 'Customer Acquisition Cost' (CAC) mean the same thing to everyone, you’re all reading from the same sheet of music.
This alignment brings some immediate wins:
It demolishes data silos. Standardization breaks down the invisible walls between departments, ensuring sales, marketing, and product are all analyzing the same core information.
It builds cross-functional confidence. When dashboards match up across the company, meetings can finally shift from arguing about data to making strategic moves.
It creates a scalable foundation. As you grow, a standardized data model can expand without falling apart, ready to handle more complex analytics down the road.
By establishing clear, documented standards, you're not just cleaning up spreadsheets. You're building an operational backbone that allows for confident, data-driven growth.
The Real-World Cost of Inconsistency
Picture a SaaS company where the sales team tracks customer sign-ups in their CRM, but the product team tracks them in a backend database. Without a standard definition, a simple question like, "How many new customers did we get last month?" is nearly impossible to answer with certainty.
Sales might count anyone who starts a trial as a "new customer," while product only counts users who complete the entire onboarding flow. That single discrepancy can lead to misallocated marketing dollars and a warped view of the company’s actual momentum.
Implementing a standardized definition for "new customer" gets both teams on the same page and working together. This sort of clarity is essential for managing your data layer. For a closer look at this, check out our guide on why active metadata matters for BI.
At the end of the day, data standardization isn't just a technical task for data engineers. It's a strategic necessity for any organization that wants to move faster, make smarter calls, and give every team member the reliable insights they need. It’s the investment that powers every other analytics effort you'll ever make.
Defining Your Canonical Schemas And Metrics
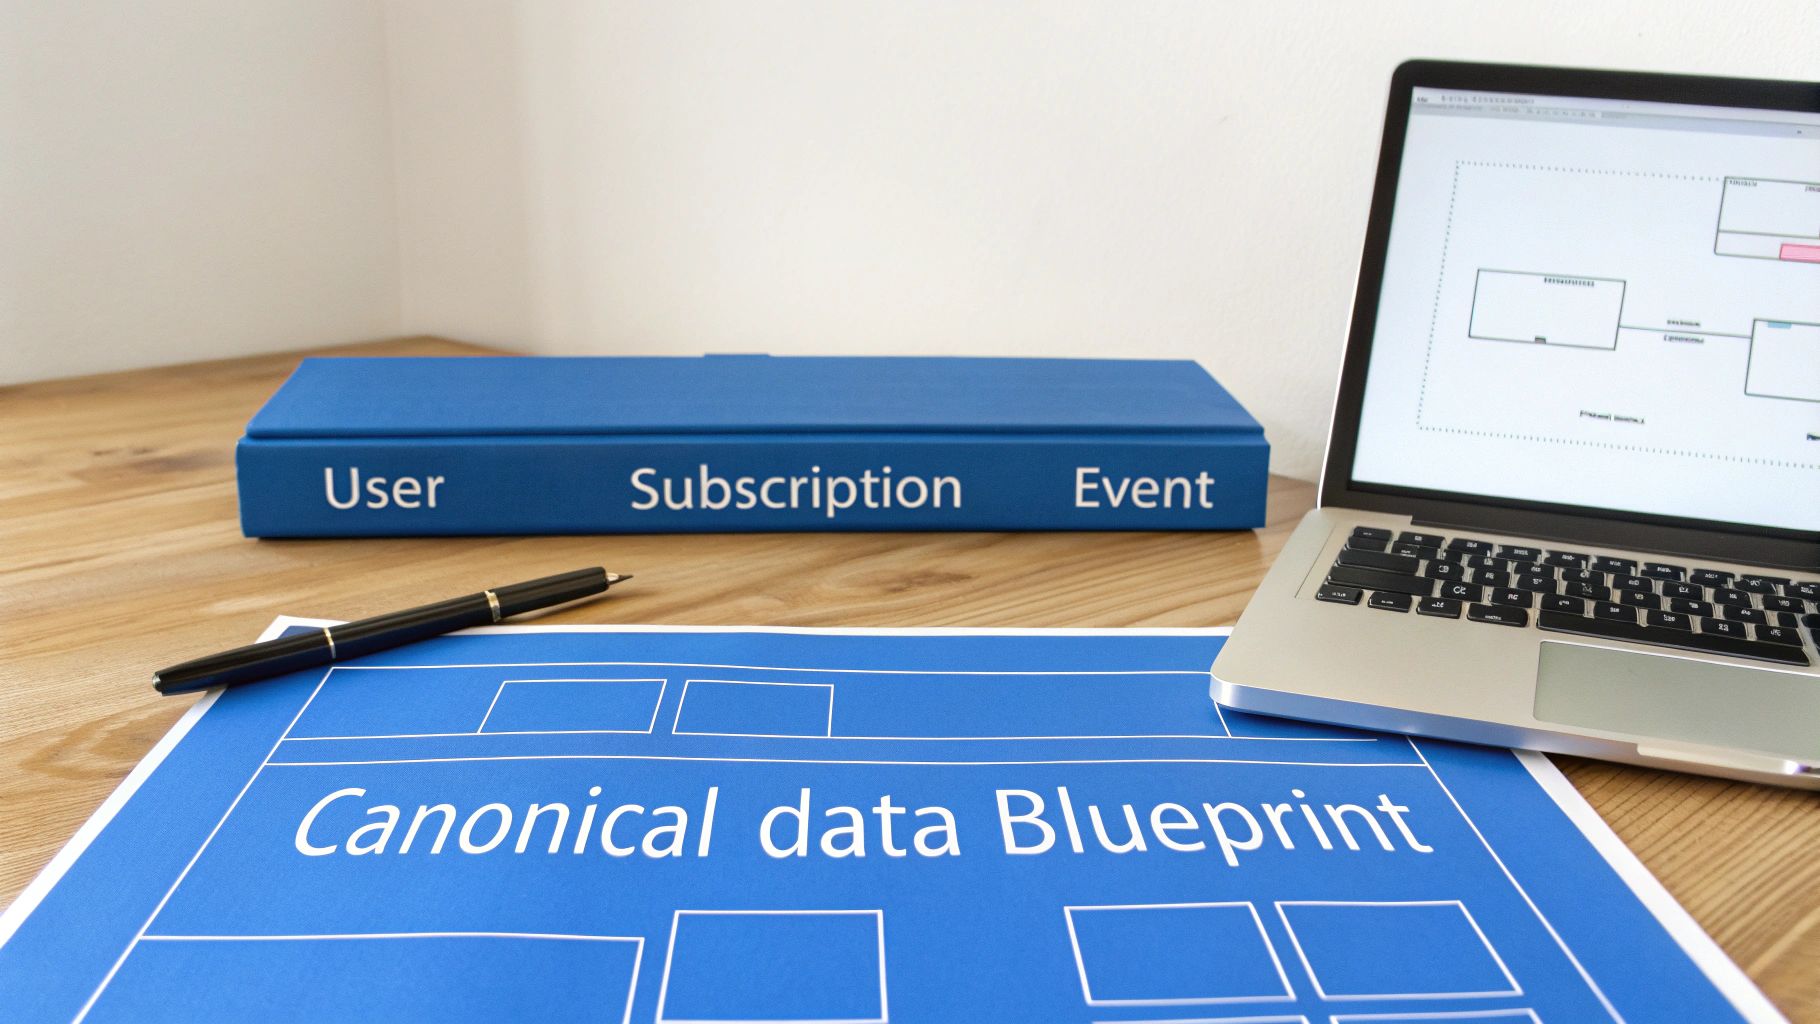
This is where you lay the foundation. Before a single line of code is written or a dashboard gets built, everyone needs to be speaking the same language. That means creating a canonical data model—a single, agreed-upon source of truth for your business's core logic and entities.
Think of it as the constitution for your data. It’s a set of rock-solid definitions that kill the ambiguity plaguing so many organizations. This is how you finally put an end to the classic "my dashboard says X, but your report says Y" problem that destroys trust and paralyzes decision-making.
This isn't some new-age concept. The drive to organize data systematically goes way back. The United States government was tackling this in 1785 with the US Land Ordinance, one of the earliest large-scale efforts to collect uniform data. As Stephen Wolfram's excellent history of our data civilization shows, the core principle remains: systematized data enables better governance and smarter decisions.
Leading Cross-Functional Definition Workshops
So, where do you start? You get the right people in a room. You simply cannot define what your business truly measures from an ivory tower. To get this right, you need a collaborative effort between the teams that create the data and the ones who rely on it every day.
The goal is to facilitate a workshop—get leaders from Product, Marketing, Sales, and Finance together to hammer out the definitions for your most critical metrics. And please, don't try to boil the ocean. Start with a handful of the most important, high-impact concepts.
Here are a few common offenders that almost always need immediate clarification:
Active User: Does logging in count? Or do they need to perform a specific action? Are we talking daily, weekly, or monthly?
Monthly Recurring Revenue (MRR): How do we handle discounts and credits? What about prorated subscriptions or usage-based billing components?
Customer Lifetime Value (LTV): What’s the exact formula? What time horizon are we using? Do we calculate it differently for various customer segments?
This isn't just an exercise in writing things down. The real magic is in the conversation. Your job is to uncover all the hidden assumptions each department has been operating under and forge a unified consensus that everyone genuinely commits to.
Documenting Your Definitions and Assigning Ownership
Once everyone's shaking hands, the real work begins. Those hard-won definitions need to be documented in a central, easy-to-find place. This could be a tool like Notion or Confluence, or even a dedicated data catalog. Honestly, the tool you choose matters far less than whether people actually use it.
The documentation itself needs to be airtight. To help guide this process, here’s a checklist you can adapt to create your own canonical definitions for core business metrics.
Core Business Metrics Standardization Checklist
This checklist is designed to guide your team's discussion and ensure every critical aspect of a metric is defined, documented, and owned.
Metric Category | Example Metric | Definition Checklist Item | Ownership |
|---|---|---|---|
User Engagement | Activated User | - [ ] Define the specific actions a user must take. | Head of Product |
Financial | Monthly Recurring Revenue (MRR) | - [ ] Clarify inclusion/exclusion of discounts, credits, and taxes. | Head of Finance |
Customer Value | Customer Lifetime Value (LTV) | - [ ] Document the complete formula and all its inputs. | Head of Marketing / BI |
This structure removes any ambiguity and, crucially, assigns ownership. The metric owner isn't just a name in a spreadsheet; they're the go-to person for any questions and the one responsible for leading the charge if the definition needs to change down the road.
Getting this level of clarity is the first major step toward building a truly reliable data culture. In fact, it's the bedrock for what we call a governed metrics layer. If you want to dive deeper into this concept for SaaS companies, check out our guide on how to create a governed metrics layer. It ensures that as your business evolves, your data definitions can evolve with it—but in a controlled, intentional way.
At the end of the day, defining your canonical schemas is far more of a social and organizational challenge than a technical one. It's about building alignment and creating a shared reality of what truly drives your business. Nail this part, and you'll have a rock-solid foundation for everything that comes next.
Designing A Scalable Data Governance Workflow
Once you’ve nailed down your definitions, it’s time to build the machinery that will turn raw, messy data into a clean, standardized asset. This is where the technical work meets strategic oversight. We're not just running scripts here; we're building a durable, scalable system that produces data people can actually trust.
A huge decision you'll face early on is your data pipeline architecture. The two main schools of thought are ETL (Extract, Transform, Load) and ELT (Extract, Load, Transform). With ETL, you clean and shape the data before it ever touches your data warehouse. In contrast, ELT dumps the raw data into the warehouse first and then transforms it right there—a method that’s taken off thanks to powerful cloud warehouses like Snowflake and Google BigQuery.
For most modern data stacks, ELT is the way to go. It gives you much more flexibility. You get to keep a pristine, unaltered copy of your raw data, which is a lifesaver when you need to rerun transformations or hunt for new insights without having to pull everything from the source all over again.
Building Your Transformation Patterns
Whether you choose ETL or ELT, the “T” for transformation is where your canonical definitions truly come to life. This is the stage where all that hard work documenting business logic gets applied to convert raw inputs into the standardized schemas your company is counting on.
These days, tools like dbt (data build tool) have become the gold standard for managing these transformations. It lets your data team write SQL models that are modular, version-controlled, and much easier to test and document.
So, what does this look like in practice? A transformation job might:
Clean and format fields: Convert all country codes to a standard two-letter ISO format. No more "USA," "U.S.," and "United States" in the same column.
Apply business logic: Calculate
is_active_userbased on the exact rules hammered out in your workshops.Join data sources: Combine user data from your app's database with subscription data from Stripe to create a single, unified
dim_customerstable.
This code-based approach locks in consistency. Every metric gets calculated the exact same way, every single time, which is how you finally escape the chaos of spreadsheet-based analysis.
Establishing A Robust Governance Framework
Let's be real: technology alone won't keep your data clean. You need a human framework of ownership and accountability to maintain quality over the long haul. This is the heart of data governance—treating your data like the strategic asset it is.
Data governance isn't about restricting access; it's about building confidence. It ensures that when someone uses a piece of data, they can trust its source, its meaning, and its quality without hesitation.
A solid governance workflow has a few key players. First, you need to assign Data Stewards. These aren't technical folks, necessarily. They're subject matter experts from different departments who are responsible for the quality and definition of data in their domain. The Head of Marketing, for example, is the perfect steward for all marketing attribution data.
These stewards then form a Governance Council. Think of it as the legislative body for your company's data. This cross-functional group meets regularly to review requests for new metrics, sort out definition conflicts, and approve any changes to the canonical data model. It ensures your standards don't crumble as the business evolves.
Automating Data Quality And Validation
Finally, a scalable workflow has to be proactive, not reactive. You can't afford to wait for a frustrated exec to spot an error in a dashboard. That’s where automated data quality checks and testing come in.
Modern tools allow you to bake these tests directly into your transformation pipelines. Every time the data gets updated, your tests run and validate it against a set of expectations.
Here are a few practical examples of tests you can automate:
Uniqueness Test: Make sure every
order_idin your orders table is unique. Duplicates can wreck your revenue reporting.Not-Null Test: Verify that the
user_idcolumn in your events table is never empty.Referential Integrity: Check that every
product_idin the sales table actually exists in the products table.Freshness Check: Fire off an alert if the sales data hasn't been updated in the last 24 hours.
By embedding these tests into your daily workflow, you create a safety net that catches problems before they ever reach the business. This automated validation is what turns your governance policies from a document on a drive into a living, breathing reality that builds and maintains trust across the entire company.
Implementing a Phased Rollout and Migration Strategy
If there’s one piece of advice I can give, it’s this: don’t try to boil the ocean. A "big bang" approach to data standardization is a recipe for disaster. It's wildly disruptive, creates a ton of organizational pushback, and almost guarantees that you'll break something critical along the way.
A much smarter, more sustainable path is a phased rollout. The goal is to demonstrate value quickly and build momentum over time.
Instead of trying to standardize every data point at once, pick a single, high-impact business domain to start. Maybe it's your marketing attribution model, a key product engagement funnel, or the financial reporting for a specific product line. Find an area where data chaos is causing real, visible pain.
Starting small gives you a controlled sandbox. You can test your new canonical schemas, nail down the transformation logic, and iron out the governance processes without risking the entire company's data infrastructure. This first project becomes your proof of concept, a tangible win you can use to get buy-in from other teams.
Start With a Pilot and Prove Value
Let's walk through a classic example. Your marketing and sales teams are constantly clashing over lead quality. Marketing’s dashboard shows they’re generating thousands of leads, but the sales team insists none of them are converting. This is the perfect pilot project for the standardization of data.
Your first move is to standardize the definition and lifecycle of a "lead." This means getting both teams in a room to agree on the specifics.
Define your terms: What exactly is a "Marketing Qualified Lead" (MQL)? What criteria does a lead have to meet to become a "Sales Qualified Lead" (SQL)? Write it down and get everyone to sign off.
Build a unified pipeline: Create a new, standardized data pipeline that pulls lead data from your CRM and marketing automation platform, cleaning and transforming it into a single, trusted dataset.
Create one source of truth: Build one shared dashboard that both teams agree to use for all reporting on lead performance. No more competing reports.
This small project delivers a huge, immediate outcome. It stops the data arguments, allowing both teams to finally focus their energy on improving the actual lead generation and conversion process.
The secret to a successful data standardization initiative isn't technical perfection on day one. It's about delivering a quick, undeniable win that solves a real business problem and makes people’s jobs easier.
This is all about turning messy, raw data into a trusted, governed asset that the business can rely on.
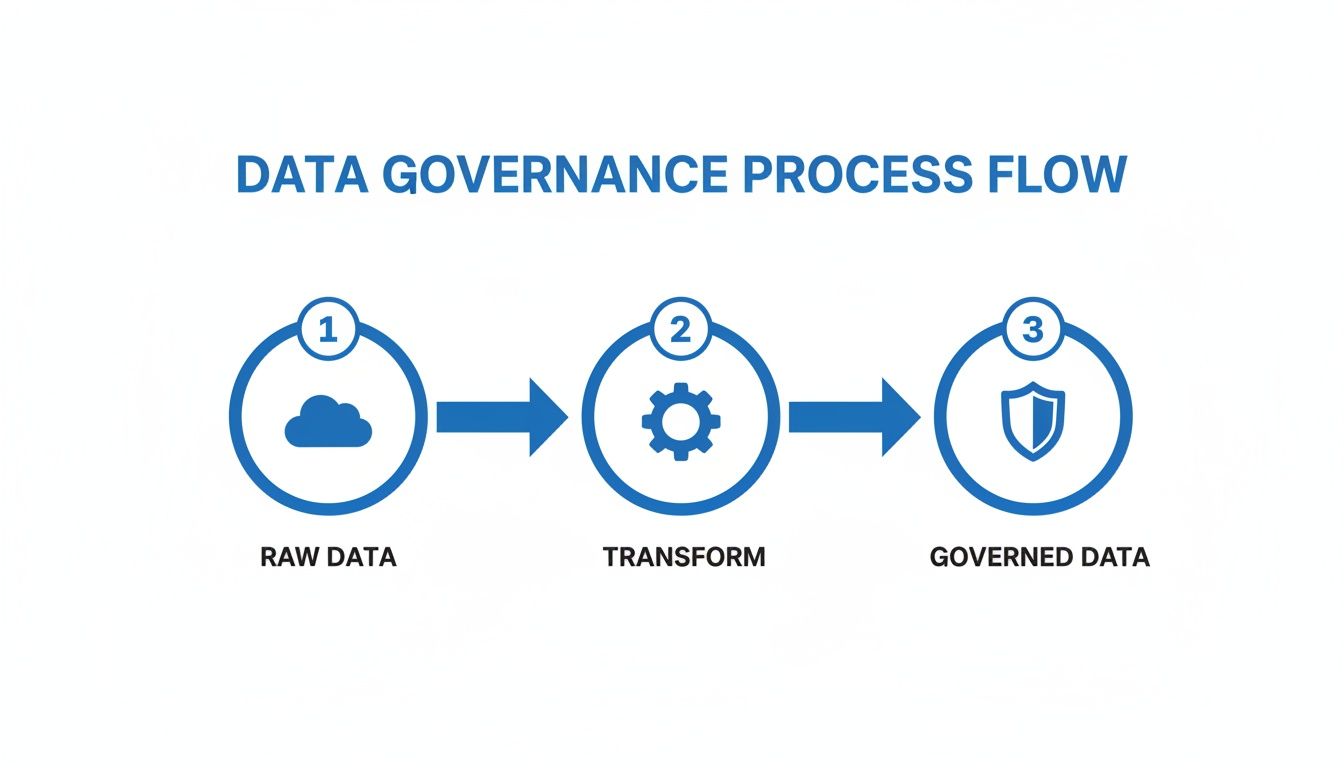
The process is always the same at a high level: take the raw inputs, apply your standardized rules and transformations, and produce a reliable output that everyone trusts.
Managing the Technical and Human Side of Migration
Once your pilot project is a clear success, it's time to plan the broader technical migration. A crucial best practice here is to run your new and old data pipelines in parallel for a while. This lets you compare the outputs side-by-side, validate that the new standardized data is accurate, and build confidence among your stakeholders before you pull the plug on the old system.
While the parallel run is happening, you can shift your focus to organizational change management. This is less about code and more about people.
Your communication plan needs to be crystal clear. Host training sessions showing teams how to find and use the new standardized datasets. Don't just show them what changed; explain why it helps them—less time wrestling with messy spreadsheets, more reliable reports, and faster answers to their most critical questions.
As teams get comfortable with the new system, you can start deprecating the old, untrustworthy reports and data sources. Handle this delicately. You can't just turn off old dashboards overnight. Announce a clear timeline, provide plenty of training on the new tools, and make sure your team is available to support users through the transition.
Most importantly, celebrate your wins publicly. When the marketing and sales teams finally resolve their lead quality debate, share that story. When the finance team closes the books two days faster because of standardized financial data, broadcast that achievement. These success stories are your most powerful tool for turning skeptics into advocates and driving this new data culture across the entire organization.
Activating Your Standardized Data With Modern Analytics Platforms

All the hard work defining, governing, and rolling out your data standards finally pays off right here—at the user-facing layer. Let's be honest: standardization is pointless if your teams can't easily access and use the clean, reliable information you’ve spent so much time producing.
The real prize is achieving true self-service analytics. When your data model is standardized, non-technical users from marketing, operations, or product can finally explore data with confidence. They no longer need to second-guess the metrics in their dashboards or file a ticket with the data team for every little question.
This completely changes the dynamic. Instead of being a bottleneck, the data team evolves into an enabler. They get to focus on overseeing the quality and architecture of the data foundation, while the rest of the business confidently builds on top of it.
Powering Self-Service Analytics With a Common Language
A well-defined, standardized data model is essentially a universal translator for your business. It provides the crucial context that modern analytics platforms need to understand your operations and deliver accurate insights. This is where AI-driven tools like Querio really start to shine.
These platforms connect directly to your standardized data warehouse and immediately understand the relationships between different business concepts because you've already defined them.
It knows exactly what a
customeris.It understands how an
orderrelates to aproduct.It recognizes the specific business logic behind a metric like
monthly_recurring_revenue.
This shared understanding is the key that unlocks genuine self-service. It allows anyone on the team to ask questions in plain English, knowing the tool has the necessary context to interpret their query correctly and pull from the single source of truth.
Think of your standardized data model as the detailed map and legend for your business. An AI agent is the expert guide who can read that map instantly to navigate you to the exact treasure you're looking for, without any wrong turns.
From Natural Language Questions to Reliable Answers
The practical impact here is massive. Picture a product manager trying to understand user engagement. In a disorganized data environment, answering a seemingly simple question could take days of back-and-forth with an analyst.
With a standardized backend, the process becomes instant. The same product manager can just ask an AI agent, "What was our user activation rate by acquisition channel last quarter?"
Because the terms activation_rate and acquisition_channel are standardized, the platform doesn't have to guess. It can generate the correct SQL query, run it against the trusted dataset, and return a visualization or a number in seconds. That kind of speed and reliability changes everything.
This is what it looks like in practice. A user can interact with an AI-powered analytics platform like Querio to get immediate, trustworthy answers from their data just by asking.
The interface lets users simply type what they need, and the platform translates that request into a concrete data insight based on the underlying standardized model.
This direct line from backend data standardization to frontend usability is what truly makes data accessible. It removes technical barriers and empowers domain experts to answer their own questions, which fosters a culture of curiosity and data-driven decisions across the entire organization.
The Historical Precedent for Analytics Platforms
This push for consistency isn't new; it’s a core principle of good analysis. The field of statistics itself went through a major standardization in the early 20th century, which was essential for its growth. A huge moment came in 1925 when statistician Ronald Fisher introduced the 5% level of significance (p-value) as a universal benchmark for validating results. This created a common yardstick that allowed researchers and organizations everywhere to compare findings with confidence. You can dig deeper into the history and impact of statistical conventions to see how these ideas evolved.
Just as statistical standards enabled a new era of scientific rigor, data standards today enable a new era of business intelligence. This consistency is vital for building a data culture that can scale and be relied upon. To learn more about the tools that make this possible, check out our guide on the modern analytics stack.
Ultimately, activating your data is about connecting the dots. The detailed backend work of defining schemas and implementing governance directly creates a faster, more intuitive, and more reliable analytics experience for everyone. It turns your data from a guarded, complex resource into an accessible, democratized asset that moves the business forward.
Common Questions About Data Standardization
Kicking off a data standardization project always stirs up a lot of questions. People want to know where to even begin, how to untangle common jargon, and what the real payoff is. Getting these things straight from the start makes the whole process smoother and helps everyone feel confident in the plan.
A common hang-up, especially for startups or smaller teams, is feeling like you don't have the resources to pull this off. But the trick is to stop thinking about it as a massive, boil-the-ocean project. Instead, aim for a series of small, strategic wins that solve real problems.
How Do We Start Data Standardization With Limited Resources?
You don't need a huge budget or a formal data governance committee to make a real impact. The best initiatives I've seen start by picking one, high-value business problem and nailing it. This is how you prove the concept and build momentum.
Think about a common pain point for a SaaS startup: the user sign-up and activation funnel. This is a classic area where Product and Marketing teams have different numbers and definitions, making it the perfect place to start.
Your first move is to get the key people from both teams in a room for a single workshop. The goal isn't to standardize the entire company's data overnight. It's to agree on and document just 3-5 core metrics that everyone can rally behind.
Signed Up User: What exact action counts as a sign-up? Is it form submission? Email verification?
Activated User: What specific event or set of events means a user is officially "activated"?
Activation Rate: What's the precise formula everyone will use to calculate this?
You can use simple tools you already have, like Google Docs or a Notion page, to create a basic data dictionary for these terms. On the technical side, the objective is to build just one clean, standardized data table in your warehouse that reflects these new, agreed-upon definitions. This "quick win" delivers immediate clarity and builds the political capital you need to tackle bigger projects down the road.
What Is The Difference Between Data Standardization And Data Normalization?
People often use these terms interchangeably, but they're two very different things with different goals. Getting this right is key for clear communication between your technical folks and the rest of the business.
Data Standardization is all about business-level consistency. The focus is on making sure the meaning and format of your data are the same everywhere. For example, it’s the process that ensures your country field always uses the two-letter ISO code (US, DE, JP) instead of the chaotic mess of "USA," "United States," and "U.S." that you find in raw data. It’s about creating a shared language so everyone agrees on what the data actually represents.
In short: standardization ensures everyone agrees that a 'customer' is a 'customer' everywhere it appears. Normalization ensures that customer's data is stored efficiently in the database without unnecessary duplication.
Data Normalization, on the other hand, is a purely technical process from the world of database design. Its main job is to organize data in a relational database to cut down on redundancy and protect data integrity. It involves breaking data down into multiple related tables so you're not repeating the same information over and over, which is critical for efficient storage and updates.
How Does Data Standardization Help With AI And Machine Learning?
For any AI or machine learning (ML) project, data standardization isn't just a nice-to-have—it's the bedrock. AI models are incredibly sensitive to the quality and consistency of the data you feed them.
Inconsistent formats, clashing definitions, or missing values will torpedo a model's performance, leading to wildly inaccurate predictions and results you simply can't trust. For example, if you're building an ML model to predict customer churn, it needs a single, unambiguous definition of what "churn" actually means. It also needs consistent features, like plan_type or usage_frequency, to be formatted the exact same way for every single user.
When you provide a high-quality, standardized dataset, you slash the time data scientists spend on manual data cleaning—a chore that can eat up a staggering 80% of their time. Even more importantly, it dramatically improves the reliability and accuracy of your AI models, turning them from a risky science experiment into a business tool you can bet on.
Ready to activate your standardized data and empower every team with self-service analytics? Querio's AI agents use your clean, consistent data model to answer natural language questions in seconds, turning your data foundation into a true competitive advantage. Explore Querio today and see how fast your teams can move when they trust their data.

