Business Intelligence
Tableau vs Querio
Choose simplicity and fast, natural-language insights for broad teams, or deep, customizable visual analytics for analyst-driven workflows.
Which BI tool is better for your team? It depends on your needs. Tableau excels in creating detailed, customizable data visualizations, making it a strong choice for organizations with skilled analysts. Querio, on the other hand, prioritizes simplicity by using AI to answer plain English queries, perfect for non-technical teams seeking quick insights.
Here’s a quick breakdown:
Tableau: Best for technical teams needing deep customization and advanced dashboards. It supports cloud, on-premises, and hybrid setups with flexible governance models. However, it has a steeper learning curve and costs scale per user.
Querio: Ideal for teams without technical expertise. It delivers instant answers via natural language queries, connects directly to data warehouses, and offers flat-rate pricing with unlimited users.
Quick Comparison:
Feature | Querio | Tableau |
|---|---|---|
Ease of Use | Plain English queries | Requires technical skills |
Customization | Limited | Highly customizable |
Pricing | Flat-rate, unlimited users | Per-user, role-based |
Deployment | Cloud-based SaaS | Cloud, on-premises, hybrid |
Best For | Non-technical teams | Technical teams with analysts |
If you need fast, self-service analytics for everyone, Querio is the way to go. For advanced visualizations and detailed reporting, Tableau is a better fit.
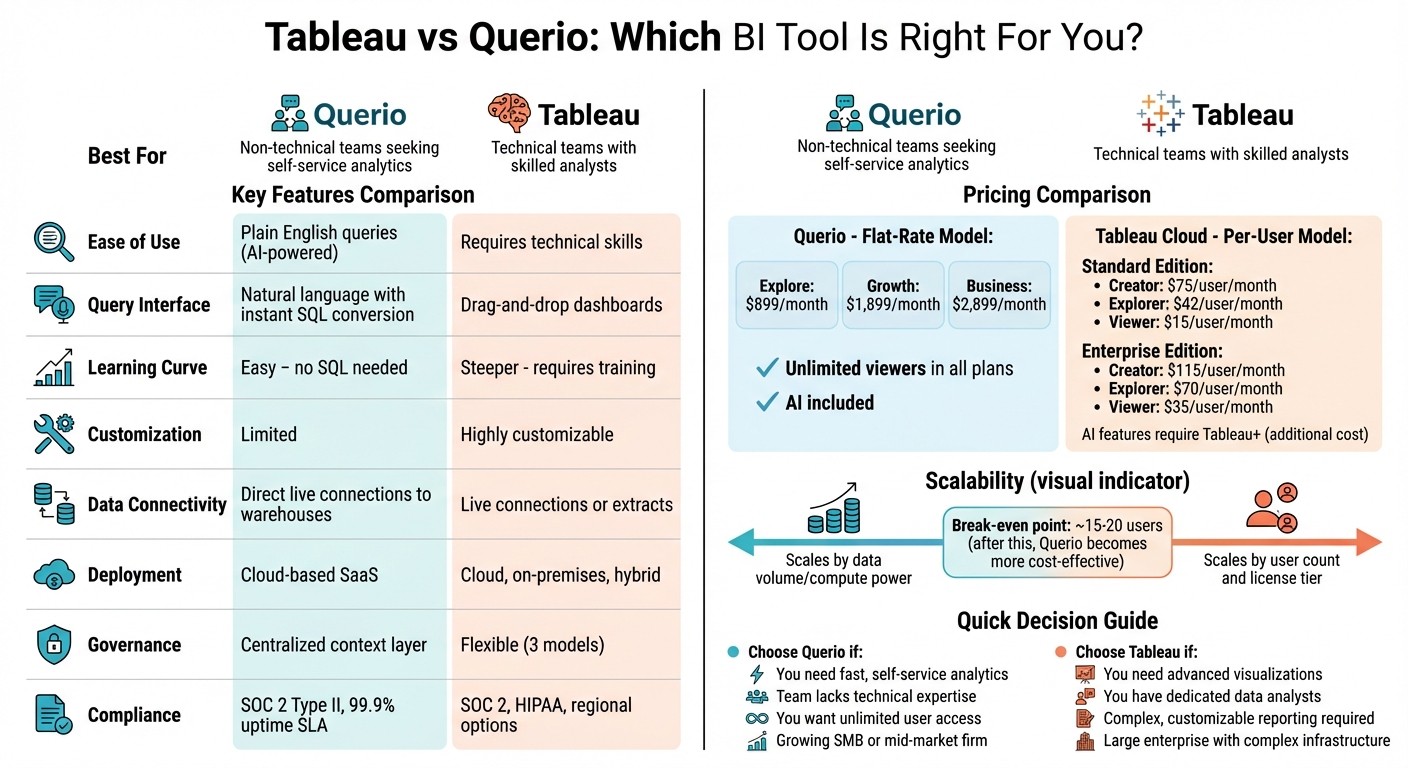
Tableau vs Querio: Complete Feature and Pricing Comparison
Platform Design and Primary Use Cases
The main difference between Tableau and Querio lies in who takes charge of the analysis. Tableau caters to data professionals who create detailed visualizations and reports for others to consume. In contrast, Querio flips the script, empowering business users to perform their own analytics through AI-driven plain English queries.
Here’s how each platform’s design aligns with its core use cases:
Tableau: Data Visualization and Reporting
Tableau is all about visual storytelling. Its drag-and-drop interface allows data analysts to build custom dashboards, charts, and reports. This makes it ideal for organizations with dedicated business intelligence (BI) teams. Analysts connect to data sources, model relationships, design visualizations, and publish dashboards for stakeholders to interact with and filter.
What sets Tableau apart is its customization and depth. It supports advanced calculations, intricate chart types, and precise formatting. Companies rely on Tableau for everything from executive dashboards to operational reports and exploratory data analysis. Whether it’s a simple bar chart or a complex geospatial visualization, Tableau delivers. However, creating these assets requires expertise in the platform, which can be a barrier for less technical users.
Querio: AI-Powered Analytics for Self-Service Teams
Querio takes a completely different approach, focusing on ease of use and speed. It allows business users to directly ask questions in plain English, which the platform translates into SQL or Python code. For example, a user could type, "What were our top-performing products last quarter?" and instantly receive accurate results - no technical knowledge required.
What makes Querio stand out is its balance of accessibility and precision. The AI doesn’t deliver opaque, black-box answers; instead, it generates real, inspectable code that data teams can review. Querio also includes a shared context layer where technical teams define business terms, metrics, and relationships once. This ensures that when someone asks about "revenue", the calculation is always consistent, based on standardized definitions. By simplifying access while maintaining accuracy, Querio is a great fit for organizations looking to broaden data access without risking inconsistent metrics and semantic layers or chaos.
These contrasting design philosophies set the stage for a deeper dive into each platform’s features and capabilities.
Features and Capabilities
Querio and Tableau take unique paths in the world of business intelligence, each catering to different priorities and user needs. Let’s dive into how their features and capabilities measure up.
Querio champions simplicity with its AI-driven approach. It allows users to ask questions in plain English - like, “What were our top-performing products last quarter?” - and instantly translates them into trusted SQL queries. This eliminates the need for technical expertise, making it a go-to tool for teams that want quick answers. Querio also connects directly to data warehouses like Snowflake, BigQuery, and Postgres, ensuring real-time insights without duplicating data.
On the other hand, Tableau is all about powerful visuals and interactivity. While it has recently added generative AI tools (like Tableau Agent) to assist with analysis, Tableau’s real strength lies in its ability to craft highly customizable, interactive dashboards. However, this flexibility often comes with added complexity, as it relies on data extracts and scheduled refreshes to keep everything up to date.
Feature Comparison Table
Here’s a side-by-side look at how these text-to-SQL query tools compare:
Feature | Querio | Tableau |
|---|---|---|
Query Interface | Natural language queries with instant SQL conversion | Drag-and-drop dashboards with generative AI tools (Tableau Agent) |
Data Connectivity | Direct live connections to data warehouses | Live connections or extracts with scheduled refreshes |
Learning Curve | Easy - no SQL skills needed | Steeper - requires familiarity with the platform |
Query Response Time | Seconds for typical business queries | Depends on query complexity |
Visualization Customization | Dynamic and auto-updating | Deeply customizable and highly interactive |
Governance Model | Centralized context layer for consistent metrics | Flexible with granular controls |
Compliance | SOC 2 Type II, 99.9% uptime SLA | SOC 2, HIPAA, and regional data storage options |
Deployment Options | Cloud-based SaaS | Cloud, on-premises, or hybrid setups |
Best Use Case | Quick, self-service analytics for non-technical users | Advanced analysis with heavy customization needs |
Querio shines when speed and accessibility are the priorities. It reduces the time it takes to construct queries from minutes to mere seconds, making it ideal for non-technical teams looking for straightforward insights. Tableau, on the other hand, is perfect for users who need deep, exploratory analysis and are willing to invest the time and expertise required to create highly tailored visualizations.
These differences naturally set the stage to explore how each platform handles user experience and learning curves.
User Experience and Learning Curve
The way a BI platform feels to use can make or break its adoption within a team. Querio and Tableau take very different approaches to user experience, catering to distinct user needs. Let’s dive into how their learning curves shape user adoption.
Tableau: Drag-and-Drop Power, But Not Without Challenges
At first glance, Tableau’s drag-and-drop interface seems straightforward. But don’t be fooled - unlocking its advanced features, like custom calculations and data blending, often requires formal training. To truly leverage Tableau’s capabilities, users need to invest time in learning the platform and practicing regularly.
Even with training, building polished dashboards can demand significant technical know-how, especially when working with complex data models or optimizing performance. Tableau’s strength lies in its depth, but that depth is best suited for data professionals and analysts who can dedicate the effort to mastering it. This creates a clear divide in user experience based on technical expertise.
Querio: Analytics Made Effortless
Querio takes a completely different route with its natural language interface, eliminating the need for SQL or technical skills. Users can ask questions like, “What were our top-performing regions last month?” and receive instant answers, no database knowledge required. This makes analytics accessible to everyone, from marketing teams to senior executives.
To ease adoption, Querio offers a 1-month free guided pilot, helping teams get comfortable with the tool. One CFO shared, "It's like having a virtual analyst on call 24/7, surfacing issues and opportunities before we even ask." [1] The result? Insights delivered in seconds rather than minutes or hours, cutting out the wait for technical teams to create reports and empowering users to act quickly.
Data Governance and Security
When analytics drive decision-making, governance and security must be front and center. Both Querio and Tableau address these needs, but they take different approaches to ensuring governance and protecting data.
Governance Models and Metrics Consistency
Querio uses its Context Layer to simplify governance. This feature allows data teams to define joins, metrics, and business terms just once. Thanks to its live, read-only connection, data stays consistent and avoids accidental changes. With this semantic and metrics layer in place, everyone in the organization works with the same definitions - eliminating discrepancies like one department interpreting "revenue" differently from another.
Tableau, on the other hand, offers three governance models to suit varying organizational needs: Centralized (managed by IT), Delegated (overseen by Site Admins or Data Stewards), and Self-Governing (a collaborative approach). To maintain consistency, Tableau uses Certified Data Sources, which are vetted by IT or data stewards, ensuring business users can trust the data they access [2]. Additionally, Tableau Catalog automatically indexes workbooks and data sources, giving users visibility into data lineage and the potential impact of changes within the data environment [4].
"Our definition of governance, of how we look at data, has altered in a way. It used to be self-service - get whatever data you want, but we can't guarantee where it came from - to now building standards and consistency around it."
Daniel Trimmer, Senior Manager of Product Facing Solutions, Abercrombie[6]
With governance ensuring consistent metrics, the focus shifts to safeguarding data integrity and privacy.
Security and Compliance
Both platforms back their governance efforts with strong security protocols. Querio is SOC 2 Type II compliant and ensures security by maintaining live, read-only connections to Snowflake, BigQuery, or Postgres. These connections are secured with encrypted credentials, removing the need for data copies and reducing security risks.
Tableau provides enterprise-level security measures, including SSL/TLS encryption for data in transit, extract encryption at rest (supported by AWS and Azure KMS), and advanced authentication methods like Active Directory and SAML. It meets key compliance standards such as SOX, SOC, and ISAE [3][4]. Tableau also incorporates the Einstein Trust Layer to deliver AI-driven insights while maintaining data privacy [5]. For example, JPMorgan Chase, operating in a highly regulated industry, manages over 30,000 licensed Tableau users while ensuring secure data connections [7].
"Allowing self-service in one of the most highly regulated spaces - having the standard platform, the right data controls and the right governance in the tool that captures metadata and provides lineage of it in Tableau - users love it because they don't have to wait for IT and IT loves it because they have happy users."
Sriram Belur, Head of Business Intelligence Delivery Center, JPMorgan Chase [6]
Pricing and Scalability
Pricing Models
The way pricing is structured can have a major impact on overall costs, especially as your team grows.
Querio offers a flat-rate model based on compute resources rather than the number of users. Plans begin at $899/month for the Explore tier, increase to $1,899/month for the Growth tier, and top out at $2,899/month for the Business tier. All plans include unlimited viewers and built-in AI Q&A capabilities [8]. Additionally, Querio provides a startup program tailored for companies that have raised less than $3 million, offering support for early-stage growth [8].
Tableau Cloud, on the other hand, uses a per-user, role-based pricing model. In the Standard Edition, licenses cost $75/user/month for Creators, $42/user/month for Explorers, and $15/user/month for Viewers. The Enterprise Edition raises these prices to $115, $70, and $35 respectively [9]. Accessing premium AI features requires the Tableau+ bundle, which adds consumption-based credits on top of the subscription fees [9]. For example, a team of 20 users (10 Creators, 5 Explorers, and 5 Viewers) would spend approximately $1,035/month on the Standard plan - excluding any additional AI-related costs.
When considering cost efficiency, the break-even point typically occurs at around 15–20 users. Teams smaller than this might find Tableau's per-user pricing more affordable. However, for larger teams or organizations aiming to provide analytics access to a broader group, Querio's unlimited-user model becomes much more economical.
This difference in pricing models doesn’t just affect upfront costs - it also shapes how each platform scales as your organization grows.
Scaling with Growing Teams
As your team expands, the scalability of each platform becomes a critical factor.
With Querio, scaling is tied to data volume and compute power. Upgrading to a higher tier increases capacity without adding per-user charges. In contrast, Tableau scales by user count and license type - every new Creator, Explorer, or Viewer adds recurring monthly costs [9].
For small to mid-sized businesses (SMBs) or mid-market firms, this distinction becomes more pronounced as the team grows. For instance, a business with 50 users working with moderate data volumes would pay $2,899/month for Querio's Business plan. The same setup on Tableau could easily exceed $5,000/month. Querio’s compute-based pricing, paired with its centralized Context Layer, ensures consistent data governance even as data volumes increase.
That said, Tableau shines in its flexibility for large enterprises with complex needs. Its infrastructure supports on-premises, hybrid cloud, and multi-region deployments, making it a strong choice for organizations requiring advanced cluster management. For example, M3 Insurance leverages Tableau to enhance client relationships through data-driven decision-making [9].
"Tableau helps increase confidence in our clients' decision making based on facts and data, further strengthening our client relationships."
Erik Vandermause, Applied Intelligence VP at M3 Insurance [9]
Feature | Querio | Tableau |
|---|---|---|
Pricing Model | Flat-rate / Tiered compute | Per-user / Role-based |
User Limits | Unlimited viewers in all plans | Paid per user (Viewer/Explorer/Creator) |
Scalability | Scales by data volume/compute | Scales by user count and license tier |
AI Costs | Included in base tiers | Requires Tableau+ or premium credits |
Best For | Growing SMBs/mid-market firms | Large enterprises with complex needs |
Choosing the Right Platform
When selecting a platform, it's not just about features or pricing - it's about matching the tool's capabilities to your team's specific skills and needs. The technical expertise of your users and the complexity of your data play a big role in determining the best fit.
For teams made up of non-technical users - think sales, marketing, HR, or operations - Querio stands out. Its natural language interface makes it easy for anyone to get quick, actionable insights without needing advanced skills. Plus, its centralized context layer ensures consistent definitions across the board, reducing confusion and keeping metrics aligned. This makes Querio a great choice for small to mid-sized businesses aiming to make data accessible to everyone.
On the other hand, Tableau shines in environments where detailed visualizations and advanced data exploration are a priority. Built with data analysts and scientists in mind, Tableau offers a wealth of customization options and powerful analytical tools. It's particularly well-suited for large organizations with dedicated data teams and complex infrastructures.
If your team is less tech-savvy and you need self-service analytics that can be up and running quickly, Querio’s user-friendly design and minimal learning curve deliver fast results. But if your organization has skilled analysts who need full control over data visualization and are willing to tackle a steeper learning curve, Tableau’s robust feature set may be worth the investment.
FAQs
How does the user experience differ between Tableau and Querio?
Querio provides a conversational, natural-language interface, letting users type questions in plain English to instantly receive answers or view dashboards. This approach makes it simple and approachable, even for those without technical expertise, requiring little to no setup or coding knowledge.
On the other hand, Tableau relies on a drag-and-drop workflow to create visualizations. While it delivers highly customizable and powerful analytics, it comes with a steeper learning curve and demands more technical know-how to build and maintain reports effectively.
Querio aims to offer a collaborative and user-friendly experience, whereas Tableau functions more like a professional-grade analytics tool, offering advanced flexibility for users with specialized skills.
How do Querio's pricing plans support scalability for growing teams?
Querio uses a flat-rate pricing model that’s tailored to help growing teams scale without complications. Pricing begins at $899 per month for the Explore plan and tops out at $2,899 per month for the Business plan. What’s more, every plan includes unlimited users, so you’ll never have to worry about additional costs as your team grows. This setup makes budgeting straightforward and eliminates the hassle of per-user fees.
For companies gearing up for rapid growth or onboarding a large number of users, Querio’s pricing structure offers a cost-efficient way to scale. While the upfront cost might be higher for smaller teams, it delivers excellent value for businesses that prioritize long-term growth.
What makes Querio a better choice for non-technical users looking for quick insights?
For users who aren't tech-savvy but need quick, easy-to-understand insights, Querio is a game-changer. Its natural-language query feature lets you type questions in plain English and get instant, clear answers - no coding skills, SQL know-how, or special training necessary.
While many tools require advanced technical knowledge or time-consuming dashboard setups, Querio focuses on simplicity and speed. It's built for quick, on-the-spot analysis, giving business users the ability to make decisions faster and with more confidence.
Related Blog Posts


