Business Intelligence
Top 8 Conversational Analytics Tools (2026 Field Guide)
Natural-language analytics only works with a clean warehouse and governed metrics—choose tools that match your stack and query visibility.

If you want plain-English answers from warehouse data, the tool choice comes down to three things: your data stack, your metric rules, and how much query visibility you need. In this guide, I compare 8 tools - Querio, ThoughtSpot, Power BI Copilot, Tableau Pulse, Sigma, Hex, Omni, and Looker with Gemini - based on warehouse support, governance, SQL visibility, workflow depth, and price.
Here’s the short version:
- Querio fits teams that want live warehouse access, inspectable SQL/Python, and Slack or Teams use without a heavy semantic setup.
- ThoughtSpot is built for search-first analysis on top of a governed warehouse.
- Power BI Copilot works best if you already live in Microsoft Fabric and Power BI.
- Tableau Pulse is more about metric digests and alerts than open-ended text-to-SQL.
- Sigma is best for spreadsheet-style analysis on live warehouse data.
- Hex is for analyst-led notebook work with SQL and Python.
- Omni leans on a semantic layer and version-controlled metrics.
- Looker with Gemini is strongest for teams already deep in BigQuery and Google Cloud.
The main takeaway is simple: natural language alone is not enough. If your definitions for terms like revenue, margin, or active users are messy, the answers will be messy too.
::: @figure 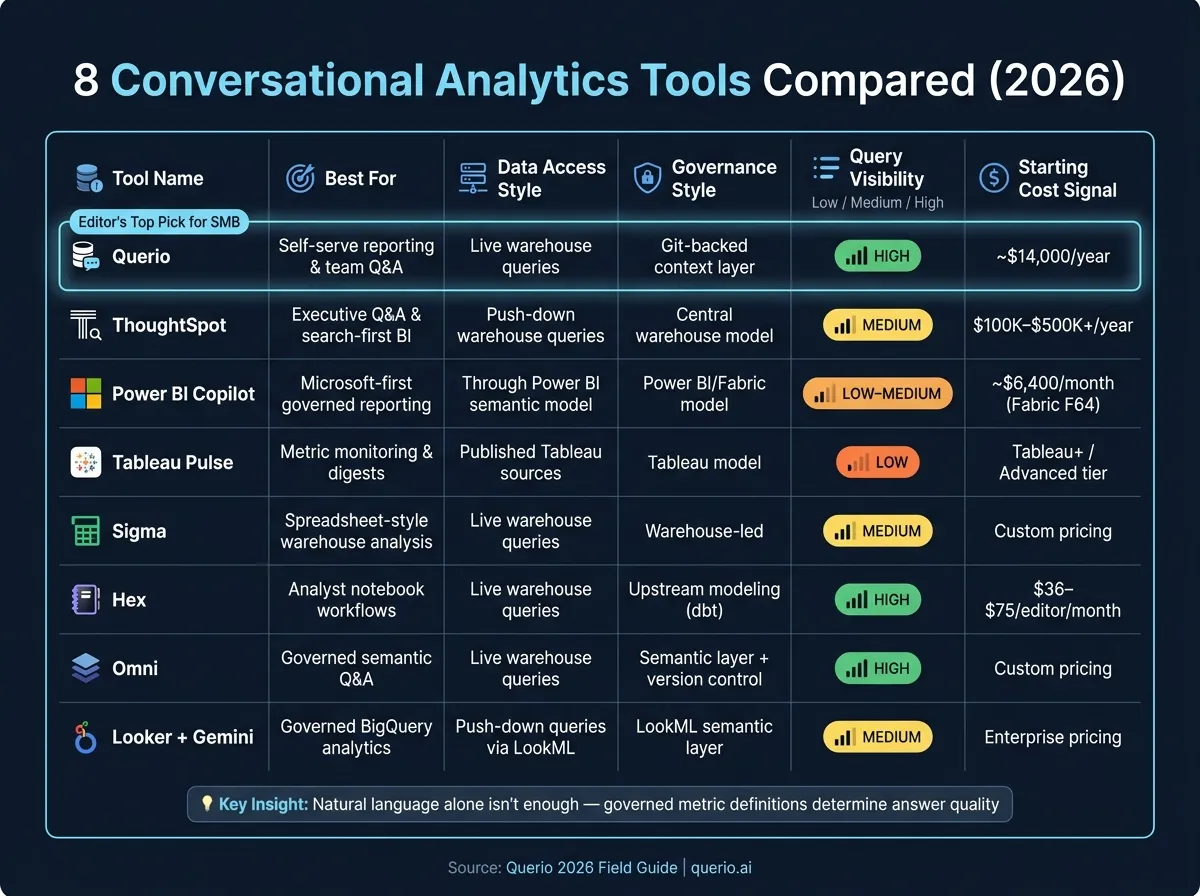 {8 Conversational Analytics Tools Compared: Features, Governance & Pricing (2026)}
:::
{8 Conversational Analytics Tools Compared: Features, Governance & Pricing (2026)}
:::
Best AI Tools for Data Analysts & BI Teams in 2026: The Complete Guide
::: @iframe https://www.youtube.com/embed/f5n7l7ZRU8c :::
Quick Comparison
| Tool | Best For | Data Access Style | Governance Style | Query Visibility | Starting Cost Signal |
|---|---|---|---|---|---|
| Querio | Self-serve reporting tools and team Q&A | Live warehouse queries | Git-backed context layer | High | About $14,000/year |
| ThoughtSpot | Executive Q&A and search-first BI | Push-down warehouse queries | Central warehouse model | Medium | Often $100,000–$500,000+/year |
| Power BI Copilot | Microsoft-first governed reporting | Through Power BI semantic model | Power BI/Fabric model | Low to medium | $6,400/month Fabric F64 + seats |
| Tableau Pulse | Metric monitoring and digests | Published Tableau sources | Tableau model | Low | Tableau+ / Advanced tier |
| Sigma | Spreadsheet-style warehouse analysis | Live warehouse queries | Warehouse-led | Medium | Custom pricing |
| Hex | Analyst notebook workflows | Live warehouse queries | Upstream modeling, often dbt | High | $36–$75/editor/month |
| Omni | Governed semantic Q&A | Live warehouse queries | Semantic layer with version control | High | Custom pricing |
| Looker with Gemini | Governed BigQuery analytics | Push-down queries via LookML | LookML semantic layer | Medium | Enterprise pricing |
If I were narrowing this list fast, I’d start with stack fit first, then check whether users can see and verify the logic behind answers, and only then look at chat features or polish.
1. Querio
Querio is built for data teams that want governed, plain-English access to live warehouse data without sending every question to an analyst. It fits B2B SaaS, healthcare, and finance companies that already run a data warehouse and want self-serve analytics without losing metric consistency or audit trails. The next three sections look at warehouse support, semantic governance, SQL trust, and automation.
Warehouse Support
Querio connects to Snowflake, BigQuery, Redshift, ClickHouse, Postgres, MySQL, SQL Server, and MongoDB using encrypted, read-only credentials. There are no CSV exports, no data extracts, and no duplication. Every query runs against live data.
That matters because it keeps people close to the source instead of working from stale copies. But there’s a catch: Querio does not come with its own ingestion or transformation layer. So if your data stack is messy, Querio won’t clean it up for you. It assumes you already have a working setup with clean, queryable tables [2].
Semantic Governance
Querio’s context layer stores joins, metrics, definitions, and trusted queries as SQL, Markdown, and Python files synced to GitHub alongside dbt. In plain terms, your business logic lives in files your team can inspect and manage, not buried inside a black box.
The agent can suggest updates based on what it learns, but a human has to approve and commit them. That step helps keep definitions steady over time while avoiding platform lock-in. Querio is SOC 2 Type II compliant and supports role-based access controls (RBAC) [7]. Dashboards can also be tagged as trusted, experimental, or team-specific. That same governance flows into the answer layer, where each response stays open for review.
NLQ and SQL Trust
Every answer comes with inspectable SQL or Python in a reactive notebook, and analysts can edit the query directly. When the SQL changes, charts update on their own. That makes it easier to check the logic instead of taking the output on faith.
If data is missing, Querio says so instead of making up a number. That’s a small detail, but it matters. During testing, it’s smart to spot-check multi-table joins, because valid SQL can still hide the wrong join logic [7]. The same notebook layer also powers Slack, Teams, and scheduled checks.
Workflow Automation
Querio works in the web app, Slack, Microsoft Teams, and Claude via MCP. When someone asks a question in Slack, Querio creates a notebook automatically, which gives you a full audit trail inside the app.
Those automations use the same notebook layer and the same audit trail, so a scheduled check is held to the same standard as a manual query. Teams can schedule health checks to monitor revenue, margin, or marketing efficiency and send root-cause findings to Slack or email when thresholds break.
2. ThoughtSpot
ThoughtSpot is an enterprise conversational analytics platform built for teams that want search-driven analysis on top of a governed warehouse model. Put simply, it’s geared toward people who want to ask questions in plain language while keeping reporting tied to a central source of truth.
The next sections look at its data-source fit, governance model, answer trust, and workflow depth.
Warehouse Support
ThoughtSpot connects natively to Snowflake, BigQuery, Databricks, Amazon Redshift, and Postgres through push-down queries, which means the data stays in your warehouse[1][3].
There’s a tradeoff, though. ThoughtSpot does not query SaaS tools directly. So if your data sits in HubSpot or Salesforce, you need to load it into a warehouse first[1][2]. That setup can be a plus for teams that already run on a warehouse-first stack, but it also adds a step if a lot of reporting starts inside business apps.
That source model matters because governance plays a big role in whether answers stay consistent.
Semantic Governance
ThoughtSpot works best when governed metrics already live in a centralized warehouse model, with definitions maintained there instead of being sorted out at query time[1].
As of mid-2026, it also integrates with Snowflake Cortex through the Model Context Protocol (MCP)[3]. That matters for teams that want warehouse-based definitions to stay in place even as people interact with data through natural language.
From there, the next issue is simple: how clear and trustworthy the generated analysis feels in day-to-day use.
NLQ and SQL Trust
ThoughtSpot’s search-first approach makes natural language the main interface, not just a feature bolted onto dashboards[1][2]. That can change how people work with data. Instead of clicking through layers of charts, they can start with a question and move straight into analysis.
In a WEX Field Service Management case, report generation dropped from 5-minute timeouts to under 3 seconds - a 30x improvement[5]. For teams working with structured warehouse data, that kind of speed can make the platform feel less like a reporting tool and more like a fast answer engine.
It’s a strong fit for teams that want quick answers without giving up governed data definitions. That same trust carries into recurring analysis and monitoring.
Workflow Automation
ThoughtSpot uses Liveboards for collaborative follow-up investigations and SpotIQ for automated anomaly detection and recurring monitoring. It also offers Slack integration, while companion tools such as SpotterViz and SpotterCode support visualization and data modeling[1][3][6].
3. Microsoft Power BI Copilot
Microsoft Power BI Copilot makes the most sense for teams that already run on Power BI and Fabric. It sits on top of the semantic model as a natural-language layer, which means its usefulness rises or falls with the quality of that model and the governance behind it. In plain terms: if your model is well built, Copilot can feel smooth and helpful. If it isn't, the cracks show fast.
That makes Power BI Copilot a strong fit for governed self-serve reporting and executive Q&A in Microsoft-first teams.
Warehouse Support
Copilot connects to Snowflake, BigQuery, Databricks, Amazon Redshift, and Azure data services through Power BI and Fabric connectors. But it doesn't query those sources directly. Instead, it works through the semantic model that sits in between[6][2].
Semantic Governance
Governance comes from the Power BI semantic model itself. That includes DAX-based row-level security and Microsoft’s sensitivity labels for data protection.
If those definitions are clean and mature, Copilot tends to stay in line with them. If they’re messy or incomplete, Copilot can’t reliably figure out the logic on its own. That’s the main limit here: Copilot reflects the model you’ve already built. The quality of that model shapes how much people trust the answers in day-to-day work.
NLQ and SQL Trust
Copilot works mainly in DAX, with only limited transparency into the queries behind the scenes. It can build report pages, pick visualizations, and write narrative summaries from prompts[1][2].
Some enterprise deployments also need Fabric F64 capacity to use the full Copilot feature set. After teams trust the output, the next issue is practical: where can people actually use it inside their daily workflow?
Workflow Automation
Copilot ties into Microsoft 365, including Teams, Excel, SharePoint, and Office. That gives teams a simple way to bring analytics into the tools they already use, whether that’s in Teams chats, Excel files, SharePoint pages, or across Office.
4. Tableau Pulse
Tableau Pulse fits best for teams that already run on Tableau. It focuses on governed metric tracking and proactive digests, not open-ended text-to-SQL analysis. So the real question is pretty simple: is your Tableau model already trusted enough to power those digests?
Warehouse Support
Pulse queries published Tableau data sources, not raw warehouse tables, so it depends on existing Tableau models [1][6]. That’s the main limitation for teams that want direct, warehouse-native analytics on Snowflake or Databricks [3]. In practice, the semantic layer matters more than the alerting layer.
Semantic Governance
Pulse inherits Tableau's row-level security and access controls, but it cannot fix weak metric definitions or incomplete modeling [1].
NLQ and SQL Trust
Pulse supports natural-language questions over published Tableau sources, but SQL visibility is limited and users cannot inspect or edit the underlying logic [1].
Workflow Automation
Pulse delivers personalized metric digests through Slack and email, which helps business users stay up to date without logging into Tableau [1]. Its Salesforce integration is a clear plus for revenue and go-to-market teams. That makes Pulse strongest for push-based monitoring, not exploratory analysis. Teams that need deeper investigation will likely want platforms that go past digest-style monitoring.
5. Sigma
While many metric-monitoring tools lean on summaries and alerts, Sigma takes a more hands-on route. It centers the experience around a workbook, not a chat box. It’s a warehouse-first analytics tool with natural-language support layered on top, so it works best for governed, self-serve analysis inside a workbook rather than as a pure conversational tool.
Warehouse Support
Sigma connects natively to Snowflake, BigQuery, Databricks, Redshift, and Postgres [1][3]. It queries live data where it already lives, with no extracts required [1][6].
Semantic Governance
Governance in Sigma comes from the warehouse model, which means clean schemas and trusted definitions do a lot of the heavy lifting [1][6]. In practice, workbook-level analysis inherits the structure already set up in the warehouse.
NLQ and SQL Trust
Sigma supports natural-language queries, but the workbook stays at the center of the experience [1][6]. Query results appear in a spreadsheet-style workbook, where analysts can keep digging with familiar cell-based logic. That makes Sigma a strong fit for teams that want inspectable, warehouse-backed analysis instead of a chat-first setup [1][3].
Workflow Automation
Sigma also supports write-back, so users can update warehouse data directly from the workbook [1]. Real-time co-editing, pinned dashboards, and embedded analytics make it easier for teams to work through questions together and refine their analysis as they go [1]. Its main strength is collaborative, warehouse-native analysis, not chat-first automation.
6. Hex
Hex is built around notebooks. That makes it a good fit for analyst-led teams that want to explore data in SQL and Python, then turn that work into interactive apps. It isn't a pure chat-first tool, but it belongs in this guide because it can turn natural-language prompts into editable SQL and Python. The main issue is simple: can that notebook-first setup stay controlled enough for repeatable analysis?
Warehouse Support
Hex connects natively to Snowflake, BigQuery, Databricks, Redshift, and Postgres, and it queries live data directly [2][6].
Semantic Governance
Hex relies on upstream modeling for governance. So if a team needs metrics to stay consistent, it will usually pair Hex with dbt or an existing BI model.
NLQ and SQL Trust
Hex's AI feature, Magic, helps analysts write SQL and Python from natural-language prompts [2][6]. In practice, it speeds up SQL and Python work inside the notebook instead of serving as a business-user Q&A tool. The trust factor comes from code that people can inspect and edit, not from generated answers by themselves.
That code-first setup also helps with sharing. Analysts aren't just drafting ideas on the fly; they're building work that others can review and reuse.
Workflow Automation
After the analysis is finished, Hex lets teams publish notebooks as interactive data apps [2][6]. So the notebook doesn't have to be the end of the road. It can become something shareable that supports follow-up investigation without starting from scratch.
Hex works best when the data team owns the analysis flow and analysts stay closely involved. That gives teams a path from analyst-led investigation to reusable sharing.
7. Omni
Omni is a good fit for teams that already trust their metric definitions and want AI to answer from that source. For warehouse-first teams, that matters a lot. It keeps analysis tied to governed definitions instead of drifting into ad hoc prompts. Put simply, Omni leans toward governed answers, not raw speed.
Warehouse Support
Omni queries live warehouse data directly. It doesn't include native SaaS connectors, so your source systems need to land in the warehouse first.
Semantic Governance
Omni uses AI that reads from the semantic layer. That means it answers questions against governed metric definitions, not whatever a prompt happens to suggest. Metrics are version-controlled, so business logic stays steady across the organization.
The tradeoff is pretty clear: setup takes time, and Omni works best when your modeling is already mature.
NLQ and SQL Trust
Omni's natural language querying tools is grounded in the semantic layer, which helps cut down on confident but wrong answers. Users can inspect the generated SQL and the results, which adds another layer of trust.
It also has a spreadsheet-like interface. That gives data-literate users a familiar place to mix SQL and spreadsheet logic when they want to go deeper.
Workflow Automation
Omni supports shared reports and scheduled deliveries as direct extensions of the semantic layer. So recurring workflows still use governed definitions instead of drifting over time.
The main gap is autonomous monitoring. If your team needs always-on alerting, you'll likely need another tool alongside it.
That leaves room for the final tool in this guide, which takes a different path to governed Q&A from a different BI foundation.
8. Looker with Gemini
Looker with Gemini is a strong match for teams already working inside Google Cloud. It pairs LookML with Gemini so people can ask plain-English questions and get answers based on governed metric definitions, not raw tables. In practice, that means answer quality depends heavily on the LookML model. If that layer is solid, trust tends to be much higher.
Warehouse Support
Looker with Gemini is built around BigQuery and GCP, with push-down queries that run in the warehouse. Teams with most of their data outside Google Cloud - in Snowflake, Redshift, or Databricks - may find the setup less smooth.[1][3]
That matters for a simple reason: Gemini can only work with what the LookML layer already defines. If the source setup is a poor match, the experience can feel clunky.
Semantic Governance
This is where Looker stands out. The LookML semantic layer makes sure metrics like "revenue" or "active users" are calculated the same way each time, and Gemini works from that governed model instead of trying to rebuild logic from raw tables.[1][3]
There is a catch. LookML needs upfront modeling. So if a team doesn't already have that layer in place, they have to build it first. But once that groundwork is done, it shapes how much confidence users can place in Gemini's follow-up answers and generated SQL.
NLQ and SQL Trust
Gemini turns natural-language questions into LookML queries, which helps keep answers consistent and cuts down on text-to-SQL mistakes. Users can ask follow-up questions like "Break that down by region" in a multi-turn flow, and Gemini can surface trend and anomaly explanations along with generated visualizations.[1]
That said, multi-turn follow-up is more limited than in tools built first and foremost for conversation. The same governed layer also supports downstream sharing and notifications, so the answers don't stop at the query window.
Workflow Automation
Looker with Gemini connects with Google Workspace - Sheets, Slides, and Chat - so users can pull governed data into tools they already use.[1] It can also auto-select visualizations and send metric digests through email or Slack.
Strengths, Tradeoffs, and Pros and Cons by Tool
The table below narrows the choice down to the factors that tend to matter most: source fit, governance, answer trust, workflow depth, and price. For 100–500-employee B2B SaaS, healthcare, and finance teams, it gives the fastest way to spot the right match.
"A tool that is right 85% of the time, with no way to know which 15% is wrong, is slower than the analyst it replaced." - Valiotti Data [3]
Accuracy comes from governed definitions, not from a better prompt.
| Tool | Pros | Cons | Best Fit |
|---|---|---|---|
| Querio | Governed self-serve without a pre-built semantic layer; Slack and Teams access; inspectable SQL and Python; context files synced to GitHub; live warehouse connections; ~$14,000/year flat [7] | Less emphasis on complex workflow automation | Business operations and small data teams on Snowflake, BigQuery, Redshift, or Postgres |
| ThoughtSpot | Strong search-first NLQ; broad warehouse support; strong embedded SDK [3][5] | Requires training; not Slack-native; slower implementation; high enterprise cost | Enterprise BI and data teams replacing a legacy BI platform |
| Power BI Copilot | Deep Microsoft 365 integration; auto-generates DAX and reports [6][2] | Requires Fabric F64 capacity ( |
Microsoft-committed enterprises on Azure and Fabric |
| Tableau Pulse | Strong for teams already standardized on Tableau | Only queries data modeled in Tableau; requires Tableau+ or Advanced tier [1] | Existing Tableau shops adding push-based metric monitoring |
| Hex | Collaborative notebooks; publishes polished data apps; $36–$75/editor/month [2] | Not designed for non-technical self-serve; analysts must manage queries [6] | Data science and BI teams doing notebook-first analysis |
| Sigma | Warehouse-native; live queries on Snowflake, BigQuery, Databricks, Redshift, and Postgres; inspectable workbook layer [1][3] | Workbook-first UX; less suited for chat-first or Slack-native workflows [1][6] | Analyst teams wanting governed, spreadsheet-style warehouse exploration |
| Omni | AI grounded in the semantic layer; version-controlled metrics; inspectable SQL [1] | Setup requires mature modeling upfront; limited autonomous monitoring | Warehouse-first teams with established metric definitions |
| Looker with Gemini | LookML keeps metric definitions consistent; strong BigQuery and GCP fit [1][3] | High LookML setup effort; tightly coupled to GCP; enterprise pricing can be prohibitive [3][4] | Centralized data teams on Google Cloud running governed BigQuery analytics |
Pricing can swing a lot between tools. Some come with flat annual plans, while others land as large enterprise contracts. Power BI Copilot's Fabric capacity alone costs about $6,400 per month before user licenses, and ThoughtSpot deployments can land in the $100,000–$500,000+ per year range. Querio, by contrast, uses a flat rate of about $14,000 per year, which makes budgeting much easier for smaller data teams. That gap is big enough that teams should narrow the list by evaluating text-to-SQL models for source fit and semantic governance first, then look at cost.
You can also split these tools by how teams like to work. Notebook-first or semantic-layer-first products like Hex and Looker tend to fit data and BI teams that want to inspect and control the logic underneath [6][2]. Slack-native or search-first products like Querio and ThoughtSpot fit business operations teams that want answers without writing SQL [6][2]. In plain English, team fit matters just as much as the feature list.
Final Recommendations
The comparison above cuts the list down. This part turns it into a practical shortlist.
Start with the warehouse you already have. Then pick the tool that fits your governance setup and the way your team works day to day.
If your team is tied closely to a given stack, start here:
- Looker with Gemini for BigQuery
- Power BI Copilot for Microsoft-first setups
- Tableau Pulse for teams already working from Tableau models
If your team is driven more by analysts and hands-on data work, these are the better starting points:
- Hex for notebook-based analysis
- Sigma for spreadsheet-style work
- ThoughtSpot for executive Q&A
Use the table below to line up your stack, governance level, and main use case.
| Tool | Primary Use Case | Ideal Company Profile | Main Caution Before Purchase |
|---|---|---|---|
| Querio | Self-serve reporting + departmental Q&A | 100–500-employee B2B SaaS, healthcare, or finance team on a live warehouse | Approximately $14,000/year is a meaningful commitment for very early-stage teams [3] |
| ThoughtSpot | Executive Q&A | Large enterprise teams with executive Q&A needs | Enterprise deployments can take 3 to 6 months and often cost $100,000 to $500,000+ annually [1][6] |
| Power BI Copilot | Governed metrics access | Microsoft Fabric and Power BI teams | Full Copilot access requires Fabric capacity at F64 or higher, about $6,400 per month before seat licenses, and accuracy depends on the pre-existing semantic model [3][6] |
| Tableau Pulse | Automated monitoring | Existing Tableau shops | It only queries data that is already modeled in Tableau [1] |
| Sigma | Self-serve reporting | Spreadsheet-heavy warehouse teams | Natural language is secondary to its spreadsheet-centric, warehouse-focused paradigm [1][6] |
| Hex | Departmental analysis | Analyst-heavy teams using notebooks | It is not intended for non-technical business users asking ad hoc questions in Slack [6][2] |
| Looker with Gemini | Governed metrics access | Teams already deep in Google Cloud and BigQuery | Heavy LookML modeling is required, and the product is tightly coupled to the Google Cloud/BigQuery ecosystem [1][3] |
For the target ICP in this guide, Querio should be the first product you evaluate when the warehouse is already in place but the semantic layer is still maturing. For teams with 100 to 500 employees and no mature semantic layer yet, Querio stands out as the strongest first option.
FAQs
::: faq
How do I choose the right tool for my data stack?
Choose based on your team size, stack maturity, and workflow.
Start with where your data lives. If it sits in Snowflake or Databricks, native options often give you the best governance and the smoothest integration.
If your team already uses tools like Fivetran, dbt, and a warehouse, focus on how well each option fits your communication channels and whether it supports a governed, warehouse-native semantic layer.
Then put each tool to a simple test: use your own business questions. That’s usually where the gaps show up.
And don’t look only at per-seat pricing. Also weigh:
- setup time
- maintenance work
- semantic-layer effort
That’s often where the actual cost shows up day to day. :::
::: faq
Why does the semantic layer matter so much?
The semantic layer matters because it gives AI a single source of truth for business metrics and logic.
Without it, the same question can lead to different answers. Why? Because teams end up re-creating metrics in different ways, and those small differences add up fast.
When terms like "active user" or "revenue" are defined in one central place, every natural-language query runs on the same business logic. That means the results are more consistent, easier to trust, and simpler to audit. :::
::: faq
How can I verify that an AI-generated answer is correct?
Use tools that show the generated SQL so your team can inspect the logic, joins, and source tables. If you can't see that layer, an answer may sound right and still be dead wrong.
For a reliable check, keep it simple:
- Create a golden set of known business questions
- Test candidate tools for accuracy
- Confirm governed metric definitions
- Compare the SQL and results with existing dashboards or reports
- Verify read-only access, row-level security, and query logs
That kind of review helps your team spot bad joins, metric mismatches, or table issues before they turn into bad decisions. :::