Row Level Security Tableau: A Practical Guide to Tableau Security
Discover row level security tableau techniques in Tableau: user filters, security tables, and best practices to keep data safe.
https://www.youtube.com/watch?v=61fUUciDnks
published
Outrank AI
row level security tableau, tableau security, user filters tableau, data governance, tableau rls
3a8e5128-2638-484d-b36a-601bbb98bd90

Row-level security in Tableau is all about making sure people only see the data they're supposed to. Think of it as a smart filter that automatically restricts the rows in your data source based on who is logged in and viewing the dashboard. It’s the foundational feature that lets you build one master dashboard and share it with everyone, from the CEO to a regional sales rep, with each person seeing only their slice of the pie. For instance, a manager for the West Coast sees only West Coast sales, not the company's entire sales figures.
Why Row-Level Security in Tableau Is Essential

Putting row-level security in Tableau into practice isn't just a technical nice-to-have; it's the bedrock of any scalable, modern data strategy. Every organization struggles with the same fundamental challenge: how do you give people the data they need without accidentally exposing sensitive information? You want to encourage self-service analytics, but you can't have everyone seeing everything. This is precisely the problem RLS solves, and it does it elegantly.
Instead of getting stuck building and maintaining dozens of nearly identical dashboards for every user group, you build just one. The security model you define handles all the filtering behind the scenes. This shift in approach pays off immediately.
Drastically Reduces Maintenance: Trust me, managing one dashboard is infinitely easier than juggling 10, 20, or even 50 different versions. Any update, bug fix, or design tweak happens in one place, one time.
Ensures Data Consistency: When everyone is looking at the same dashboard—the same "single source of truth"—you eliminate those frustrating arguments that start with "my report shows a different number."
Strengthens Data Governance: RLS creates a clear, enforceable, and auditable record of who is permitted to see what data. This is non-negotiable for complying with regulations like GDPR or CCPA.
The Business Case for Secure, Scalable Analytics
Beyond making your life as a developer easier, a solid RLS strategy builds trust across the business. When stakeholders feel confident they are only seeing data relevant to their role, they are far more likely to embrace the insights and use them to make critical decisions. This is especially true when you start sharing analytics with external partners or clients in multi-tenant environments.
A well-implemented RLS framework transforms security from a barrier into an enabler. It allows you to confidently scale your analytics initiatives, knowing that the right data is getting to the right people, and no one else.
Understanding this is key, especially when you consider how a thorough information technology security audit will scrutinize your data security controls. RLS is exactly the kind of robust control auditors look for. The numbers back this up: a 2023 State of Data report found organizations with advanced RLS completed security audits 40% faster and saw 25% fewer data breach incidents than those using clunky, legacy filtering methods. This powerful impact is why Tableau Server deployments using RLS have grown 35% year-over-year.
A Foundation for Data Culture
At the end of the day, RLS is about more than just locking things down. It’s about building a healthy data culture. When access is properly controlled and reliable, you can confidently democratize data access far more broadly. This frees up your central data team from being a bottleneck for every small request and truly empowers users to find their own answers. It’s a huge step toward building a self-sufficient analytics environment.
If you're looking to go deeper on this, take a look at our guide on the best practices for role-based security in BI platforms.
Choosing the Right RLS Implementation Method in Tableau
Picking your strategy for row-level security in Tableau is a foundational decision that will stick with you for the long haul, impacting everything from scalability to daily maintenance. There’s no magic bullet or single "best" way to do it. The right choice really comes down to the scale of your project, how comfortable your team is with the tech, and what your company’s governance rules look like. If you get this wrong from the start, you could be setting yourself up for major performance headaches or a security model that’s impossible to manage down the road.
So, let's walk through the three main ways you can tackle this, looking at the real-world trade-offs of each to help you land on the best fit.
The Manual User Filter: Quick and Dirty
The most straightforward way to get RLS up and running is by creating a manual user filter. This involves writing a calculated field that hardcodes a user's name against the data they're allowed to see. It’s a simple, direct check.
For instance, you might write a calculation like this: USERNAME() = 'jdoe' AND [Region] = 'West' OR USERNAME() = 'sallysmith' AND [Region] = 'East'
This method is incredibly fast to implement for a quick prototype or a dashboard meant for a tiny, fixed group of people. But that simplicity is also its biggest flaw. Any time you need to add a new user or change someone's access, you have to crack open the workbook, edit the calculation by hand, and republish. It's a recipe for typos and simply doesn't scale.
This approach is really only good for proof-of-concept projects or dashboards with fewer than five users where access rules almost never change. Think of it like a bike lock—it provides basic security, but you wouldn’t trust it to guard a bank vault.
The Security Table: The Gold Standard for Most Teams
The most popular and balanced approach by far is using a dedicated security table. You might hear this called an entitlement or mapping table. It's just a simple table in your database that maps users to the specific data they can see. At a minimum, it needs two columns: one for the user's ID (like their username or email) and another for the data value they have rights to (like a specific region, store ID, or customer account).
Once you have that table, you join it to your main data table in Tableau. Then, you apply a single, beautifully simple data source filter with a calculated field:
USERNAME() = [Username]
This little formula is pure elegance. When someone logs into Tableau, it automatically filters the entire data source down to only the rows where the [Username] column from your security table matches their login. That’s it.
The real win here is scalability and ease of maintenance. Need to grant or revoke access? Just add or remove a row in that security table in your database. You never have to edit or republish the Tableau workbook itself. This clean separation of the security rules from the actual dashboard is a game-changer.
Virtual Connections and Data Policies: The Enterprise-Grade Solution
For large companies with serious governance needs, Tableau offers a more centralized and powerful option: virtual connections and data policies. Think of a virtual connection as a shared, centrally managed gateway to your data that you set up on Tableau Server or Tableau Cloud. Within that connection, you can embed data policies that enforce RLS for you.
This method brings some serious advantages to the table:
Centralized Governance: You define the security rules just once at the connection level. Any workbook or data source that uses it automatically inherits those rules. No exceptions.
Performance Boost: The filtering happens directly in the database before data even gets to Tableau. This can dramatically speed things up, especially with large datasets.
Clear Audit Trail: It creates a single source of truth for who can access what, making security audits and compliance checks much simpler.
This is the top-tier solution for enterprise deployments, especially in regulated fields like finance or healthcare. For SaaS companies building customer-facing dashboards, understanding these different tiers is absolutely critical. You can learn more about how this applies in our guide to RLS for multi-tenant SaaS analytics.
Digging deeper into how concepts like granular access controls for big data and "Zero Trust" are implemented in production environments can provide even more context for enterprise-level security.
Comparing Tableau RLS Implementation Methods
So, how do you make the final call? It's all about finding that sweet spot between simplicity, scalability, and control. This table breaks down the three approaches to help you see which one aligns with your needs.
Method | Best For | Scalability | Maintenance Effort | Performance Impact |
|---|---|---|---|---|
Manual User Filter | Quick prototypes, tiny teams (2-5 users) | Very Low | High (manual updates) | Can be poor as logic grows |
Security Table | Most common business use cases, growing teams | High | Low (database updates) | Good (database-side filtering) |
Virtual Connection | Enterprise scale, regulated industries, embedded analytics | Very High | Centralized (low per-workbook) | Excellent (pre-query filtering) |
For almost any serious or growing analytics project, the security table method hits the perfect balance. It gives you the robust scalability and low-maintenance overhead you need for most business scenarios, without the heavy initial setup required for enterprise-level virtual connections. It's the practical choice you won't regret.
Implementing Dynamic RLS with a Security Table
While manual filters are fine for a quick test and enterprise policies offer top-down control, the most practical and widely-used method for row-level security in Tableau is a dynamic approach built around a dedicated security table. This strategy hits the sweet spot between scalability, performance, and maintainability, making it the go-to for most real-world BI deployments.
Let's get our hands dirty and build one. The core concept is surprisingly simple: instead of embedding user permissions directly into your Tableau workbook, you'll manage them in a separate table in your database. This table becomes the single source of truth for who can see what.
Designing Your Security Table
First things first, you need to create this security or "entitlement" table. It doesn't have to be complicated. At a minimum, it just needs two key columns to map users to the slices of data they're allowed to see.
A User Identifier Column: This holds your users' usernames or emails. The crucial part is that these values must perfectly match the username Tableau sees when someone logs in (e.g., 'jdoe' or 'jdoe@company.com').
A Data Permission Column: This column contains the actual values from your data that drive the filtering. If you're securing a sales dashboard by region, this column would have entries like 'North', 'South', 'East', or 'West'.
Let's imagine you're building a dashboard for a national sales team. You need to make sure each regional manager only sees their own region's numbers. Your security table might look something like this:
Manager_Username | Assigned_Region |
|---|---|
amartinez | West |
bchen | North |
sjones | West |
krishnan | South |
bchen | East |
You probably noticed that bchen shows up twice. That's exactly how you grant a single person access to multiple data segments—in this case, both the North and East regions. This is far more flexible than trying to write a convoluted IF-THEN statement in a calculated field.
Connecting the Data in Tableau
With your security table living in your database, it's time to connect it to your main dataset in Tableau. Just open your Tableau data source pane and bring in both your primary data table (let's call it Sales_Data) and your new Security_Table.
The key is creating the right relationship. You'll simply drag a noodle from the permission column in your Sales_Data table (like [Region]) over to the matching column in your Security_Table (like [Assigned_Region]). Tableau will create a relationship, likely a many-to-many, which is exactly what we need. This tells Tableau how the rows in your sales data correspond to the permissions you've just defined.
This diagram shows the typical progression of RLS methods, from simple manual filtering to the dynamic model we're building, and on to more complex enterprise solutions.
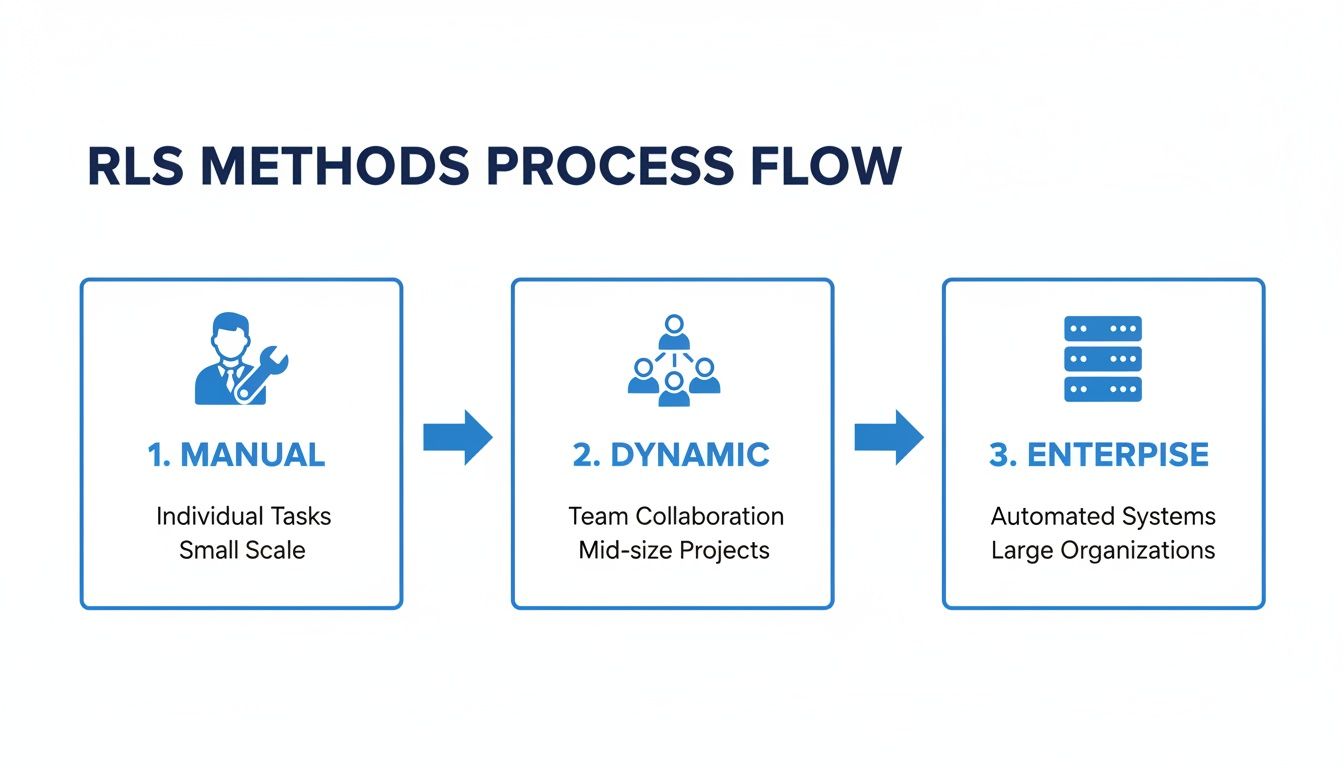
As you can see, the dynamic method provides a scalable middle ground that's perfect for growing teams and changing access requirements.
Creating the Dynamic Filter Calculation
Now for the magic. It all comes down to a single, simple calculated field that compares the logged-in user to your security table.
Go ahead and create a new calculated field. You can name it something obvious like "User Filter." Here's the formula:
USERNAME() = [Manager_Username]
That's it. This Boolean calculation returns TRUE if the person currently viewing the dashboard is listed in the [Manager_Username] column, and FALSE if they aren't. The USERNAME() function is a workhorse in Tableau; it dynamically grabs the username of whoever is logged in.
A word of caution: Always confirm whether
USERNAME()(which returns something like 'bchen') orUSERPRINCIPALNAME()(which returns 'bchen@company.com') is what you need. This depends entirely on how your Tableau Server or Cloud is configured for authentication. Getting this wrong is the #1 reason RLS works in Desktop but fails after you publish.
Applying the Filter to the Data Source
This final step is the most important one. You need to apply this calculation as a data source filter. This ensures the security logic is enforced everywhere this data source is used, giving you a completely locked-down and consistent experience across all your dashboards.
Head back to the "Data Source" tab. In the top-right corner, find the "Filters" section and click "Add." From the dialog box, choose the "User Filter" calculated field you just made.
In the next window, set the filter to only include values where the calculation is TRUE. This effectively tells Tableau to discard every row of data that the user isn't supposed to see.
Once you click "OK," the data source is officially secured. The next time manager Ana Martinez ('amartinez') logs in, the USERNAME() function will return 'amartinez', the calculation will find her in the security table, and she will only see data where the Region is 'West'. For platforms where security is paramount, like Querio, this type of granular control is a core feature; you can read more about how Querio delivers answers without exposing sensitive rows if you're curious.
This dynamic filtering happens behind the scenes for every single user, giving you a truly secure, scalable, and low-maintenance solution for your row-level security in Tableau.
How to Optimize RLS for Performance and Scale

Implementing row-level security is one thing, but making it work for a large audience is where the real challenge begins. A poorly designed RLS model can take a snappy dashboard and bring it to a grinding halt, frustrating your users and killing trust in your analytics. When you're dealing with thousands of users and millions of rows, performance isn't just a nice-to-have; it's an absolute necessity.
The most common trap I see teams fall into is applying security filters at the workbook level. It feels simple at first, but it forces Tableau to pull a massive, unfiltered dataset and then try to sort out the permissions locally. This approach is incredibly inefficient and just won't scale.
The golden rule of performant RLS is to filter the data as early as possible. The best place to do this is at the data source level, pushing the security logic down to your database where it can do the heavy lifting far more effectively.
Just making this one change—from a workbook filter to a data source filter—can deliver huge performance gains. It ensures that only the data a user is allowed to see ever travels from your database to Tableau Server or Cloud, dramatically cutting down load times and network traffic.
Optimize Your Data Model and Joins
The performance of your RLS is directly tied to the efficiency of the underlying query Tableau generates. If your security logic needs complex, multi-table joins just to figure out who someone is, your dashboards are going to feel slow.
Keep your security table lean and mean. Ideally, it should contain just two things: the user identifier and the permission key. Resist the temptation to add extra descriptive columns or other attributes to this table. They just complicate the join and slow everything down.
Also, make sure the columns you use to join your security table to your fact tables are indexed in your database. An index is like a phone book for your data; it lets the database find the rows it needs almost instantly instead of scanning the entire table. A missing index on a join key is a classic performance killer.
Leverage Extracts for Maximum Speed
Live connections are great for real-time data, but they put the entire query load on your database every single time a user clicks something. For most RLS scenarios where the data doesn't need to be up-to-the-second fresh, Tableau Extracts are your best friend.
An extract is a pre-calculated, compressed snapshot of your data. When you create an extract with a data source filter already applied, the security logic gets baked right in. This gives you several major performance benefits:
Pre-computation: The initial filtering happens just once when the extract is created or refreshed, not every time a user opens the dashboard.
Optimized Queries: Tableau’s Hyper engine, which powers extracts, is built specifically for fast analytical queries.
Reduced Database Load: All user interactions hit the speedy extract on Tableau Server, leaving your production database alone.
Historical data really highlights the impact of these choices. I’ve seen older dynamic filter methods increase query times by 200-300% on large datasets. Shifting to a security group approach often improved performance by 40-60%, and newer functions have pushed this even further, as you can see in recent benchmarks on Tableau RLS implementation.
Embrace Virtual Connections for Enterprise Scale
For bigger organizations managing security across hundreds of data sources, Virtual Connections are a game-changer. This feature lets you centralize your data connection and all the RLS logic on Tableau Server or Cloud.
Instead of configuring RLS in every single data source, you create one virtual connection with a data policy baked in. Any workbook that connects through it automatically inherits all the security rules. This not only standardizes your governance but also improves performance by centralizing and optimizing how queries are run.
Understanding how a platform’s permission model works at this level is crucial for success. If you're interested, we did a deep dive on this topic in our article about Querio's permission model for safe NL2SQL at scale. By combining these strategies, you can build a row-level security model in Tableau that is not only secure but also scales gracefully with your organization.
Navigating Advanced RLS Scenarios
Once you get the hang of the basics, you'll start bumping into the kind of tricky, real-world problems that separate a good RLS setup from a great one. What do you do when one person is on multiple teams? Or when a manager needs to see their own data plus the data of everyone they manage? These are the situations where a simple one-to-one user mapping just won't cut it.
Let's walk through a classic example: hierarchical security. Picture a typical sales organization. You have a Country Manager who needs to see everything for their entire country, but the Regional Managers under them should only see data for their specific regions.
This is where your security table design really matters. You'll need to build a table that explicitly maps out the company's organizational chart. This table might have columns like UserID, EmployeeName, and ManagerID. By joining this hierarchy table back to itself, you can build a recursive relationship that traces any employee all the way up to the top of their management chain.
Tackling Multi-Tenant Embedded Analytics
For SaaS product teams, one of the most compelling use cases for RLS is building multi-tenant embedded analytics. The idea is to create a single, master set of dashboards and embed them right into your application. Each of your customers—or tenants—logs in and sees only their own data. The security here has to be airtight.
To pull this off, your security table must connect Tableau users to a unique TenantID or CustomerID. The RLS calculation itself then becomes a straightforward filter:
[TenantID_From_Data] = [TenantID_From_Security_Table]
When someone from "Customer A" logs into your app, Tableau's functions identify them, find their TenantID from your security table, and instantly filter every single view to show only data for "Customer A." It feels completely native and secure to the end-user.
The real beauty of this approach is how well it scales. You only have to maintain one analytics project, one set of dashboards, and one security model. As you bring on new customers, you just add their details to your security table in the database—the RLS logic takes care of the rest automatically.
Verifying and Testing Your Security Rules
You can't just build RLS and hope for the best. Rigorous testing is non-negotiable, and luckily, Tableau has the perfect tool for the job: the "View as User" feature.
You'll find this little lifesaver at the bottom of the Tableau Desktop window. It lets you simulate exactly what the dashboard will look like for any user you choose. Just select someone from the dropdown, and Tableau instantly applies the RLS rules as if they were the one logging in.
Here's my go-to testing workflow:
Standard User Check: Grab a user with basic access to a single region or team. Make sure they see only their data and nothing else.
Power User Check: Now, select a manager who should have access to multiple regions. Verify they can see everything they're supposed to.
Edge Case Check: What about someone with no permissions assigned? They should see a blank dashboard. Not an error message, and definitely not all the data.
Admin Check: If you built a special "all access" rule for administrators, confirm it works as expected.
The demand for provable, auditable security has skyrocketed. After the 2021.4 update introduced data policies, RLS adoption in regulated industries like finance and healthcare shot up by 150%. Tableau 2023.1 further hardened this by tying Personal Access Token (PAT) controls to RLS. Site admins can now limit PAT creation and set expiration caps, which cut down on unauthorized data extracts by 65% in audits across more than 1,000 sites.
Finally, do yourself a favor and document everything. Keep a clear record of your security table's structure, the logic in your calculated fields, and your testing outcomes. A clean, well-documented process is the key to keeping your security model strong and auditable as your organization grows.
Common Questions About Row-Level Security in Tableau
As you get your hands dirty with row-level security in Tableau, you're bound to run into a few common hurdles. This is totally normal. Let's walk through some of the most frequent questions that pop up, so you can solve them quickly and get your security model working just right.
How Do I Give Admins Access to See All Data?
This is a classic—and essential—requirement. You absolutely need a way for your admins or power users to see everything, whether for auditing, validation, or just getting the big picture. Creating a whole separate, unsecured dashboard isn't the answer.
The cleanest way to handle this is to build a little backdoor right into your RLS calculation. You just need to add a special value, something like 'ALL', to the access column in your security table, but only for your admin users.
Then, you simply tweak your calculated field to recognize it. For instance, the logic would look something like this: [AccessColumn] = 'ALL' OR USERNAME() = [UsernameColumn]
That simple OR does the trick. If the user's access level is 'ALL', the first part of the statement is true, and the filter opens up completely for them. For everyone else, it just falls back to the standard user-based filtering.
What Is the Difference Between USERNAME() and USERPRINCIPALNAME()?
Getting this right is critical. Mixing these two functions up is probably one of the top reasons for RLS headaches, especially when moving from your desktop to the server. The one you need depends entirely on how your organization handles authentication with Tableau.
USERNAME() usually just gives you the simple Tableau username (e.g., 'jdoe').
USERPRINCIPALNAME() provides the full, formal identifier, which often includes the domain or identity provider info (e.g., 'jdoe@yourcompany.com').
As a rule of thumb, if your company uses Single Sign-On (SSO) with a service like Okta or Azure AD, USERPRINCIPALNAME() is almost always what you want. It’s the more unique and reliable identifier to match against your security table. When in doubt, test both to see which one lines up with your user list.
Can I Use RLS with a Live Database Connection?
Yes, you certainly can. RLS works perfectly with live database connections, and it's a very common setup. When you implement your RLS logic as a data source filter, Tableau just tacks on a WHERE clause to every query it sends to your database.
The thing to watch out for here is performance. The speed of your dashboards will now be directly tied to how fast your database can process those filtered queries. Because of this, it's absolutely crucial that the columns you're using for your RLS logic are properly indexed in the source database. An index can be the difference between a lightning-fast dashboard and a frustratingly slow one.
Why Does My RLS Break When I Publish to Tableau Server?
This is the big one. It’s probably the most common moment of panic for anyone implementing RLS for the first time. Everything works flawlessly in Tableau Desktop, but the second you publish it to Tableau Server or Cloud, your users see a blank screen.
Nine times out of ten, this is because of a mismatch between the username value on your desktop and the one on the server.
In Tableau Desktop, the USERNAME() function often pulls your local machine's username (like 'jane.doe'). But on Tableau Server, it returns the username you logged into the server with (like 'jdoe'). If your security table is built around the first format, the filter will find no match on the server and show no data.
To fix this, you have to make sure the user IDs in your security table are a perfect match for the IDs that Tableau Server uses. A great way to catch this before you publish is to use the "Filter as User" feature in Tableau Desktop. It lets you simulate how the view will look for a specific server user, so you can spot the mismatch early.
At Querio, our AI-powered business intelligence platform is built with security at its core. From granular permissions to row-level security and multi-tenant isolation for embedded analytics, we make it simple to deliver self-serve insights without compromising your data governance. Learn how you can get accurate answers from your data in seconds at https://www.querio.ai.

