Business Intelligence
The 9 Best AI BI Tools for 2026, Ranked
Compare nine AI BI platforms—costs, governance, and NL-to-SQL accuracy—to find the warehouse-native tool that fits your semantic layer.

If you want the short answer: Querio ranks first for mid-market U.S. teams in 2026. It stands out for live warehouse queries, governed metrics, and AI output you can check before you trust it.
Here’s the main takeaway: the best AI BI tool is not the one with the flashiest demo. It’s the one that fits your data stack, keeps metric definitions under control, and gives answers fast enough for people to use. Across these nine tools, the same pattern shows up again and again: your semantic layer matters more than the model.
If I were narrowing this list fast, I’d look at four things first:
- Data access: Does it query live data in Snowflake, BigQuery, Redshift, Databricks, or Postgres?
- Governance: Can I keep metrics, joins, and access rules under control?
- AI workflow: Does it support plain-English questions, alerts, root-cause analysis, or code-first work?
- Total cost: What do I pay after seats, capacity, setup, and modeling work?
This ranking covers Querio, ThoughtSpot, Power BI with Copilot, Tableau with Tableau Pulse, Looker, Sigma, Hex, Tellius, and Snowflake’s AI BI stack. Some are built for self-serve BI. Some fit executive reporting. Others work best for analysts or Snowflake-first teams.
One stat says a lot: Querio is listed at 95% natural-language-to-SQL accuracy, while Snowflake reports 90%+ when Cortex Analyst has a mature semantic model. That gap matters. But so does setup. A weak semantic layer can still lead to bad answers, no matter which tool you buy.
::: @figure 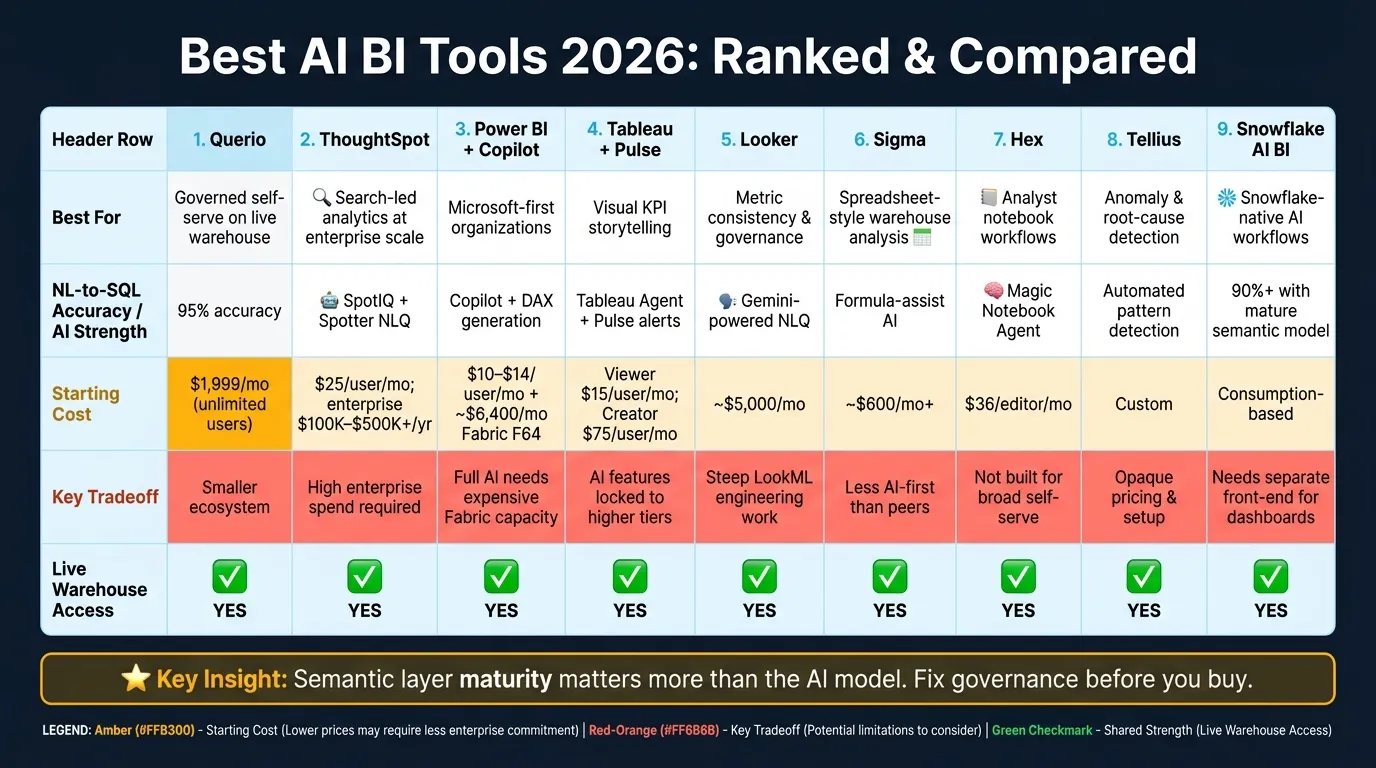 {Best AI BI Tools 2026: Side-by-Side Comparison}
:::
{Best AI BI Tools 2026: Side-by-Side Comparison}
:::
Best AI Tools for Data Analysts & BI Teams in 2026: The Complete Guide
::: @iframe https://www.youtube.com/embed/f5n7l7ZRU8c :::
Quick Comparison
| Tool | Best for | Main strength | Main tradeoff | Cost signal |
|---|---|---|---|---|
| Querio | Governed self-serve on live warehouse data | Inspectable AI with Git/dbt-linked context | Smaller ecosystem | $1,999/month |
| ThoughtSpot | Search-led analytics | Search-first BI with SpotIQ | High enterprise spend | $25/user/month+; enterprise often $100,000–$500,000+/year |
| Power BI + Copilot | Microsoft-first teams | Deep Microsoft/Fabric tie-in | Full AI use may need high Fabric capacity | $10–$14/user/month plus about $6,400/month for F64 |
| Tableau + Pulse | Visual KPI reporting | Strong dashboard storytelling and alerts | AI features tied to higher tiers | Viewer from $15/user/month; Creator $75/user/month |
| Looker | Metric control | LookML keeps KPI definitions consistent | More setup and engineering work | Starts around $5,000/month |
| Sigma | Spreadsheet-style warehouse analysis | Live data, no extracts | Less AI-first than others | About $600/month+ |
| Hex | Analyst-led notebook work | Editable SQL/Python with unlimited viewers on paid plans | Not built for broad self-serve | From $36/editor/month |
| Tellius | Automated anomaly and driver analysis | NLQ plus pattern detection | Price and setup are less clear | Custom |
| Snowflake AI BI Stack | Snowflake-first AI workflows | Queries data in place under Snowflake security | Needs another front end for polished BI | Consumption-based |
So if you’re choosing fast:
- Pick Querio for governed agent-first analytics
- Pick ThoughtSpot for search-first BI
- Pick Power BI if your company already runs on Microsoft
- Pick Tableau for dashboard-heavy exec reporting
- Pick Looker if metric consistency comes first
- Pick Sigma for finance-style spreadsheet analysis
- Pick Hex for analyst notebooks
- Pick Tellius for anomaly and driver finding
- Pick Snowflake’s stack if you want AI close to Snowflake data
The core idea is simple: fix your semantic layer first, then price the full deployment, not just the seat. That’s what separates a useful AI BI setup from one people stop using after the demo.
1. Querio
Querio ranks No. 1 because it brings together live warehouse access, governed metrics, and AI output you can inspect. For teams that need self-serve analytics without moving data out of the warehouse, that mix is a big deal.
Warehouse Governance
Querio connects live to Snowflake, BigQuery, Redshift, ClickHouse, and PostgreSQL through encrypted, read-only credentials. There are no extracts and no CSV back-and-forth. Standard packages include role-based access control, audit logs, and lineage [6].
Its context layer keeps metric definitions, joins, and trusted queries as plain SQL, Markdown, and Python files. Those files sync to GitHub alongside your dbt project. The agent can suggest updates, but people still review, approve, and commit them.
That setup helps answer a simple but important question: can the AI give people answers they can trust?
Natural-Language Analysis
In 2026 benchmarks, Querio reached 95% accuracy on ambiguous natural-language-to-sql conversions, which makes it a solid pick for finance and healthcare teams where governed definitions can't be optional [6]. A business user in Finance or Operations can ask a messy, multi-part question and get charts and summaries in seconds. At the same time, analysts can see exactly what the AI did inside an editable notebook.
Automated Insights
Querio doesn't stop at one-off questions. It can also watch metrics on its own. Scheduled investigations can run overnight to track revenue, margin, or marketing efficiency. If a threshold is crossed, the agent looks into the root cause and sends its findings to Slack or email.
In a 2026 retail case study, Querio used agentic notebooks to cross-reference inventory and marketing data, spot a 15% sales decline, and trace the root causes in under five minutes [6].
Deployment and Cost
Querio is a SaaS platform with month-to-month billing and no per-question charges. The Core plan costs $1,999/month or $1,699/month billed annually, and it includes unlimited users plus three data connections.
One Snowflake-based finance team reported a 70% reduction in manual analyst time after using Querio to automate compliant forecast creation [6]. The main tradeoff is a leaner UI and a smaller community ecosystem. So if your team wants governed self-serve analytics and automated monitoring on live warehouse data, Querio is easy to take seriously.
2. ThoughtSpot
ThoughtSpot stands out for search-first analytics and natural-language queries on live warehouse data. It fits best with teams that already have a mature warehouse model and want search-led self-serve analytics across a large company. In 2026, enterprise users rated it 8.8/10, and Gartner named it a Leader in the 2025 Magic Quadrant for Analytics and Business Intelligence Platforms [6][4].
Warehouse Governance
ThoughtSpot runs queries directly in the warehouse across Snowflake, BigQuery, Databricks, Amazon Redshift, and Postgres, while using the security and governance controls you already have in place [5][1]. That setup matters a lot. If your metrics are clean and consistent, search works well. If they aren't, the experience can fall apart fast.
Natural-Language Analysis
Spotter lets users type questions in plain English and get a chart right away, which makes guided analysis much easier for non-technical users [2]. It isn't just for one-off questions, either. ThoughtSpot can also look through data on its own and surface patterns without waiting for someone to ask.
Automated Insights
SpotIQ scans large datasets for anomalies, trends, and drivers in seconds [5][3]. A good example is WEX. The company rolled out ThoughtSpot's conversational AI under the name AssistIQ and hit a 65% adoption rate within 90 days, while dropping report generation times from five-minute timeouts to under three seconds [8]. That's a strong sign that business users can get comfortable with the tool fast once the semantic layer is mature.
Deployment and Cost
Enterprise rollouts usually take 3 to 6 months [5]. Pricing starts at $25 per user/month for Essentials and $50 per user/month for Pro. Enterprise deals are custom and often land between $100,000 and $500,000+ per year [2][5]. In plain terms, ThoughtSpot makes the most sense for teams that already trust their warehouse model and want self-service analytics platforms for the enterprise.
3. Microsoft Power BI with Copilot
Power BI with Copilot is a strong match for Microsoft-first teams that want governed self-service BI, plain-English querying, and automated summaries in one place. It has broad enterprise reach, but there’s a catch: that reach comes with limits. So it tends to work best when governance, reporting, and Microsoft workflow integration matter more than standalone freedom.
Warehouse Governance
Power BI connects to 160+ data sources, including Snowflake, BigQuery, Redshift, and Postgres [6]. It’s tightly tied to Microsoft Fabric, with OneLake as the data base and Microsoft Purview handling governance across layers [4].
That setup gives teams more control, but it also means Copilot depends heavily on what sits underneath. If the semantic model is messy, the AI output will be too. Put simply, Copilot is only as good as the model feeding it.
Natural-Language Analysis
That governance tradeoff shows up clearly in the AI experience. Copilot lets business users ask questions in plain English, build full reports from a single prompt, and generate DAX automatically [3][6].
For teams already living in Microsoft 365, this feels like a natural extension of the tools they use every day. Outside that world, though, it can feel more boxed in [5][6].
Automated Insights
Copilot can summarize entire report pages in plain language and flag metric changes automatically [3][4]. More importantly, it can explain why a number changed, not just point out that it changed.
That said, this isn’t a “set it and forget it” setup. Analysts still need to check the semantic layer before teams can trust those summaries at scale [1].
Deployment and Cost
Cost matters here just as much as features. Power BI Pro seats run about $10–$14 per user per month, but full Copilot use usually requires Microsoft Fabric capacity at F64 or higher, which costs roughly $6,400 per month [1]. Some Copilot features may be available on lower tiers, such as F2+ or Power BI Premium P1+ capacity [2].
So yes, the math can work for Microsoft-first teams. But full Copilot access may push them into a much higher spend tier than the base seat price suggests.
| Component | Requirement | Cost Signal |
|---|---|---|
| Base License | Power BI Pro | $10–$14/user/mo |
| Full AI Access | Fabric F64 capacity | ~$6,400/mo |
4. Tableau with Tableau Pulse
Tableau has been a Gartner Magic Quadrant Leader for 13 straight years [4]. It’s also one of the most mature AI BI platforms on the market, especially if your team cares a lot about visual storytelling or already works inside the Salesforce world. In plain terms, Tableau tends to work best when a team already has a clean semantic layer and wants to add AI on top of visual analytics, not use AI to patch messy data.
Warehouse Governance
Tableau connects to 110+ native data sources, including Snowflake, BigQuery, Redshift, and Postgres [4][5]. That gives teams plenty of room to plug Tableau into an existing stack.
But there’s a catch. Tableau’s AI features mostly query published data sources, so the quality of the output depends heavily on Tableau’s semantic layer, not only on the warehouse itself. If your team doesn’t have clear metric models in place, trust can break down fast. The tool may still return an answer, but that doesn’t always mean people will believe it.
Natural-Language Analysis
Tableau Agent lets users ask questions in plain English, build calculations, and format dashboards without writing code [6][4]. That lowers the barrier for non-technical users and makes simple analysis feel much less intimidating.
It can also handle follow-up questions. Still, multi-turn context remains limited [5]. So while it feels conversational at first, it may lose the thread when a user tries to dig deeper across several back-and-forth prompts.
Automated Insights
Tableau Pulse sends KPI updates straight to Slack, Microsoft Teams, or email, so users don’t need to open a dashboard just to check what changed [6][3][4]. That simple shift matters. Instead of waiting for someone to go looking for a number, the number comes to them.
Einstein Discovery adds no-code predictive modeling and suggested actions inside the Tableau interface [3]. For teams that want more than static charts, that can make Tableau feel less like a reporting tool and more like a decision support layer.
Deployment and Cost
Cost is a big deal here because Tableau gates AI features by tier, not only by seat price.
| Seat Type | Price |
|---|---|
| Viewer | Starts at $15/user/month [6][4] |
| Creator | $75/user/month [1] |
| Tableau+ Bundle | Contact sales [1][2] |
Creator includes basic Pulse and Ask Data [1]. More advanced features, like Tableau Agent and deeper Pulse Q&A, require Tableau+ or another upper tier with custom pricing [1][2]. That can push Tableau into a much higher spend range, which is a serious factor for teams with 100–500 employees that are keeping a close eye on budget.
Teams that want more warehouse-native exploration and analysis and tighter model control often end up looking at the next option in the ranking.
5. Looker
Looker is a strong fit for teams that care a lot about keeping metrics the same across the company. With LookML, KPI definitions stay consistent across reports, dashboards, and AI answers. That’s why Looker stands out as the governance-first pick in this ranking. Gartner named Looker a Leader in June 2025 for governance and open architecture [4].
Warehouse Governance
Looker connects natively to BigQuery, Snowflake, Redshift, Postgres, and Databricks [1][2]. Its LookML layer sits between the user and the warehouse, which helps enforce row-level security and Git-integrated version control for metric definitions. In plain English, teams don’t have to argue over whether “revenue” means one thing in a dashboard and something else in an AI response.
Google Cloud users get the deepest integration. That said, Looker also supports cross-cloud and on-premise deployments [4].
Natural-Language Analysis
Once LookML is set up, Gemini can answer questions using governed business terms. In 2025, Google added Gemini AI to Looker for natural-language queries, AI-generated visualizations, and conversational analytics [4].
The big upside is simple: Gemini’s answers are tied to the LookML model, which helps cut down on unsupported answers. But there’s a catch. AI output is only as good as the definitions underneath it. If the semantic layer is weak, the AI can still return confident but inconsistent numbers [1][4].
Automated Insights
Looker also uses Google’s machine learning engines for automated anomaly detection and forecasting [3]. Google is pushing Looker further into AI agents in data analytics, where AI can dig into data and surface findings on its own inside the governed LookML framework [4].
That matters most for teams that are already centered on BigQuery. If your data stack lives there, the setup makes a lot more sense.
Deployment and Cost
This is the part that can make mid-market teams pause. Looker Core starts at about $5,000 per month, and enterprise contracts can hit $100,000+ per year based on user count and data volume [4][5].
LookML also adds engineering work. Someone has to build and maintain those metric definitions before business users can get good results from the AI layer. So the tradeoff is pretty straightforward: tighter metric control, more setup work.
Teams that want a lighter semantic-layer setup often compare the next option in the ranking.
6. Sigma Computing
Sigma is a spreadsheet-native BI tool built for finance and operations teams that want live warehouse data without extracts. It queries the warehouse directly, so you’re working with current data instead of pulled copies. That makes Sigma a strong pick when governed warehouse data matters more than open-ended AI responses.
Warehouse Governance
Sigma connects natively to Snowflake, BigQuery, Databricks, and PostgreSQL, and it queries live data without extracts [3][5][9]. Row-level security and lineage also carry through to each workbook [9].
Sigma does not include its own semantic layer. So if your dbt models or warehouse definitions are messy or inconsistent, those issues show up in Sigma too. In plain English: upstream modeling needs to be clean if you want clean reporting in Sigma [9].
That governance-first setup shapes the way Sigma handles AI.
Natural-Language Analysis
Sigma uses natural language more like an assistant than a replacement analyst. It turns questions into formulas and workbook-based analysis instead of giving you standalone AI answers.
Automated Insights
Sigma includes AI-assisted query help, live editing, and what-if modeling inside governed workbooks [9].
Deployment and Cost
Pricing is usually per user, starts at about $600 per month, and scales into custom enterprise tiers [9][1]. Setup often takes several weeks and depends a lot on how mature the underlying warehouse is [9].
Users often say Sigma’s dashboards feel less dynamic than Tableau or Power BI dashboards [9]. Where Sigma stands out is spreadsheet-native analysis inside a governed data setup, especially for teams that care more about controlled analysis than highly interactive dashboards.
Teams that want a more code-forward analytics workflow will notice a different pattern in the next tool.
7. Hex
Hex is a collaborative notebook platform for analysts who work in SQL and Python. Teams use it to publish analysis as interactive Data Apps for stakeholders. But Hex is built for analyst-led work, not broad self-serve BI for non-technical users. So if governed analysis matters more than point-and-click dashboards, Hex makes a lot of sense.
Warehouse Governance
In day-to-day use, governance stays in the warehouse, while analysts manage the notebook layer. Hex inherits permissions, roles, and row-level security from Snowflake, BigQuery, Redshift, or Postgres. It also adds project-level controls for notebooks and Data Apps. If you use dbt, the optional integration pulls governed definitions into the notebook environment [2].
Natural-Language Analysis
Hex’s AI assistant, Magic (Notebook Agent), turns natural-language prompts into editable SQL and Python cells [2]. That matters because analysts can inspect the code, tweak it, and make sure it does what they expect. Nothing is hidden behind a black box.
The catch is pretty clear: Hex is made for analysts. It’s not the kind of tool where business users jump in and ask questions on their own.
Automated Insights
Hex does not provide automated KPI alerts or anomaly surfacing. Organizations requiring these features often look for specialized AI tools for KPI benchmarking to automate monitoring. Analysts still lead the analysis, and the AI helps with code generation.
Deployment and Cost
Hex received an Ease of Use rating of 5.8/10, which points to a technical learning curve [6]. Pricing starts with a free Community tier. After that, plans move to $36 per editor per month for Professional and $75 per editor per month for Team, which adds Git and dbt integration [2][7].
One nice detail: paid plans include unlimited viewers. For teams with 100 to 500 employees, that can make it much easier to share read-only access across the company without getting hit with per-seat viewer fees [2][7].
Hex keeps the data team in the middle of the workflow. It works best for organizations that want a code-first setup and are fine with business users consuming published apps instead of building their own analysis. If your team wants the system itself to flag anomalies, you’ll likely want a tool built for that style of work.
8. Tellius
Tellius is a step up for teams that want the system to do more than answer questions fast. It can surface anomalies and likely drivers on its own. You get plain-English querying, plus automated insight discovery on top of warehouse data. That makes it a strong fit for teams that want governed analysis and proactive anomaly spotting in one place.
Warehouse Governance
Tellius uses a centralized metadata layer for metrics, dimensions, and business logic. That helps keep answers in sync across users, which matters when different teams are looking at the same KPI. Its analytical steps are also inspectable, so you can check how each answer was produced instead of taking the output on faith.
Natural-Language Analysis
Users can ask questions in plain English and get SQL, charts, or dashboard tiles in seconds [1][3]. That sounds simple, and in practice it can be. But there’s a catch: accuracy still depends on clean metric definitions and solid evaluation sets. If the inputs are messy, the output can drift.
Automated Insights
Tellius can automatically surface patterns and anomalies, which helps teams catch KPI shifts without waiting for someone to run a query. That’s the big draw. The tradeoff is setup and governance. The more automation you want, the more care the team usually needs to put into the layer behind it.
Deployment and Fit
Tellius runs on top of existing warehouse data in Snowflake, BigQuery, Redshift, and Postgres. It fits teams that want governed NLQ and automated insight discovery in a single layer.
9. Snowflake AI-Powered BI Stack
For Snowflake-first teams, the BI layer can sit inside the warehouse instead of on top of it. The Snowflake AI-Powered BI Stack brings together Cortex Analyst, Cortex ML Functions, and Document AI into a warehouse-native BI layer. This isn't a standalone BI app. It's an analytics engine that runs analysis directly in Snowflake.
Warehouse Governance
The big draw here is governance. Cortex Analyst queries data in place and inherits Snowflake's existing RBAC, audit logs, and security policies [1][8]. That means teams don't have to bolt on a separate access model just to use AI.
Semantic Views do a lot of the heavy lifting too. They define certified tables, dimensions, facts, metrics, and relationships, so the AI works from approved business logic instead of trying to piece it together on the fly [1][8].
Natural-Language Analysis
Users can ask questions in plain English and get SQL back against live Snowflake data. Snowflake reports accuracy of 90% or higher when Cortex Analyst is paired with a mature semantic model [1].
There's one practical catch: don't point it at the whole warehouse and hope for the best. Scope AI views to specific domains like Finance or Sales. In plain terms, tighter scope usually means cleaner answers.
Once plain-English queries are working, the next move is automated detection.
Automated Insights and Visualization
Cortex ML Functions add SQL-native forecasting and anomaly detection without Python. That's handy for teams that want to stay close to SQL and avoid building a separate ML workflow.
Snowflake still leans on Tableau or Power BI for executive dashboards and richer visual storytelling [4]. It also exposes an API for embedding governed natural-language querying in custom apps under Snowflake's existing security model [8][4].
Deployment and Cost
Pricing is consumption-based and billed in Snowflake credits, not per-seat licenses [1][4]. For Snowflake-first teams with a strong semantic layer, this stack fits well. If your team wants a polished self-serve front end, you'll still need a BI tool on top.
That puts Snowflake in a clear lane: governed analysis close to the data, rather than front-end BI polish.
Pros and Cons by Tool
The table below gets to the stuff that tends to make or break adoption: live warehouse access, inspectable AI, semantic-layer work, and total cost. That’s where the tradeoffs show up in practice.
| Tool | Key Pros | Key Cons | Best-Fit Team |
|---|---|---|---|
| Querio | 95% NL-to-SQL accuracy; inspectable SQL/Python in reactive notebooks; GitHub/dbt-synced context layer; live warehouse connections | Requires an existing warehouse; less visual polish than legacy BI tools | Mid-market B2B SaaS, healthcare, and finance teams on a real warehouse |
| ThoughtSpot | Search-first interface; SpotIQ anomaly detection; direct live querying to multiple warehouses | Enterprise pricing ($100,000–$500,000+/year); requires very clean data modeling [5] | Large enterprises with dedicated data modeling resources |
| Microsoft Power BI with Copilot | Deep Microsoft 365/Fabric integration; Copilot generates DAX | Full Copilot requires Fabric F64 capacity, roughly $6,400/month [1]; DAX expertise still needed | Microsoft-committed enterprises |
| Tableau with Tableau Pulse | Strong visual storytelling; Pulse delivers proactive metric alerts; Salesforce ecosystem integration | High total cost of ownership; Creator seats at $75/month; AI Agent requires Tableau+ bundle [1] | Visual-heavy teams in the Salesforce ecosystem |
| Looker | LookML enforces a single source of truth; robust governance; live BigQuery-native querying | Steep LookML learning curve; Google Cloud-centric; starting at $5,000/month [4] | Teams where metric consistency is the top priority |
| Sigma Computing | Live warehouse querying; no data movement | Less focused on AI-first assistant workflows | Teams wanting warehouse-native analytics without moving data |
| Hex | Collaborative notebooks with SQL and Python; transparent, inspectable outputs; Professional plan at $36/editor/month [2] | Not suited for non-technical self-serve; lighter governance and RBAC than enterprise BI tools | Data teams doing collaborative analysis and sharing results with stakeholders |
| Tellius | Search-based analytics with automated insight discovery; useful for anomaly detection at scale | Opaque pricing; significant setup required; answers you can't inspect [4] | Enterprises focused on automated insight discovery across large datasets |
| Snowflake AI-Powered BI Stack | Zero data movement; inherits Snowflake RBAC and audit logs; SQL-native ML functions; 90%+ accuracy with a mature semantic model [1]; consumption-based pricing | Snowflake-only; minimal built-in visualization | Snowflake-first teams building AI workflows close to the data |
A pattern shows up pretty fast across all nine tools: accuracy comes more from the maturity of the semantic layer than from the LLM underneath it. That matters because two tools can look similar in a demo and behave very differently once people start asking messy business questions.
Cost has the same issue. The sticker price is only part of the story. Per-seat pricing often looks simple, but the actual deployment cost can climb once you factor in capacity requirements, modeling work, governance setup, and the people needed to keep the system in shape.
The conclusion turns those tradeoffs into a final recommendation by team type.
Conclusion
In 2026, the best AI BI tool isn’t the one with the flashiest demo. It’s the one that fits your warehouse, governance model, and the way your team actually works. For mid-market teams that want governed self-serve on live data, Querio stands out as the strongest fit.
Here’s the quickest way to match each tool to the job it does best.
| Use Case | Best Tool | Why It Wins Here |
|---|---|---|
| Governed agent-first analytics | Querio | 95% NL-to-SQL accuracy; transparent, auditable answers; governed context layer [6] |
| Search-driven BI | ThoughtSpot | Search-first analytics with live warehouse connections [1][3] |
| Microsoft-first organizations | Power BI + Copilot | Native integration with Teams, Excel, and Azure [4] |
| Visual KPI storytelling | Tableau with Pulse | Gold standard for visualization; proactive metric digests delivered to Slack/Teams [3][4] |
| Governed metrics | Looker | LookML enforces a single source of truth across every query [1][3] |
| Spreadsheet-style analysis | Sigma Computing | Familiar spreadsheet interface querying the warehouse directly [4][5] |
| Notebook-centric teams | Hex | Collaborative SQL/Python notebooks at $36/editor/month [2] |
| Root-cause diagnostics | Tellius | Automated insight discovery built for "why" questions at scale [4] |
| Snowflake-native AI workflows | Snowflake AI-Powered BI Stack | Zero data movement; inherits existing Snowflake RBAC and audit logs [1][4] |
Across all of these categories, two things matter more than flashy AI features: governed definitions and live warehouse access.
For U.S. mid-market B2B SaaS, healthcare, and finance teams, the shortest path is often a warehouse-native stack. And if you want governed self-serve without opaque AI, Querio is the clearest place to start.
Two points matter more than the tool itself:
- Fix your semantic layer before you buy anything. AI will re-derive metrics in inconsistent ways when definitions aren’t governed [1][3].
- Price the capacity, not just the seat. Power BI Copilot requires Fabric F64 capacity at about $6,400/month [1], while ThoughtSpot enterprise deployments often land in the $100,000–$500,000+ per year range [5].
The teams that win with AI BI in 2026 are the ones that get governance in place before they go all-in on automation.
FAQs
::: faq
How mature does our semantic layer need to be before rollout?
Mature enough to set one shared dictionary for key business metrics before rollout. If teams don’t use the same definition for terms like revenue, CAC, or contribution margin, an AI BI tool can give you mixed answers.
Some tools can read raw schema metadata, but their output is still limited by how mature your data model is. Teams that clean up semantic definitions first usually get better analytics ROI and fewer number disputes. :::
::: faq
What hidden costs matter beyond seat pricing?
Beyond the monthly subscription, total cost of ownership usually includes implementation consulting, specialized training, ongoing maintenance, and data engineering time.
That base subscription can look simple at first. Then the extra work starts to show up. If a tool needs a pre-built semantic layer or heavy data prep before anyone can use it, your team may spend a lot more time and money up front. It can also slow down time-to-first-answer, which is a big deal when people want value fast.
It’s also smart to look past the seat price. Enablement fees and capacity-based tiers can push total costs well above the sticker price, sometimes by a lot. :::
::: faq
How should a mid-market team pilot AI BI safely?
Prioritize governance and transparency over speed. Start by auditing data quality. Then make sure you have a governed semantic layer in place, because AI output is only as reliable as the metric definitions behind it.
Run a 30-day pilot on a representative slice of your actual warehouse, not a sandbox. Use five to seven ambiguous, multi-step questions to see how the system handles messy, day-to-day analysis. Require visible SQL for every answer, and verify that warehouse permissions, row-level security, and audit logs stay enforced throughout the test. :::