Business Intelligence
Top AI Features to Look for in a BI Tool
Explore essential AI capabilities for modern BI tools—NLQ, automated insights, predictive analytics, anomaly detection, semantic layer, and governance.
Business Intelligence (BI) tools have evolved beyond static dashboards and manual reporting. Today, AI-powered features are transforming how businesses analyze data and make decisions. These tools simplify complex analytics, provide actionable insights, and empower non-technical users. Here's what to look for in modern BI tools:
Natural Language Query (NLQ): Ask questions in plain English and get instant answers without needing SQL.
Automated Insights: Get immediate summaries of trends, anomalies, and root causes in your data.
Predictive Analytics: Forecast future outcomes and explore "what-if" scenarios.
Anomaly Detection: Spot unusual patterns and receive alerts in real time.
Semantic Layer: Standardize metrics and ensure consistent results across teams.
AI-Driven Productivity Tools: Automate repetitive tasks for data teams to save time.
These features not only make data analysis faster and more accessible but also ensure transparency, security, and alignment with U.S. business standards like fiscal calendars, date formats (MM/DD/YYYY), and dollar-based reporting. Whether you're optimizing ad spend, managing inventory, or predicting trends, AI-powered BI tools are reshaping decision-making for businesses of all sizes.
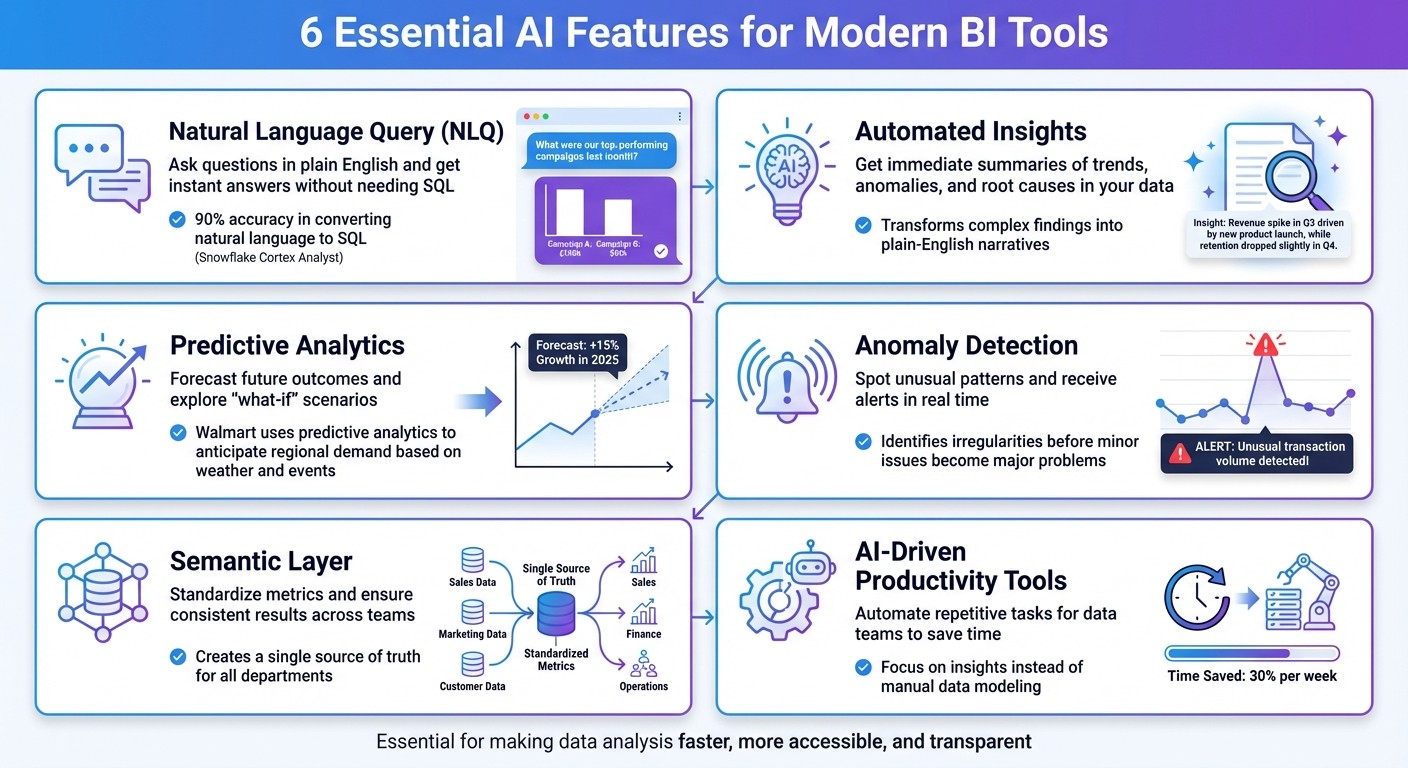
6 Essential AI Features for Modern BI Tools
Best AI Features in Power BI for 10x Faster Data Analysis

1. Natural Language Query and Conversational Interfaces
Natural language query (NLQ) tools make it easy for anyone to interact with data by using plain English instead of complex SQL code. Imagine a marketing manager typing, "What were our top-performing campaigns last month?" and instantly getting an answer - no need to involve a data analyst. This approach helps empower non-technical teams to access data across an organization. Why is this important? Traditional BI tools are often too technical, and as a result, only about 25% of employees actually use them[1].
NLQ systems have come a long way in terms of accuracy. Take Snowflake's Cortex Analyst, for example - it achieves around 90% accuracy when converting natural language into SQL for structured data[2]. But accuracy alone isn’t enough. These tools also need to understand local formats, like dates (MM/DD/YYYY) or currency symbols ($). If you ask, "Show me revenue trends for Q4", the system should automatically align with your company’s fiscal calendar. This level of precision builds user confidence and helps teams make better decisions.
However, it’s not just about getting answers - it’s also about understanding how those answers are generated.
Explainability and Transparency of AI Outputs
For people to trust AI tools, transparency is key. The best NLQ tools don’t just give you results - they show the SQL logic behind your query. This step-by-step breakdown helps users verify the results and see how the tool interpreted their question[3]. For instance, if you ask about "high-value customers", the tool should clearly display the criteria it used to define that group. This way, you can tweak the parameters if needed. Without this kind of transparency, "black-box" systems can lead to misunderstandings or even incorrect decisions.
Transparency is one piece of the puzzle. Another critical factor is ensuring secure and controlled access to data.
Data Access and Governance Capabilities
A good NLQ tool connects directly to your data warehouse through live, read-only connections, rather than duplicating your data into separate systems. This setup ensures that your existing security rules and access controls remain intact. For example, if a sales rep isn’t authorized to view certain customer segments, the NLQ tool will respect those restrictions automatically. In this way, the tool acts as a secure bridge to your data, ensuring governance policies are upheld while still making insights accessible.
2. Automated Insights and Narrative Summaries
Machine learning in modern data analytics enables automated insights to uncover patterns in massive datasets. Instead of spending hours manually building dashboards or creating reports, AI-powered tools can pinpoint trends, correlations, and anomalies almost instantly. What sets them apart is their ability to transform these complex findings into plain-English narratives that are easy for anyone to understand.
Picture a retail manager analyzing sales data. Instead of sifting through spreadsheets or charts, they receive a clear, concise summary highlighting key shifts - whether by geography, product category, or time period. These tools don’t just describe what happened; they identify the root causes, moving from descriptive to prescriptive reporting. This means teams can act in real time rather than scrambling to react after problems have already surfaced [4]. By replacing manual reporting with immediate, actionable insights, businesses are better equipped for quick decision-making.
"AI is making data less about numbers and more about insightful stories that every team member can read and understand." - Improvado [4]
Unlike traditional tools that rely on periodic dashboards and manual analysis, AI-enhanced systems can process both structured and unstructured data at lightning speed. They deliver insights through conversational interfaces, identifying everything from seasonal trends to sudden changes in customer behavior. These systems not only highlight anomalies but also explain the drivers behind them. However, for AI to be truly effective, it must go beyond generating narratives - it needs to be transparent about how it reaches its conclusions.
Explainability and Transparency of AI Outputs
Transparency is critical when it comes to AI-generated insights. Features that allow users to see the underlying logic - like key calculation steps - are essential for validating conclusions. For instance, if the AI reports a drop in profit margins due to rising shipping costs, users should be able to review the exact calculations and data sources behind that finding. Without this level of clarity, the system risks becoming a "black box", making it harder to trust or improve.
Alignment with U.S. Data Formats and Business Needs
For insights to be immediately actionable, they must align with U.S. data standards. Using familiar formats - such as the dollar sign ($) for currency, MM/DD/YYYY for dates, and conventional numbering conventions - ensures clarity. A well-designed semantic layer can map complex database structures to straightforward business terms like "customer acquisition cost" or "quarterly revenue growth." This makes the AI's output not only understandable but also directly relevant to a company’s fiscal calendar and reporting needs.
3. Predictive and Prescriptive Analytics
Predictive analytics uses historical data combined with machine learning to predict future outcomes, such as forecasting next month's sales or identifying potential equipment failures. Prescriptive analytics takes things a step further by not only forecasting but also suggesting actionable steps. It leverages optimization algorithms and simulation models, making it possible for non-technical users to explore complex "what-if" scenarios without needing a background in data science [2][5]. For example, a marketing manager could assess how increasing ad spend by $10,000 might influence customer acquisition rates, or a supply chain analyst could simulate how adverse weather conditions might affect inventory levels in specific regions.
In 2024, Walmart introduced a predictive analytics system that analyzes weather data, local events, and historical sales trends to anticipate regional demand. This system allows the retailer to adjust pricing and inventory in real time, helping to prevent stockouts across its stores [8]. However, for these forecasts to be effective, it’s critical that users understand how the predictions are made, which highlights the importance of transparency in AI models.
Explainability and Transparency of AI Outputs
Much like the natural language query (NLQ) tools mentioned earlier, which are detailed in our natural language BI guide, predictive models need to provide clear and understandable reasoning to build user trust. Transparency is key. These models should break down their "thinking process", showing how trends, seasonal patterns, or external variables influence their forecasts. This level of clarity ensures the predictions are not only auditable but also compliant with regulatory standards [7][3][9].
Alignment with U.S. Data Formats and Business Needs
The effectiveness of predictive models hinges on the quality and formatting of the data they are trained on. Adhering to standardized U.S. formats - such as MM/DD/YYYY for dates, dollar signs for currency, and comma-separated numbers (e.g., 1,000.50) - ensures that predictions align seamlessly with American business practices and fiscal reporting [6]. These consistent formats make it easier to integrate AI insights into day-to-day operations.
Integration with Workflows and Downstream Tools
Predictive and prescriptive analytics are most impactful when they integrate smoothly into existing workflows. For instance, in 2024, Wells Fargo implemented an AI-driven fraud detection system capable of analyzing millions of transactions in real time. Using anomaly detection algorithms, the system flags suspicious activities for human review, helping the bank intercept fraudulent transactions before they are processed. This approach has saved Wells Fargo millions of dollars [8].
The real value lies in ensuring that AI-generated recommendations can be seamlessly applied within operational systems. Whether it’s triggering inventory restocks, tweaking marketing strategies, or sending alerts through platforms like Slack or email, the integration of these insights into everyday tools ensures businesses can act on AI-driven insights efficiently [8][4].
4. Anomaly Detection and Intelligent Alerts
Anomaly detection takes predictive analytics a step further by identifying irregularities as they happen. Instead of waiting for problems to surface, this technology keeps a constant eye on data, spotting unusual patterns and alerting teams before minor issues turn into major headaches. By analyzing metrics in real time and flagging deviations from standard behavior, AI eliminates the need for manual checks, a key advancement among modern business intelligence tools. This shift allows teams to move from putting out fires to tackling strategic challenges. While AI handles the heavy lifting of monitoring, human analysts can focus on verifying findings and crafting creative solutions to complex problems [11]. This system integrates seamlessly into transparent AI operations, ensuring clarity and trust in its processes.
Explainability and Transparency of AI Outputs
Modern BI tools don't just flag anomalies - they explain them. Take Microsoft Power BI's Insights feature, for example. It dives into multiple data dimensions, ranking the strength of explanations and pinpointing the factors behind an anomaly [10]. These tools provide users with contextual insights through features like "Possible Explanations" or "Thinking Steps", helping them understand what caused the irregularity [10][3]. Without this kind of transparency, alerts risk becoming overwhelming noise rather than actionable insights.
Integration with Workflows and Downstream Tools
For alerts to drive action, they need to reach the right people at the right time. BI tools now integrate with popular collaboration platforms like Slack and Microsoft Teams, ensuring notifications flow directly into existing workflows. This setup eliminates the need for constant dashboard monitoring and guarantees that critical changes in metrics prompt immediate responses. At the same time, these alerts respect organizational security protocols and access controls, maintaining a balance between accessibility and data protection.
Alignment with U.S. Business Needs
To reduce false positives, anomaly detection tools are designed to align with standard U.S. formats and regulations. AI governance frameworks can automatically incorporate updates from laws like CCPA or HIPAA into data processes, ensuring compliance with evolving legal standards [12]. Additionally, the NIST Cyber AI Profile offers a roadmap for managing AI-related risks. It emphasizes maintaining detailed dataset inventories and metadata, which are crucial for enforcing boundaries and ensuring effective anomaly detection [13].
5. Semantic Layer and AI Explainability
A semantic layer is the backbone of reliable AI analytics. By standardizing definitions for terms like "revenue" or "VIP customer", it ensures every department operates with the same understanding. This shared framework creates a single source of truth, eliminating conflicting answers and enabling secure, transparent, and accurate AI outputs across your BI tools.
Data Access and Governance Capabilities
The semantic layer strengthens security by enforcing Row-Level and Column-Level Security at the modeling stage. By leveraging metadata-driven models, it protects sensitive data, ensures only authorized access, and supports compliance with organizational policies. This method helps in breaking down data silos and upholds governance practices, allowing businesses to confidently manage their data.
Explainability and Transparency of AI Outputs
For AI insights to be trusted, transparency is essential. Natalia Yanchiy from Eleken highlights this point: "Most AI products fail not because the model is wrong, but because users don't understand what it's doing" [14]. Modern BI tools address this by revealing their underlying logic, such as the SQL queries that generate answers. This level of visibility enables users to confirm accuracy and spot instances where AI might confidently produce incorrect results. Looking ahead, domain-specific language models and explainable interfaces are expected to play a pivotal role in advancing AI adoption by 2026 [14].
Alignment with U.S. Data Formats and Business Needs
A well-structured semantic layer ensures that AI tools align seamlessly with your business’s unique terminology and reporting requirements. For example, it standardizes language so that when someone asks about "turnover", the system can distinguish between employee attrition and sales revenue. It also adapts to fiscal calendars specific to your organization. By manually curating synonyms and filtering out irrelevant technical fields, the semantic layer fine-tunes the AI’s outputs, ensuring they reflect the way your teams communicate and work.
6. AI-Powered Productivity Tools for Data Teams
Data teams often find themselves bogged down by repetitive tasks - like defining relationships between datasets, labeling columns, or double-checking AI-generated SQL queries. Thankfully, modern BI tools are stepping up, using AI to handle these time-consuming workflows. By automating these processes, data professionals can focus their energy on extracting meaningful insights. This automation ties in with earlier AI features, streamlining workflows and making data-driven decisions more efficient.
Automated Data Modeling and Metadata Enrichment
AI can take the hassle out of creating data models by analyzing your warehouse schema and identifying how tables should connect. Instead of spending hours documenting joins or writing descriptions for countless columns, the system suggests relationships and labels based on patterns in naming conventions and data types. This not only saves time during the initial setup but also ensures that metadata evolves alongside your warehouse updates [3]. It’s another way AI simplifies the process, making BI tools more approachable for non-technical users while empowering teams to focus on the bigger picture.
Explainability and Transparency of AI Outputs
One of the biggest concerns with AI is trust - how do you know the system got it right? This is where explainability comes in. When AI generates SQL or models data, tools now provide clear "Thinking Steps." These steps outline the system’s logic - like which tables it chose, the filters it applied, and how it joined data - so teams can verify the results. This level of transparency helps catch errors early and builds confidence in AI-driven outputs, ensuring that BI tools remain reliable for everyone [3].
Integration with Workflows and Downstream Tools
Automation becomes even more powerful when it fits seamlessly into the tools you already use. AI-generated dashboards can now be embedded directly into platforms like Salesforce, Slack, or Microsoft Teams, thanks to embedded analytics platforms. APIs and iFrames make it possible to add natural language querying to custom applications, so users don’t have to jump between tools. Beyond reporting, these systems can also take action. For example, if revenue dips below a set threshold, the system could automatically create a task in your project management tool. By turning analytics into actionable workflows, these tools don’t just report insights - they help execute decisions. This integration reinforces the broader goal of making data accessible and actionable for everyone in the organization.
7. Querio: AI-Native Analytics Workspace
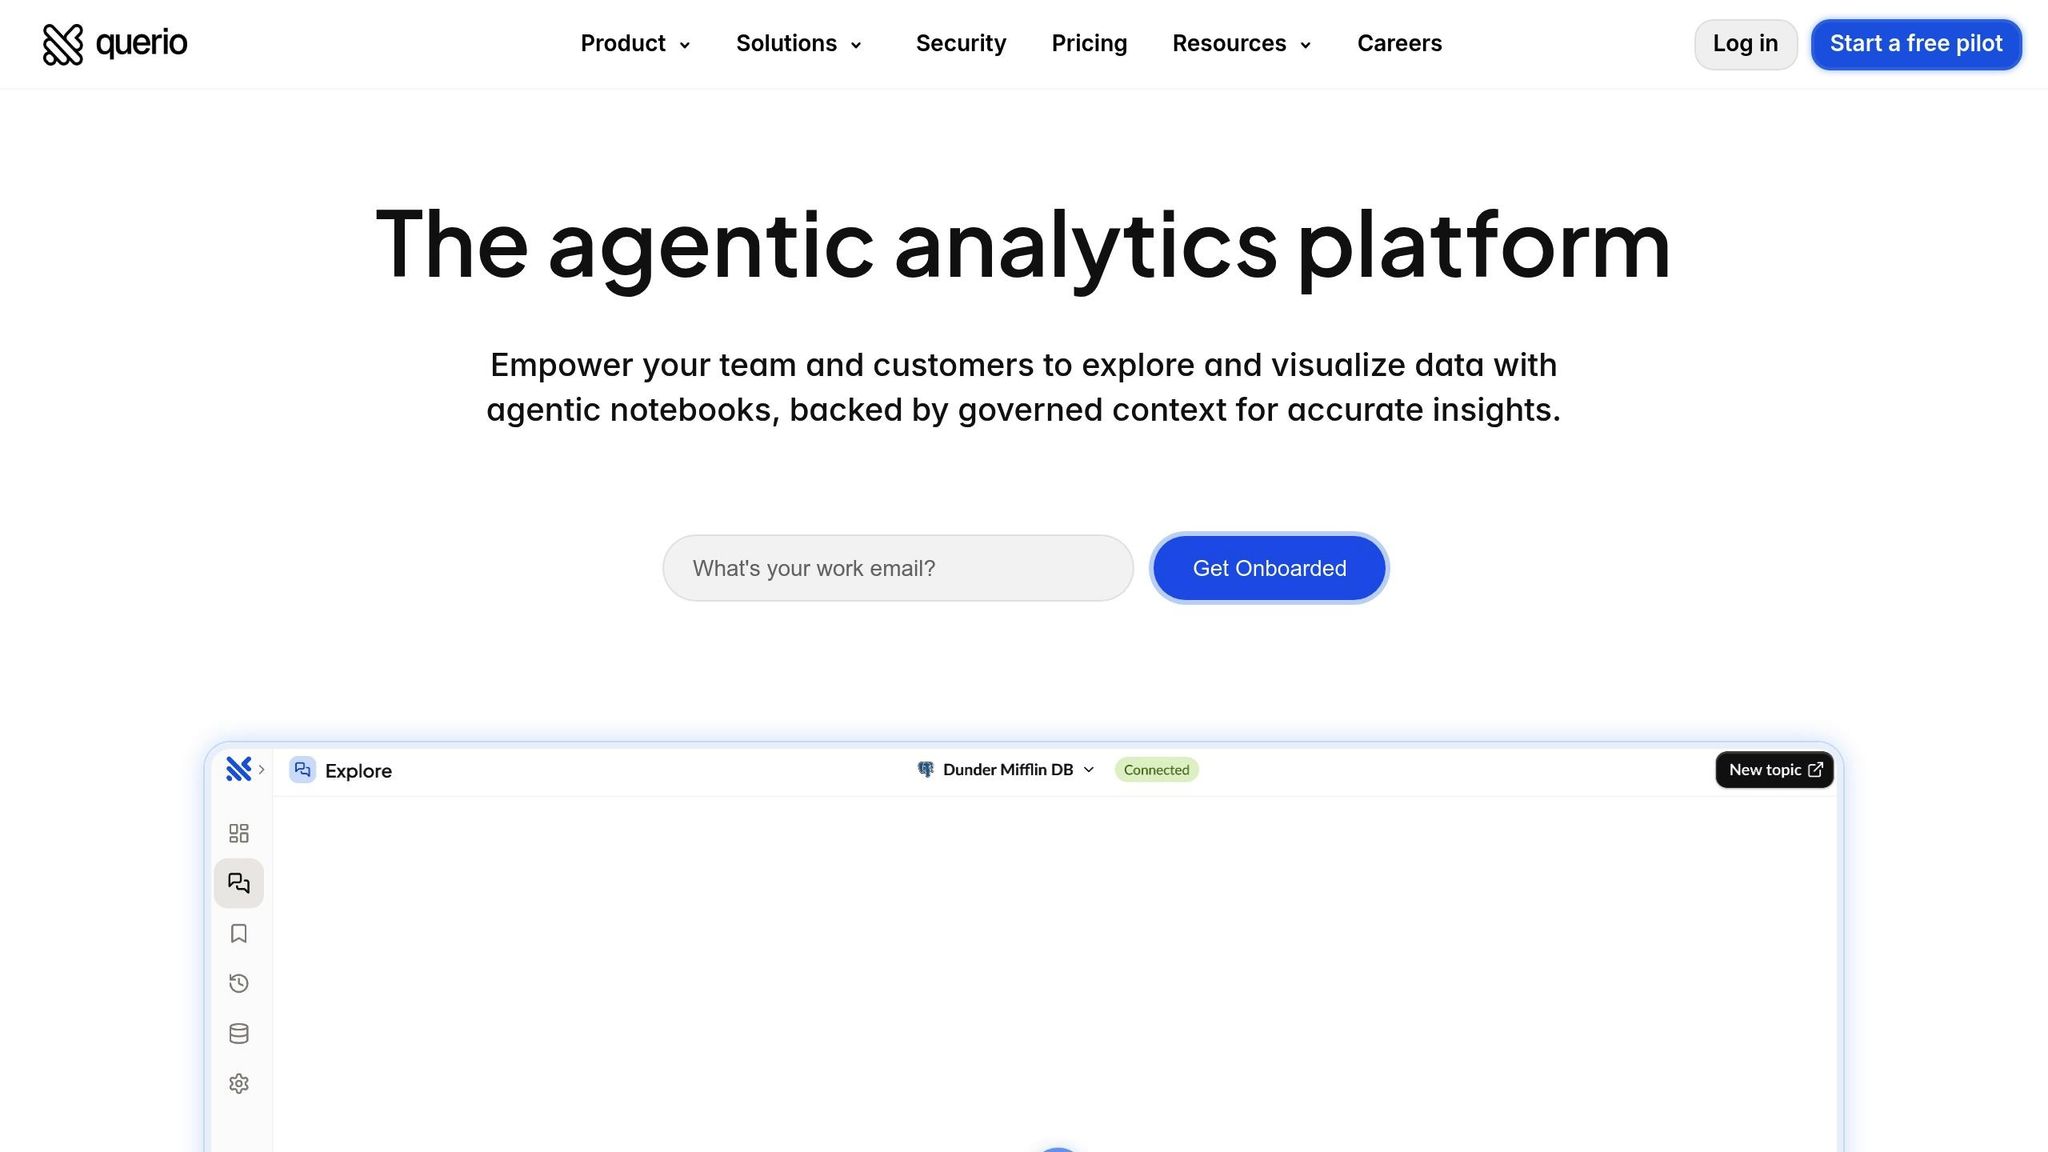
Querio combines advanced AI features like natural language queries, automated insights, and predictive analytics into a single workspace designed for smarter decision-making. It connects directly to platforms like Snowflake, BigQuery, and Postgres, offering real-time, secure access to your data without the need for duplication. With Querio, you can ask plain-English questions and get fast, accurate answers powered by verified SQL and Python logic.
Data Access and Governance Capabilities
Querio prioritizes security and governance with features like role-based access controls (RBAC) and data masking, ensuring users only see the data they're authorized to access. The platform is SOC 2 Type II certified, meeting rigorous U.S. security standards, and all data connections are read-only and encrypted, keeping your data warehouse safe while enabling self-service access for your team.
Feature | Implementation Detail | Business Benefit |
|---|---|---|
Live Connections | Direct links to Snowflake, BigQuery, Postgres | Real-time data access without duplication |
Semantic Layer | Unified business logic for consistent metrics | Consistent metrics across all departments |
RBAC | Role-based permissions and data masking | Secure, tailored access for users |
SOC 2 Type II | External auditing and certification | Compliance with U.S. security standards |
APIs for integration with other tools | Self-service analytics for end users |
These features ensure that your analytics processes are not only seamless but also secure and reliable.
Integration with Workflows and Downstream Tools
Querio makes it easy to turn insights into action by embedding analytics directly into your existing workflows. With APIs and theme tokens, you can deliver governed logic and insights straight to your customers within your own applications.
"What used to be a week-long process now takes minutes" - Jennifer Leidich, Co-Founder & CEO of Mercury [15]
"It's not just about saving time and money, it's about making data accessible" - Enver Melih Sorkun, Co-founder & CTO of Growdash [15]
Conclusion
When selecting a BI tool to enhance your analytics, focus on those equipped with AI-driven features that simplify and amplify your insights. Look for tools offering natural language queries - so anyone can ask questions in plain English - alongside automated insights that highlight critical data without manual effort. Features like predictive analytics help you anticipate trends, while anomaly detection identifies potential problems before they grow. A reliable semantic layer ensures metrics remain consistent across teams, and AI explainability builds trust in the results.
Security and governance are equally important. Choose a BI tool that supports secure, live data connections with features like role-based access controls (RBAC), data masking, and SOC 2 Type II certification. For U.S.-based teams, tools that align with local standards - like MM/DD/YYYY date formats, dollar signs for currency, and U.S. time zones and fiscal calendars - help ensure accuracy and compliance.
The top AI-native BI platforms bring all these capabilities together in one workspace. They eliminate the need for juggling multiple tools or exporting data into spreadsheets. Plus, they produce verifiable SQL and Python logic, empowering your team to confidently inspect and trust the results. As Querio states:
"Querio has context on your business and data. Only focus on your question, we make sure the answers are correct" [3].
FAQs
How can AI-powered BI tools help non-technical users make better decisions?
AI-powered BI tools break down complex data into clear, actionable insights, presented in plain language. This makes them easy to use, even for those without a technical background. Thanks to natural language processing, users can ask straightforward questions like, “What were our Q4 sales in USD?”, and instantly receive visualizations or trend highlights - no coding skills needed. This capability allows executives, marketers, and managers to dive into data on their own and make quicker, more informed decisions.
These tools go beyond basic analysis by offering features like predictive analytics and anomaly detection. Predictive models can estimate future outcomes, such as customer churn or product demand, while anomaly alerts notify users of unexpected changes in metrics, enabling timely action. Insights are delivered in real time and presented in familiar formats like dollars, percentages, or specific dates (e.g., January 9, 2026). This ensures that non-technical users can confidently interpret the data and make decisions without needing constant support from data teams.
Why is transparency important for building trust in AI-generated insights?
Transparency plays a key role in building trust in AI-generated insights by helping users grasp how decisions and recommendations come about. When a business intelligence (BI) tool offers clear explanations - like detailing how its algorithms analyze data or the reasoning behind specific predictions - it boosts confidence in the outcomes.
Focusing on explainability and providing in-depth insights into how AI works makes users more comfortable relying on the tool for important decisions. It also allows businesses to spot potential biases or errors, helping to keep the AI reliable and accurate over time.
Why is it important for BI tools to align with U.S. data formats?
Ensuring that a BI tool aligns with U.S. data formats is essential for clear communication and reliable decision-making. In the U.S., financial data is presented with $ as the currency symbol, commas separating thousands, and periods marking decimals (e.g., $1,234,567.89). Dates are formatted as MM/DD/YYYY, and measurements typically rely on imperial units like inches, pounds, and Fahrenheit. When BI tools are designed with these conventions in mind, users can interpret dashboards and insights effortlessly, avoiding confusion or costly mistakes.
Aligning with these formats also enhances advanced AI features, such as natural language queries and predictive analytics. For instance, when data adheres to U.S. conventions, AI can provide more accurate results and reduce the risk of misinterpreting critical metrics. Moreover, following these standards ensures compliance with regulations like GAAP and builds trust and confidence among U.S.-based teams, encouraging wider adoption of the tool.
Related Blog Posts


