Guide
What Is Self Service Data Analytics
What is self service data analytics? Learn how modern data teams enable non-technical users to explore, analyze, and act on data without waiting for IT.
In many startups, the data team becomes the place where good questions go to wait. A founder wants a quick read on pipeline quality, a product manager needs cohort behavior before a launch review, and finance wants the same revenue number the board saw last week. Meanwhile, analysts are still stitching together the answer manually, which turns data into a queue instead of an asset.
That pressure is why self-service data analytics exists. It's not just a nicer dashboard experience, it's a way to let business users explore trusted data without asking someone in IT for every slice, filter, or report. The catch is that access alone doesn't make analytics self-service. If your metrics aren't defined, your permissions aren't governed, and your warehouse doesn't expose consistent business logic, you end up with faster chaos instead of faster insight.
A useful mental model is simple, trusted self-service depends on three things working together, shared definitions, governed access, and usable interfaces. Miss any one of them and teams start arguing over numbers instead of making decisions. Get them right and the data team stops acting like a human API, then starts maintaining the infrastructure that lets everyone else move faster.
Table of Contents
- Introduction to Self-Service Data Analytics
- Understanding the Core Concept
- The Architecture Behind Self-Service Analytics
- Real-World Use Cases Across Teams
- Measuring the Business Impact and ROI
- Common Pitfalls and How to Avoid Them
- Choosing the Right Platform and Getting Started
Introduction to Self-Service Data Analytics
A founder I worked with once described the old reporting process as “asking for weather after the storm has already hit.” That's the core frustration self-service analytics tries to solve. By the time an analyst finishes the request, the team often has already made the decision with incomplete context, or worse, with a spreadsheet copied from someone else's dashboard.
The idea isn't new. Self-service data analytics grew from early business intelligence practices that date back to the early 19th century, then picked up speed once spreadsheet work became broadly accessible. A common milestone is Microsoft Excel's 1985 launch, followed by more than 30 million desktop users just 11 years later, which showed how quickly self-directed analysis could spread when the interface was usable for non-technical people. Industry histories also point to Qlik in the 1990s and Tableau in the early 2000s as key waypoints in the modern model where business users could query, slice, and visualize data without waiting on IT or analysts, as noted in Tellius' history of self-service analytics.
Practical rule: if a team can only answer routine business questions by filing a ticket, it doesn't have self-service analytics yet, it has a better front end on a manual process.
The shift is operational, not cosmetic. A company with true self-service doesn't just store more dashboards. It creates a trusted layer where people can ask their own questions, use the same definitions, and get answers fast enough to act on them while the decision still matters. That's the difference between data that reports on the business and data that helps run it.
Understanding the Core Concept
Self-service analytics means business users can access, explore, and visualize data on their own, without waiting for a central team to prepare every answer. The useful part is not just that people can click around in a dashboard. It's that they can follow a question from “what changed?” to “why did it change?” without opening a ticket.
From spreadsheets to modern exploration
The modern version of this idea became practical when interactive tools made exploration feel more like a conversation than a request queue. Early spreadsheet analysis gave non-technical teams a way to work directly with data, and later tools made it easier to filter, compare, and visualize information without code. That's why self-service analytics is often described as the point where business intelligence stopped being a specialist function and started becoming a shared habit.
You can think of the evolution in three steps. First, data lived in reports produced by analysts. Second, spreadsheet tools let more people do lightweight analysis. Third, modern platforms added governed exploration, so business users could ask their own questions against live systems instead of exporting stale files.
What makes it different from old BI
Traditional BI usually begins with a request. Someone asks for a dashboard, a report, or a metric definition, and the analytics team builds it. Self-service changes the workflow so the user can investigate first, then escalate only when they need deeper modeling or a reusable asset.
The distinction sounds small, but it changes behavior. In a self-service environment, the product manager doesn't wait three days to learn whether activation dipped after a release. They can inspect the data immediately, check the same metric the finance team uses, and decide whether the issue is product, pricing, or a tracking bug.
The best way to remember the model is this. Self-service analytics is not “everyone gets a dashboard.” It's “everyone can ask reliable questions of governed data.” That reliability only exists when the system underneath the interface is designed for consistency, security, and reuse.
The Architecture Behind Self-Service Analytics
A lot of teams buy the interface first and discover the architecture problem later. That's backwards. Self-service works when the platform is built so users can explore freely while the definitions, permissions, and data quality stay centralized.
The three layers that matter
The most durable pattern is a layered stack. At the bottom is the data layer, where warehouse tables, lake data, and APIs live. In the middle sits the semantic layer, where business definitions, joins, and metric logic are standardized. At the top is the experience layer, where dashboards, query tools, and notebooks give people a way to work with the data.
The semantic layer is the part many teams skip, and that's where the trouble starts. If one team calculates revenue from booked orders and another team calculates it from invoiced orders, both can produce a dashboard that looks right and still disagree with each other. Governing at the metric and warehouse layers prevents that drift because the logic is defined once and reused everywhere, rather than reimplemented in every dashboard.
This is the architectural reason self-service can scale. Certified data supports broad decisions. Departmental sandboxes support exploration. Promotion rules decide when a useful analysis becomes shared infrastructure. That layered model keeps experimentation available without letting every experiment become a new source of truth.
A good internal reference for this design is Querio's explanation of semantic layers, because the central idea is the same across tools, the platform has to understand the business terms before the business can trust the answers.
What governance actually does
Governance is not just a compliance checkbox. It is what makes broad access safe enough to use. RBAC, row-level filters, column masking, freshness tests, lineage, and version control all protect the system while keeping analysis flexible. The important part is that users still feel free to explore, but they are doing it inside a controlled model that preserves a single source of truth.
Important distinction: dashboard governance is too late. By the time a conflicting metric shows up in a dashboard, the disagreement has already spread into conversations, decks, and decisions.
The architecture also explains why logging matters. If every query is recorded, data teams can see what users are asking, which definitions are confusing, and where the model needs refinement. That turns governance from a policing exercise into a feedback loop.
Real-World Use Cases Across Teams
A founder doesn't want a data warehouse lecture at 8:30 a.m. They want to know whether the pipeline is healthy enough to support hiring, whether churn is moving in the wrong direction, and whether they can trust the numbers before the board meeting. In a self-service setup, they can pull those answers directly from governed metrics instead of waiting for an analyst to export a file.
Product managers feel the biggest difference during launches and experiments. When engagement drops, they don't need to file a ticket and wait for a custom report. They can check a shared metric, compare cohorts, and inspect behavior changes across features or segments. A stronger platform lets them do that without inventing their own logic in a spreadsheet, which matters because product decisions are only as good as the definitions behind them.
Data teams get a different kind of win. They stop being a bottleneck for every recurring question and start building the reusable assets that make self-service trustworthy. That includes curated datasets, semantic definitions, access policies, and guardrails that keep local exploration from turning into company-wide confusion.
For a deeper look at how the value changes by function, Querio's use case overview across industries and teams is a useful complement to the framework here.
Here's the pattern I see most often in practice:
- Founders: use self-service to move faster on fundraising, hiring, and operating reviews without turning engineering into the reporting layer.
- Product managers: use it to investigate adoption, retention, and feature performance without waiting for a one-off analysis.
- Data leads: use it to standardize definitions once, then spend more time on modeling and less time on repetitive requests.
The common thread is trust. If users don't trust the numbers, they'll go back to exporting data and making private versions of the truth. If they do trust the system, the organization starts making decisions from the same set of metrics.
Measuring the Business Impact and ROI
The market data tells you this category isn't a niche experiment anymore. One industry estimate puts the self-service BI and analytics market at about USD 7.10 billion in 2025, rising to USD 13.59 billion by 2031 at an 11.41% CAGR, while another estimates the global market at USD 10.1 billion in 2024. A separate report says roughly 74% of enterprises globally implemented self-service analytics tools in 2025, up from 48% in 2020, which is a strong signal that enterprises are treating this as core infrastructure rather than a nice-to-have feature, according to Mordor Intelligence.
What to measure inside your company
Internal ROI is usually easier to observe than to prove with a single metric. The most practical benchmark is to measure active BI users divided by eligible users, then watch whether the number of ad hoc requests and duplicate metric definitions declines after you introduce certified data and governance controls. If those two things don't improve, the platform may be installed, but self-service hasn't taken hold.
A better question than “how many dashboards exist?” is “how often do people use the governed system instead of asking for a manual extract?” If analysts are still fielding the same questions in Slack, the bottleneck isn't demand. It's the analytical substrate underneath the toolchain.
Why adoption depends on readiness
The adoption story is rarely about user enthusiasm. It's about whether the organization has the semantic consistency, training, and integration depth to make the data usable. Research on adoption and value realization points to perceived usefulness as the main driver, especially when teams feel the speed benefit, but diffusion still depends on governance maturity, legacy integration, and regulatory constraints, as discussed in the Thinkmind study.
If self-service isn't spreading, don't blame the users first. Check the model, the definitions, and the integration points underneath the interface.
For executives, the business case lands when self-service shortens decision cycles and reduces duplication without creating new risk. For data leaders, the win is less glamorous but more durable, fewer one-off requests, more reusable assets, and a data team that can spend its time improving the platform instead of manually answering the same question in five different formats.
A useful KPI framing guide is Querio's article on measuring key performance indicators, especially if your team needs to connect analytics usage to operating metrics instead of vanity dashboard counts.
Common Pitfalls and How to Avoid Them
The biggest mistake is assuming the tool is the solution. It isn't. The core gap is whether your organization has the semantic layer, governance, and data-quality foundations needed for trustworthy answers. Without those, self-service just gives more people faster access to inconsistent numbers.
Where teams usually get stuck
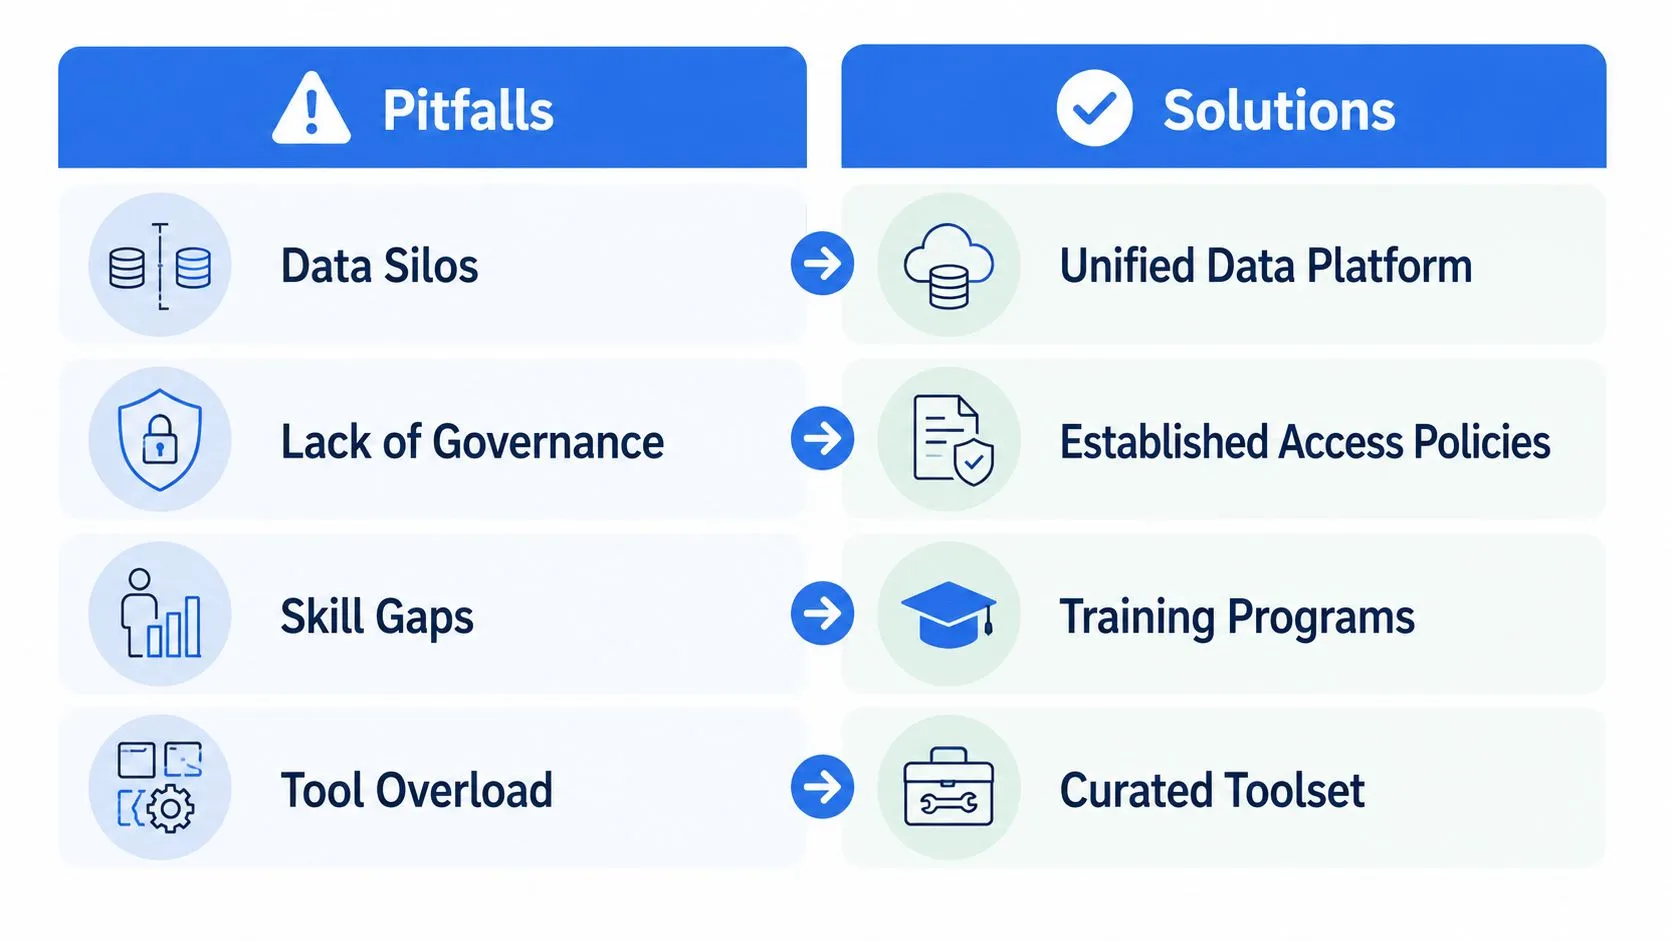
The first failure mode is data silos. Teams connect to different systems, but no one standardizes what key metrics mean across them. The second is weak governance, which lets people explore but doesn't prevent contradictory definitions from spreading. The third is skill gaps, where users can open the tool but don't know how to interpret what they see. The fourth is tool overload, where the company piles on interfaces without a clear model for how each one fits the workflow.
A simple pros and cons view helps here.
| What self-service gets right | Where it falls short without preparation |
|---|---|
| Faster access to data | Conflicting metric definitions |
| Less reliance on request queues | Shallow adoption after the pilot |
| Better collaboration across teams | Compliance and access risk |
| More reusable analytics assets | Confusion from too many disconnected tools |
The table is blunt on purpose. Self-service helps when the structure underneath is disciplined. If it isn't, the organization spends more time reconciling numbers than analyzing them.
How to avoid the usual trap
Start with the questions people ask most often, then define the metric once in a governed layer. From there, set access policies centrally, publish certified datasets, and keep a clear path for exploratory work that hasn't yet been promoted to shared infrastructure. That sequence protects trust without freezing experimentation.
The best organizations don't try to eliminate local exploration. They give teams room to test ideas in sandboxes, then promote the useful parts into shared models when the analysis becomes important enough to reuse. That's how you avoid the cycle where every team builds its own version of reality.
Choosing the Right Platform and Getting Started
The right platform is the one that matches your architecture, not the one with the longest feature list. If your team still lacks governed definitions, lineage, and access controls, a slick interface won't fix that. If those foundations already exist, then the platform should make exploration easier without breaking the single source of truth.
A practical way to evaluate options is to compare how well they support governed semantics, live warehouse access, and reusable analysis. Querio's platform selection guidance is one example of that decision style, because the question is not “which tool looks modern?” It's “which tool fits the way our data is already organized, and what will it take to make it trustworthy?”
| Feature | Traditional BI | AI-Native self-service platforms |
|---|---|---|
| Metric definitions | Often managed in reports or dashboards | Centralized in a governed semantic layer |
| User workflow | Request first, explore later | Ask directly, then refine |
| Data access | Usually mediated through analysts | Direct live access to warehouse data |
| Change management | Slower, more report-centric | Faster, with reusable logic and shared definitions |
| Fit for growing teams | Can become a backlog queue | Better suited when governance and exploration need to coexist |
If you want one operational checklist, use this: confirm the semantic layer exists, verify permissions are centralized, check that warehouse access is live and governed, then pilot with one business team that already feels the pain of slow reporting. That sequence surfaces readiness issues before they become expensive.
Querio is one option in this category. It connects directly to warehouse data, supports natural-language questions, and is built for teams that want self-service analytics without pushing every request through analysts.
If you're evaluating self-service analytics for a startup or a growing product team, Querio is worth a look because it aligns exploration with governed warehouse data instead of treating them as separate problems. Visit Querio to see how its approach fits your stack, then compare it against your current reporting bottlenecks and governance needs.