Guide
Operational Metrics Guide: Track What Actually Matters
Learn what operational metrics are, how to categorize them by function, and how to instrument, report, and avoid common pitfalls.
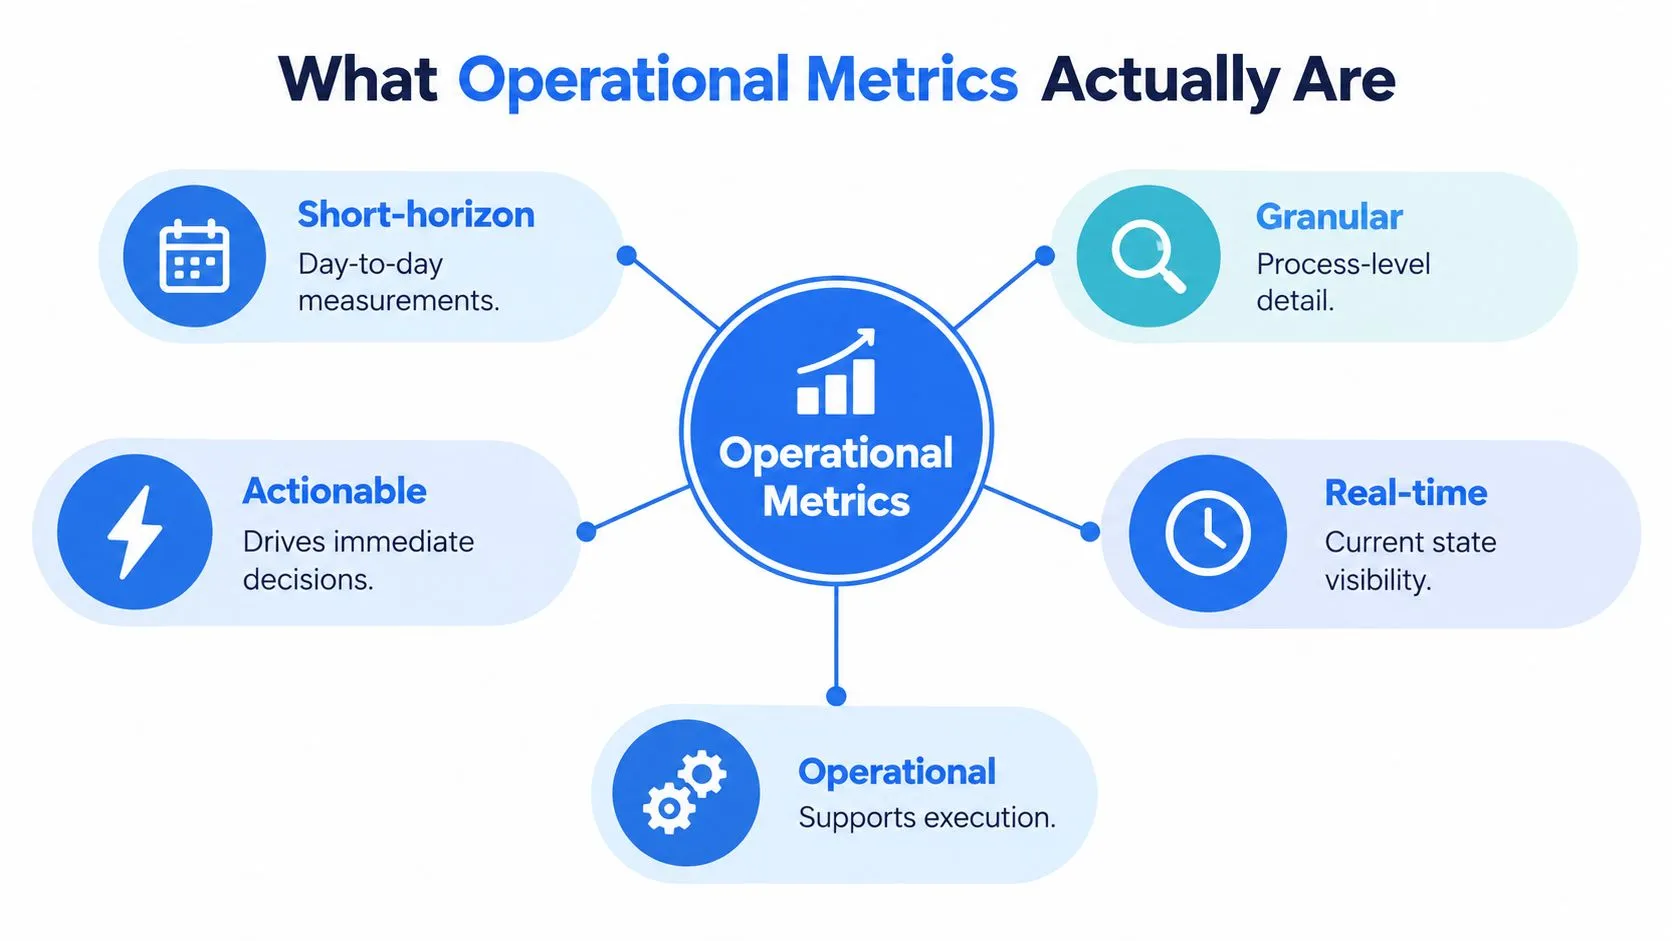
Operational metrics are granular, time-sensitive measurements of day-to-day business processes used to detect bottlenecks and drive near-real-time decisions. The KPI Institute reports that 25% of organizations struggle to align KPIs and targets across departments, while 24% struggle to select the right KPIs, and the selection challenge is worsening by 4% year over year (KPI Institute).
Your team probably isn't short of dashboards. It may be short of trustworthy signals.
A product manager sees conversion weakening, an engineering lead sees stable delivery metrics, and support notices a growing queue. Each team has data, but nobody can explain how the pieces connect or which intervention should happen first. By the time a quarterly KPI confirms that something is wrong, the process causing the problem may have been drifting for weeks.
Operational metrics close that gap. They show how work moves through the business, give teams a shared vocabulary for diagnosing performance, and create a feedback loop between measurement and action. The difficult part isn't finding more things to count. It's choosing measures that teams can influence, defining them consistently, instrumenting them reliably, and alerting the right person before a local problem becomes a company-wide result.
Table of Contents
- What Operational Metrics Actually Are
- The Five Categories of Operational Metrics
- Operational Metrics by Function
- How to Select and Align Operational Metrics
- Instrumentation, Reporting Cadence, and Alerting
- Common Pitfalls and How to Fix Them
- Next Steps for Building an Operational Metrics Program
What Operational Metrics Actually Are
A team reviews its monthly conversion KPI and finds that performance has declined. The report confirms the outcome, but it doesn't explain whether the problem came from slower page responses, a broken signup step, poor lead quality, delayed sales follow-up, or a change in customer behavior. The organization has a performance signal, but not an operational one.
Operational metrics provide that missing layer. They measure routine processes at a granular level, often over short horizons, so teams can see how work is progressing now. Examples include cycle time, throughput, defect rates, fulfillment time, response time, and conversion rates. Investopedia's definition of KPIs distinguishes operational KPIs, which teams may review day over day or month over month, from broader measures tied to long-term organizational performance.
Practical rule: If a metric changes but nobody knows what decision it should influence, it probably isn't ready for an operational dashboard.
The useful distinction is not “small metric versus big metric.” It's execution signal versus outcome measure. A KPI tells leadership whether an important objective is advancing. An operational metric helps the responsible team understand what is happening inside the process that produces that outcome. NetSuite describes operational metrics as snapshots of key processes used to assess efficiency, productivity, or quality (NetSuite's operational KPI guide).
The operating loop is straightforward:
- Measure the process at the point where work occurs.
- Detect deviation from an agreed baseline or service expectation.
- Intervene quickly with a named owner and a defined response.
- Verify the fix by checking whether the process returns to an acceptable state.
This is why operational measurement shouldn't be treated as a collection of charts. It turns raw activity into management signals. A broader business metrics definition can help teams separate descriptive measurements from the operational signals that support immediate decisions.
The Five Categories of Operational Metrics
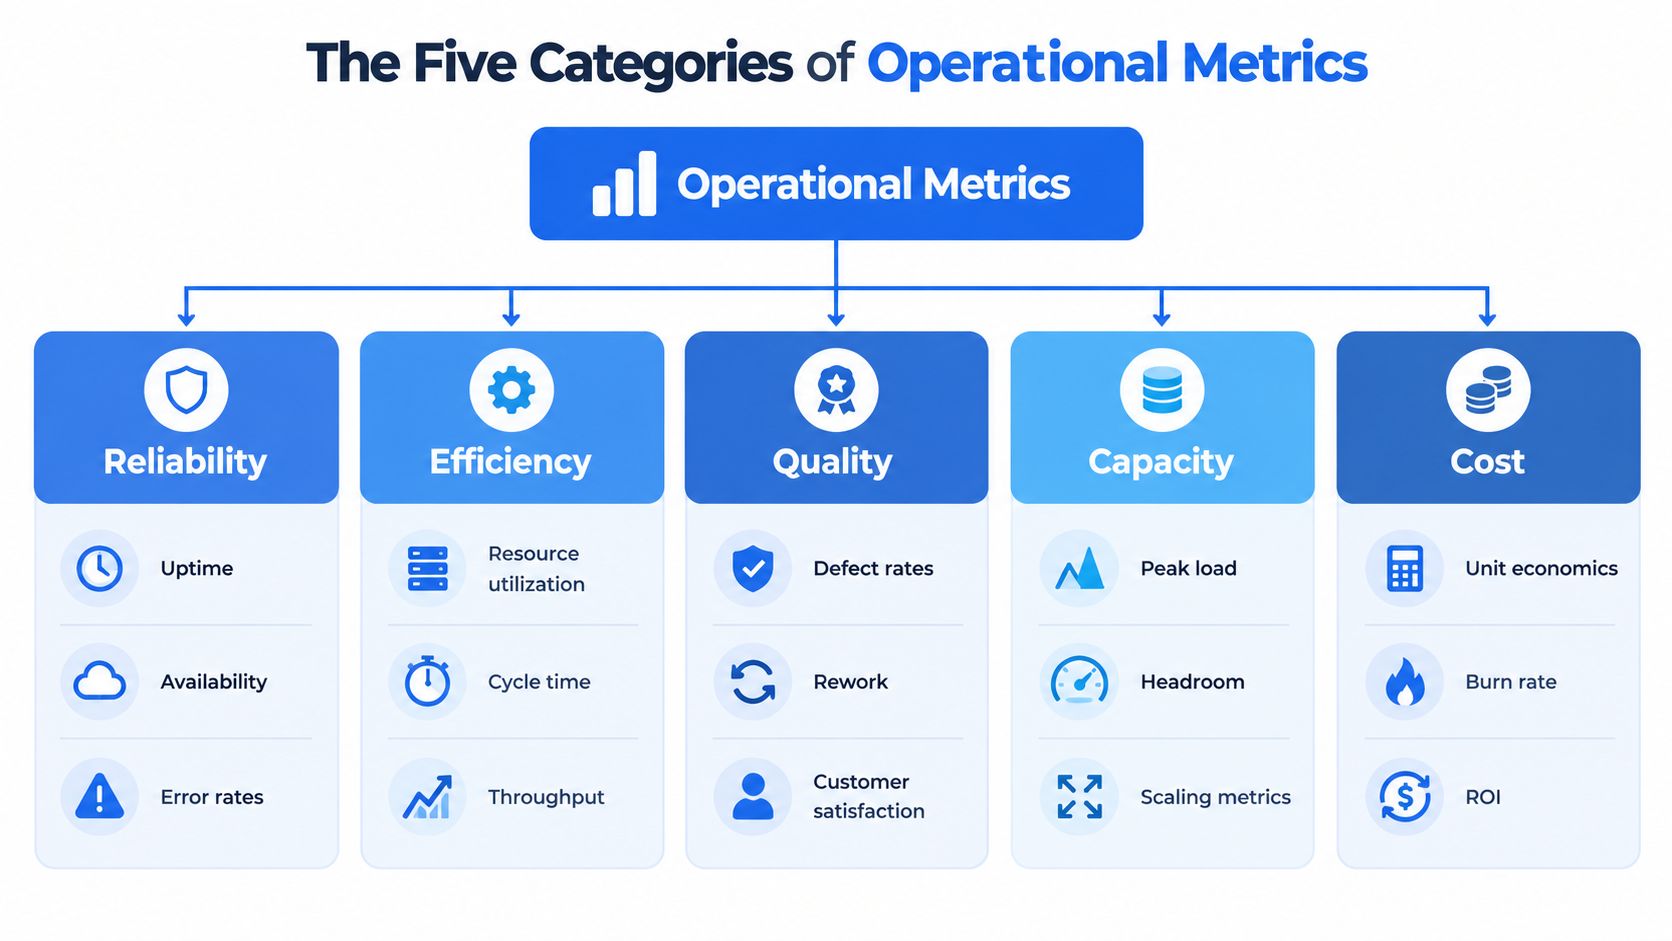
A dashboard that only shows speed is incomplete. Faster delivery can hide defects. High utilization can hide exhaustion. Strong throughput can conceal a capacity limit that will fail under the next demand spike. A practical taxonomy forces teams to inspect the system from more than one angle.
| Category | What it measures | Operational failure |
|---|---|---|
| Reliability | Availability, error behavior, and consistency | A service or process becomes unavailable or unpredictable |
| Efficiency | Resource use, cycle time, and throughput | Work takes too long or consumes unnecessary effort |
| Quality | Defects, rework, accuracy, and customer experience | Output requires correction or fails user expectations |
| Capacity | Load, headroom, and scaling readiness | A queue, team, or system approaches its limit |
| Performance | User-facing speed and process responsiveness | Customers or internal users wait too long |
Reliability answers whether a process can be depended on. For software, that may involve availability and error rates. For operations, it could mean whether orders, reconciliations, or handoffs complete without interruption.
Efficiency looks at the relationship between effort and output. Cycle time and throughput are useful together because either one alone can mislead. A team can increase throughput by pushing more work into a queue, while cycle time reveals that completion is slowing.
Quality protects the value of speed. Defect rates, rework, first-pass success, and customer feedback expose the cost of getting work wrong. If quality falls, an efficiency improvement may be false economy.
Capacity shows whether the system can absorb demand. Queue depth, workload, available headroom, and scaling behavior help leaders act before people or infrastructure become the bottleneck.
Performance captures responsiveness from the user's or operator's perspective. It may overlap with reliability and efficiency, but its focus is experienced speed, such as page response, support response, fulfillment, or transaction completion.
The categories aren't a license to add five charts to every dashboard. They are a coverage test. If a team tracks only throughput, ask what reveals failure, quality degradation, overload, and user impact. The operational metrics framework makes that balance visible.
Operational Metrics by Function
The same category produces different measurements depending on where work happens. Product teams care about user behavior and friction. Engineering teams care about system and delivery behavior. Support teams care about service flow. Operations teams care about moving work through physical or administrative processes.
| Function | Reliability | Efficiency | Quality | Capacity | Performance |
|---|---|---|---|---|---|
| Product | Availability of critical journeys | Time to activation | Feature error or abandonment behavior | Active usage load | Conversion rate and task completion |
| Engineering | Service availability and error rate | Cycle time and throughput | Change failure and defect behavior | Infrastructure or on-call load | Latency and recovery responsiveness |
| Support | Queue and channel continuity | Handle and resolution time | Reopen or escalation behavior | Queue volume and staffing headroom | First response and service-level performance |
| Operations | Process completion consistency | Fulfillment time and throughput | Order or process accuracy | Workload and capacity utilization | Delivery responsiveness |
A product team may use conversion rate as a performance measure, then investigate activation time as an efficiency signal and failed events as a quality signal. Engineering may monitor deployment flow, change failures, recovery behavior, and service response. Support needs a view that connects first response time to resolution quality, because reducing the first response delay won't help if more cases reopen.
Operations teams often expose the clearest process chain. Fulfillment time, throughput, accuracy, and available capacity describe whether work is moving, whether it is moving correctly, and whether the system can sustain demand.
Cross-functional overlap is deliberate. A slow product experience is both a product performance problem and an engineering reliability problem. A rising support queue may reflect staffing capacity, product quality, or an operational change upstream. Teams need ownership boundaries, but they also need shared definitions.
For a deeper treatment of process-level reporting, see this guide to analytics for operations. The important design choice is to keep each function's dashboard useful without allowing every team to invent a conflicting version of the same measure.
How to Select and Align Operational Metrics
A product team notices conversion falling, while engineering sees stable uptime. Support reports more reopened cases, and operations reports normal throughput. Each team may be correct within its own dashboard. The failure is a shared definition that connects the customer journey, technical events, and operational handoffs.
Start metric selection with a decision. If nobody can name the action that follows a change in the number, the metric is descriptive rather than operational.
Use four tests before adding a measure:
- Objective connection: Which business or process objective does it support?
- Actionability: Who can influence it, and what can they change?
- Measurability: Are the source events complete, timely, and consistently defined?
- Cross-team relevance: Does it connect to another team's process or define a shared handoff?
A metric is ready for publication only when its owner, calculation, grain, refresh expectation, and response are documented. “Conversion rate” is incomplete. Define the population, event sequence, time window, exclusions, and source of truth. Record those choices where product, engineering, and operations can review them together.

The alignment checklist
Before publishing a metric, ask:
- What decision does this metric support?
- Which team owns the process?
- Which upstream and downstream teams depend on it?
- What does a high or low value mean?
- What data-quality failure could make it misleading?
- What review cadence fits its response time?
- What threshold requires investigation rather than automatic escalation?
- Where is the metric definition recorded?
Alignment is an organizational problem, not only a dashboard problem. The KPI Institute reports that 25% of organizations struggle to align KPIs and targets across departments, while 24% struggle to select the right KPIs. A technically accurate dataset can still support a weak metric program if teams interpret measures differently.
The guide to measuring key performance indicators provides useful background. Add an operational response contract with the owner, trigger, investigation window, and expected action.
Use the following video to discuss how measurement connects to business goals. It does not replace your own metric definitions or data contracts.
Retire measures that do not change decisions. A smaller trusted set gives cross-functional teams a common operating language and leaves less room for selective reporting.
Instrumentation, Reporting Cadence, and Alerting
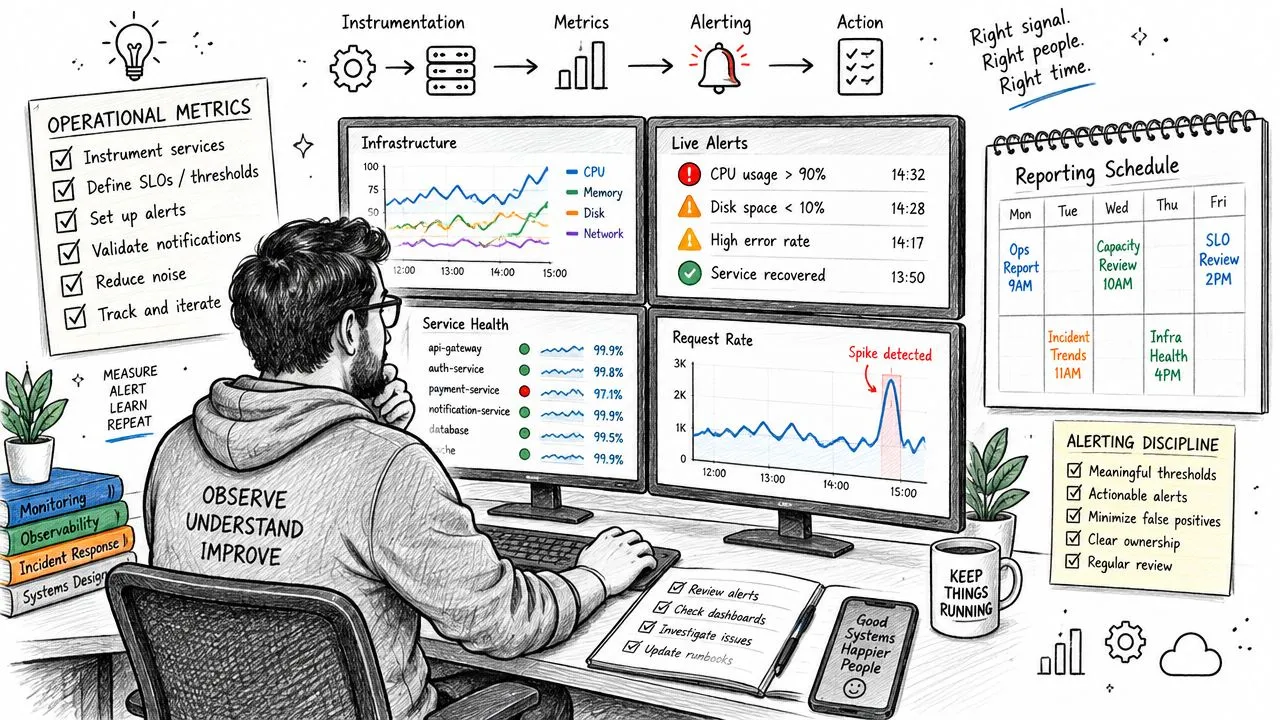
Reliable operational metrics start with reliable events. Instrument the process at meaningful state changes, such as request received, work started, work completed, defect identified, or case resolved. Store identifiers that allow the team to connect events across the lifecycle, and preserve timestamps in a consistent timezone.
Streaming data suits conditions that require immediate response, such as service errors or queue overload. Warehouse batches work well for measures that need joins, historical context, or reconciliation. The mistake is treating freshness as a virtue in every situation. A rapidly refreshed metric built from incomplete events is less useful than a slower metric with a known completeness guarantee.
Warehouse patterns that hold up
A warehouse model should separate raw events, reusable transformations, and published measures. The following examples use generic table and column names, so adapt them to your SQL dialect.
Throughput by day:
SELECT
  DATE(completed_at) AS completed_date,
  COUNT(*) AS completed_items
FROM work_items
WHERE status = 'completed'
GROUP BY 1
ORDER BY 1;
Defect rate by completed work:
SELECT
  DATE(completed_at) AS completed_date,
  SUM(CASE WHEN defect_flag THEN 1 ELSE 0 END) * 1.0
    / NULLIF(COUNT(*), 0) AS defect_rate
FROM work_items
WHERE status = 'completed'
GROUP BY 1
ORDER BY 1;
Average response time in minutes:
SELECT
  DATE(created_at) AS created_date,
  AVG(
    EXTRACT(EPOCH FROM (first_response_at - created_at)) / 60
  ) AS avg_response_minutes
FROM support_cases
WHERE first_response_at IS NOT NULL
GROUP BY 1
ORDER BY 1;
These queries are only useful when the underlying definitions are stable. Add tests for duplicate identifiers, missing completion timestamps, impossible event order, and unexpected null rates. A dashboard shouldn't interpret missing instrumentation as good performance without raising an alert.
Cadence and alert design
Review cadence should follow the speed of the decision. A reliability alert may need immediate routing. A process owner may review throughput during a daily operating rhythm. Leadership may use aggregated trends for strategic review.
Set thresholds from observed baselines and known operating limits, then include context in the alert: affected segment, recent comparison, owner, and runbook. Don't page people for every fluctuation. Require an escalation path and distinguish an informational notification from an incident-worthy breach.
For teams building reusable reporting layers, business intelligence reporting guidance can support the separation between operational monitoring and broader analysis.
Common Pitfalls and How to Fix Them
The most expensive measurement mistakes aren't usually mathematical. They come from tracking numbers that create the wrong behavior or hiding important dimensions behind a tidy dashboard.
Vanity metrics attract attention without changing a decision. Total signups, tickets received, or deployments may rise while activation, resolution quality, or customer outcomes deteriorate. Pair volume with a measure of completion, quality, or user impact, and assign an owner who can act.
Contradictory targets cause teams to optimize against each other. Support may reduce response time while engineering absorbs avoidable escalations. Product may increase adoption while operations lacks capacity to serve the resulting demand. Resolve this by mapping handoffs and documenting which measures are shared outcomes rather than isolated team targets.
Alert fatigue turns monitoring into background noise. If every threshold sends the same notification, people learn to ignore all of them. Route alerts according to severity, suppress duplicates, and attach a concrete next step.
Poor data quality creates false confidence. Late events, changed definitions, duplicate records, and missing identifiers can make a process appear healthier or worse than it is. Add freshness, completeness, uniqueness, and referential checks to the metric pipeline, not just the dashboard.
Governance gaps become visible when leaders ask why two teams report different values for the same process. Board.org found that 39% of data leaders struggle to demonstrate governance impact to leadership (Board.org coverage of data-leadership challenges). Treat definitions, ownership, lineage, and change history as operational assets.
The blind spot after release
Speed-focused frameworks can miss what happens once software reaches production. A recent DevOps analysis identifies mean time to detect, infrastructure cost per request, and on-call load per engineer as dimensions not measured by DORA, while broader infrastructure reporting is moving toward treating cost, performance, and sustainability as equal decision factors (DevOps metrics analysis).
The fix is to extend the scorecard. Include post-release detectability, operating cost, user-facing behavior, and team load where they affect the service or process. A delivery metric shouldn't be allowed to imply operational health by itself.
Next Steps for Building an Operational Metrics Program
Start with one process that crosses team boundaries. Choose a journey such as signup, order fulfillment, support resolution, or production incident handling. Map its states, owners, inputs, outputs, and handoffs before selecting measurements.
Build the first usable layer
Create a metric contract for each measure. Record its name, definition, grain, source tables, refresh expectation, owner, dashboard location, and response procedure. Include one quality check that would catch the most damaging failure mode.
Then publish a narrow operational view that combines the categories rather than presenting a single score. A product onboarding view might connect completion performance, error behavior, cycle time, and support demand. The point is not to create a universal dashboard. It's to give the people running the process enough context to choose an intervention.
Use review meetings to test whether the metrics work. Ask what decision the team made, which signal triggered it, whether the data was trusted, and what was missing. Retire measures that repeatedly fail this test.
Move from analyst dependency to self-service
Manual reporting creates a queue. Every new question becomes a request to an analyst, and analysts spend their time rebuilding variations of the same operational view instead of improving definitions, pipelines, and governance.
A warehouse-based notebook model changes that division of labor. Data teams can maintain governed datasets and reusable transformations, while technical and non-technical users explore approved data, run analyses, and build on existing work without requiring a separate BI handoff for every question.
Querio deploys AI coding agents and custom Python notebooks directly on a company's data warehouse, allowing users to query, analyze, and build on company data while data teams maintain self-service infrastructure. It can fit alongside existing warehouse and BI investments when the priority is flexible operational analysis rather than another static dashboard layer.
Expand only after the loop works
Once the first metric set supports real decisions, add another process or team. Standardize dimensions such as customer, region, product, queue, and time so cross-functional analysis remains possible. Add alerts only when ownership and escalation are clear.
The maturity test is practical: teams should know what changed, why it changed, who owns the response, and how they'll verify the result. If they can answer those questions without opening five disconnected systems, the program is doing its job.
Querio helps data teams turn warehouse data into reusable operational analysis through AI coding agents and custom Python notebooks, so technical and non-technical users can investigate metrics without waiting for manual analyst handoffs. Visit Querio to explore a self-serve approach to reliable operational measurement.