Business Intelligence
How to Stop Being the Data-Team Bottleneck
Cut analyst backlog by shifting repeat requests to governed self-serve, standardizing metrics, and using AI that runs inspectable SQL.

If your analysts spend up to half their time on ad hoc reporting, the fix is not hiring more people. It’s moving repeat questions into governed self-serve while keeping metric logic in one place.
I’d sum it up like this: audit repeat requests, standardize metrics, publish a small set of dashboards and notebooks, and use AI only for questions that run against inspectable SQL on live warehouse data. That helps cut delays, lower backlog, and keep analysts focused on work that needs judgment.
Here’s the article in plain English:
- Start with the request log. Review the last 90 days of Slack, Jira, and email asks.
- Find repeat work first. In many teams, 40%–50% of requests are the same metric checks again and again.
- Do not give raw data access to everyone. Self-serve without rules leads to number mismatches and spreadsheet sprawl.
- Build on the warehouse. Keep dashboards, notebooks, and AI answers tied to live data in Snowflake, BigQuery, Redshift, or Postgres.
- Define metrics once. Put things like MRR, churn, and active users in a shared metrics layer so every tool uses the same logic.
- Use AI with limits. AI should write SQL or Python against governed data, not make up math on its own.
- Measure the change. Aim for lower backlog, faster answers, a self-serve rate above 45%, and fewer metric disputes.
A few numbers make the problem clear:
- 76% of data experts spend up to half their time on ad hoc reporting
- 55% of business users wait 1–4 weeks for data
- 20% of leaders have made an important decision without the data they needed
- Teams that switch to governed self-serve can cut backlog by 60% and save 15–25 hours per week
The main point is simple: I shouldn’t treat analysts like a human SQL help desk. I should build a system where common questions answer themselves, and analysts step in when context, trade-offs, or messy data matter.
::: @figure 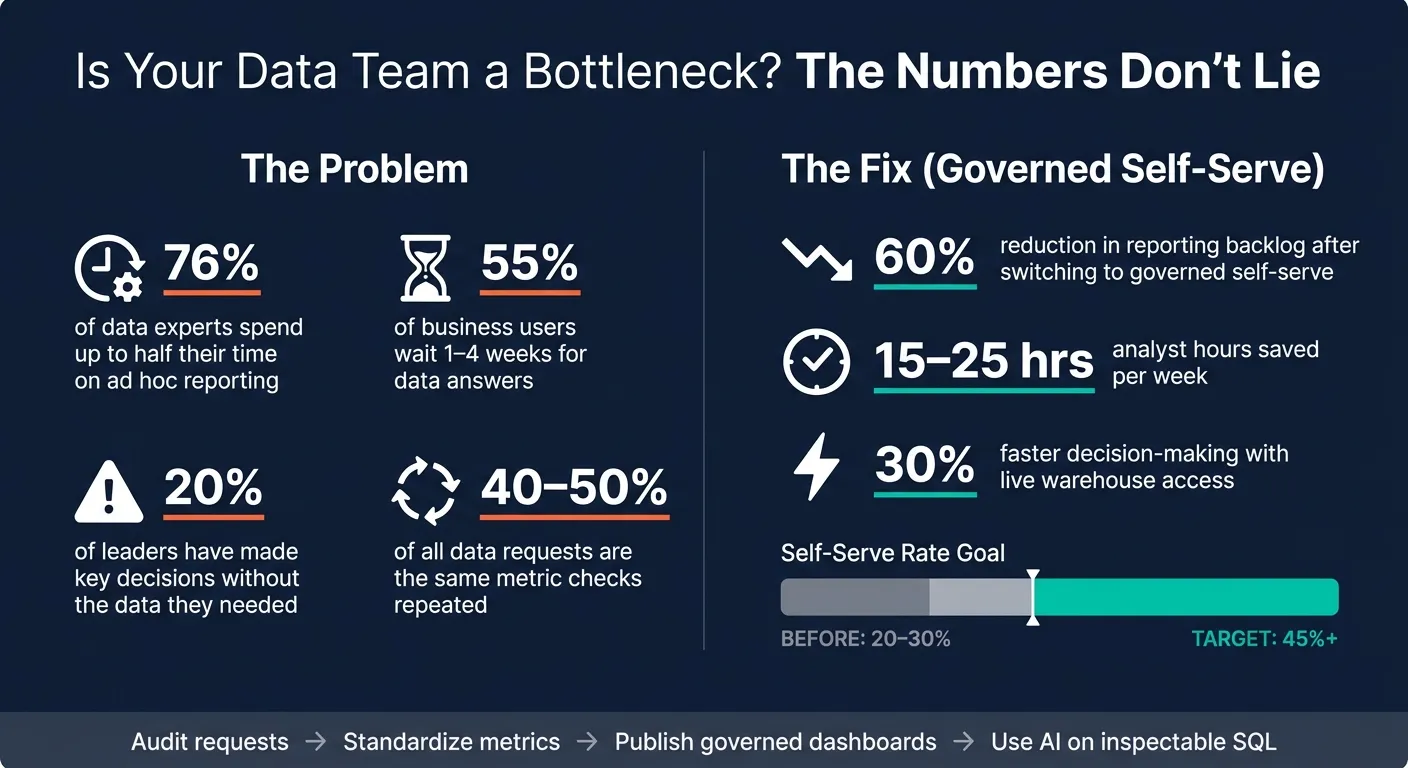 {Data Team Bottleneck: Key Stats & Self-Serve Impact}
:::
{Data Team Bottleneck: Key Stats & Self-Serve Impact}
:::
What every data leader needs to know about self-serve
::: @iframe https://www.youtube.com/embed/VX3zZcedme4 :::
Find the highest-friction requests before you change anything
This is where governed self-serve begins: find the questions that should live in reusable assets, not sit in the analyst queue. Before you build dashboards or reusable SQL models, figure out where analyst time is actually going.
Audit recurring requests by frequency, urgency, and complexity
Pull the last 90 days of requests from Slack, Jira, email, and any other intake channels. Track the requester, channel, timestamp, question, response time, back-and-forth, and analyst time. That inventory shows which requests should turn into dashboards, reusable models, or governed notebooks on top of the warehouse.
Then group similar requests by type, not exact wording. After that, rank them by how often they show up, how much time they take, and how urgently the business needs an answer.
A typical mid-market data team will find that 40–50% of requests are repeating metrics checks, another 20–30% are drill-downs, 15–20% are genuinely novel analysis, and the remaining 10–15% are data quality questions [3]. That first bucket - repeating metrics checks - is the place to start.
Over 60% of business questions take at least 1–3 days to answer [4]. In many cases, that’s long enough for the decision window to close before the data gets there.
Separate repeatable questions from analyst-led analysis
Move repeatable work out of the analyst queue. Don’t move everything.
A simple rule helps here: if the same question shows up every week in the same shape, it belongs in a dashboard or governed model. Think weekly MRR by segment, pipeline by owner, churn by cohort, or signups by source. These are stable, high-volume questions that need fast, consistent answers.
Save analyst time for work that calls for judgment: root-cause analysis, experiment readouts, pricing analysis, and any investigation where the data is messy or the question is still taking shape.
| Request type | Handling | Reason |
|---|---|---|
| Weekly MRR by segment, pipeline by owner, churn by cohort | Governed self-serve | Repeated, well-defined, high-volume |
| Signups by source, revenue by plan type | Governed self-serve | Simple lookup with stable logic |
| Root-cause analysis, experiment readouts | Analyst-led | Requires interpretation and shifting context |
| Pricing analysis, defining new business metrics | Analyst-led | Requires business judgment and expertise |
If a question repeats, standardize it. If it calls for judgment, keep it analyst-led.
Build governed self-serve on top of the warehouse
Once you spot which requests keep coming back, build a governed layer on top of the warehouse so those repeat questions can answer themselves - without metric drift. The fastest wins usually come from the questions people ask every single week.
Publish dashboards, reusable models, and notebooks for common decisions
Start with 5–8 role-based dashboards. Then support them with shared metric definitions and reusable models.
Use a shared metrics layer such as dbt Semantic Layer or LookML so business logic gets defined once and reused everywhere. Put definitions like MRR, churn, and active user criteria into dbt models or similar warehouse-native logic. That way, dashboards and notebooks all pull from the same source of truth.
For deeper analysis, interactive notebooks help a lot. Users can change inputs like date range or region without touching the code underneath.
The aim is simple: a governed layer of dashboards, notebooks, and AI answers built on the same shared models. When that layer is in place, response time shifts from a ticket queue to a shared decision system.
Ad hoc request fulfillment vs. governed self-serve: a side-by-side comparison
| Dimension | Ad hoc request fulfillment | Governed self-serve |
|---|---|---|
| Response time | 2–5 business days for routine requests | Minutes to same day for routine requests |
| Metric definitions | Recreated in each query or spreadsheet | Defined once and reused everywhere |
| Auditability | Hard to trace back to source logic | Tied to source SQL, data window, and formula |
| Stakeholder independence | Low - common questions still require tickets | High - common questions answered without analyst involvement |
| Analyst workload | Human SQL engine; request queue stays high | Strategic partner focused on modeling and analysis |
Organizations that switch to governed self-serve can cut reporting backlog by 60% and save 15–25 analyst hours per week [3]. That time can then move from repetitive reporting into analysis and modeling work that still calls for human judgment. But there’s a catch: it only works when everyone reads from the same live warehouse data.
Why live warehouse access matters for trust and speed
CSV exports and copied spreadsheets are where metric consistency starts to fall apart. Once data leaves the warehouse, teams begin applying different filters, date ranges, and assumptions. Before long, the same KPI shows up with different numbers in the exec meeting.
That’s not a people issue. It’s an architecture issue.
When dashboards, notebooks, and self-serve tools query live data directly in Snowflake, BigQuery, Redshift, or Postgres, there’s one version of the truth. Real-time warehouse access cuts decision-making time by an average of 30% [2]. If users can’t trace the math back to the warehouse, self-serve doesn’t fix the bottleneck - it just moves it.
Querio uses read-only warehouse connections and inspectable SQL, so answers stay tied to source logic without extracts or conflicting versions.
Standardize metric definitions and use AI carefully for repeatable questions
Define metrics once and reuse them across dashboards, SQL, notebooks, and AI queries
Once people can access live warehouse data, the next thing that breaks is usually metric logic. Fresh data solves the timing problem. It does not solve the consistency problem.
That’s where a shared semantic layer helps. It defines joins, metric logic, and business terms once in dbt-style models, then reuses those definitions across dashboards, notebooks, SQL, and AI queries.
Use business language instead of internal flags. Activated Account is much easier to read than pql_qualified_flag_v2 [2].
Querio's context layer lets data teams define joins, metric formulas, and business terminology once, then apply them the same way across ad hoc queries, notebooks, dashboards, and AI-generated answers. So when the definition of "active user" changes, you update it in one place.
Use AI query assistants for routine questions, not unchecked decision-making
Once metric definitions are standardized, AI can help with routine questions without changing the rules underneath. This is where AI query assistants shine: first-pass exploration, KPI lookups, segment breakdowns, and repeat business questions.
Say a revenue ops manager asks, "What was MRR for U.S. customers in Q1?" They shouldn't have to file a ticket and wait. An AI assistant can return that answer in seconds.
The problem starts when AI calculates the result itself instead of generating SQL against governed data. As Tadej Rola, System Architect at Databox, put it:
"Here is a dirty secret about most AI data tools: the LLM is doing the calculations. It reads your numbers, tries to compute averages, and hallucinations the results." [4]
The safer setup is simple: use AI to generate SQL, not to compute results. The assistant turns a plain-English question into inspectable, editable SQL or Python that runs against your live warehouse - Snowflake, BigQuery, Redshift, or Postgres - using governed metric definitions. That keeps routine questions fast without hiding the logic.
Querio follows this pattern. Every answer shows the underlying SQL or Python so users can inspect and edit it before acting on the result. No black box.
What to automate, self-serve, or keep analyst-led: a decision table
Use the audit results to route work based on risk and repeatability. Not every question should go through the same path. Put work in the right tier, and analysts can spend time on the problems that need judgment while teams still get fast answers.
| Task Category | Best Approach | B2B SaaS Example | Target Turnaround |
|---|---|---|---|
| Automate | Scheduled dashboards / alerts | Weekly revenue reporting, daily signup volume | Instant / scheduled |
| Self-serve | AI query assistant (governed) | "What was the MRR for U.S. customers in Q1?" | Same day |
| Collaborate | Reusable notebooks | Churn analysis, health checks | 1–2 business days |
| Analyst-led | Custom analysis / modeling | Forecasting, pricing experiments | Up to 5 business days |
Move repeat checks into the top two tiers. The harder, higher-stakes questions at the bottom of the table still need analyst judgment, with AI in a support role rather than the driver.
Roll out the changes and measure whether the bottleneck is shrinking
A 90-day implementation plan
Once governed self-serve is defined, roll it out in phases and track what changes. The order matters: define metrics first, then ship governed access, then expand self-serve.
| Phase | Timeline | Key Activities |
|---|---|---|
| Audit & Identify | Weeks 1–2 | Group the last 90 days of requests; rank the top 10 repeat questions |
| Metric Definitions | Weeks 2–4 | Build a data dictionary with calculation, source, and refresh cadence |
| Governed Layer | Weeks 3–6 | Implement a semantic layer in dbt, LookML, or Querio's context layer on Snowflake, BigQuery, Redshift, or Postgres |
| Reusable Assets | Weeks 4–8 | Publish 5–8 role-based dashboards and parameterized notebooks that query live warehouse data for recurring deep dives |
| Triage & AI Rollout | Weeks 6–8+ | Route requests by type; launch governed AI querying and notebooks for repeatable questions with inspectable SQL or Python |
This sequence keeps teams from doing things backward. If you push self-serve before metric definitions are locked down, you just spread confusion at scale.
Train analysts to send routine requests to the right dashboard link. For routine questions, the default path should be governed self-serve, not a new ticket.
Track progress with workload and decision-speed metrics
Capture a 2–4 week baseline before rollout so you have a clean before-and-after view. Use that baseline as the comparison point for every metric below.
After launch, check whether requests are actually leaving the queue. Focus on how fast decisions happen and how much analyst time gets freed up, not how many dashboards were published. Also track the share of routine questions answered through self-serve without a ticket, which is your deflection rate. Then watch how often self-serve or AI answers need analyst correction on first review, or first-pass answer accuracy.
Another good signal: informal Slack and email requests should start to drop. If people stop DMing analysts for the same things over and over, the new setup is starting to stick.
| Metric | Pre-Rollout Baseline | 90-Day Target |
|---|---|---|
| Average resolution time | Current turnaround (e.g., 3 days) | 50% reduction (e.g., 1.5 days) |
| Total backlog size | Current open ticket count | 30–50% reduction |
| Self-serve rate | Typically 20–30% | 45% or higher |
| Metric disputes | Current dispute frequency | Fewer than 2% of queries |
A decline in shadow spreadsheets is one of the clearest signs the governed layer is working [1].
Conclusion: move from request fulfillment to scalable decision support
The bottleneck is a systems problem, not a staffing problem. Repeated ad hoc work, slow handoffs, and inconsistent definitions keep data teams stuck in request fulfillment.
The way out is pretty direct: find the repeat work, standardize metric logic in the warehouse, give stakeholders governed access to live data in Snowflake, BigQuery, Redshift, or Postgres, and use AI only when the underlying SQL is inspectable and tied to shared definitions. Analysts should spend their time on work that calls for judgment - problem framing, metric redefinition, pricing experiments, and interpreting mixed signals.
"The analyst role... will shift from producing outputs to enabling systems." - Davorin Gabrovec, Founder and CPO, Databox [4]
That changes the data team’s job. Instead of answering every question by hand, the team designs the system that can answer common questions safely. The goal is scalable decision support, not faster tickets. When each answer traces back to live warehouse logic, the team stops acting like a ticket queue.
FAQs
::: faq
How do I know which requests should become self-serve first?
Prioritize requests that are routine, recurring, and time-consuming, like metric lookups, repeated data pulls, or simple filtering tasks.
Look back at the past month of requests and spot the questions that show up again and again. Those are often the best self-serve picks because they tend to be straightforward and don’t call for interpretation or complex modeling.
That matters for a simple reason: these requests can eat up analyst time fast, even when the work itself is pretty basic.
Querio’s governed semantic layer can standardize definitions, so users get consistent answers without needing analyst help each time. :::
::: faq
What should stay analyst-led instead of moving to AI or dashboards?
Analysts should focus on work that calls for human judgment, careful interpretation, and decision support tied to business goals.
That means things like experiment design, advanced modeling, messy data questions, and protecting semantic logic and data quality. AI tools and dashboards are a better fit for repetitive metric checks, recurring data pulls, and routine reporting. :::
::: faq
How can we enable self-serve without creating metric mismatches?
Use a governed semantic layer as the single source of truth for business logic. Define metrics like MRR, active users, and CAC once, so every query uses the same definition. That cuts down on inconsistent spreadsheets and shadow systems.
For self-serve analytics to stay consistent, keep core models and metric definitions in one place. Use inspectable SQL or Python so analysts can check how results are produced. And apply role-based access with read-only warehouse connections to keep data use controlled without getting in the way. :::