Business Intelligence
What self-serve analytics actually requires (and why most tools get it wrong)
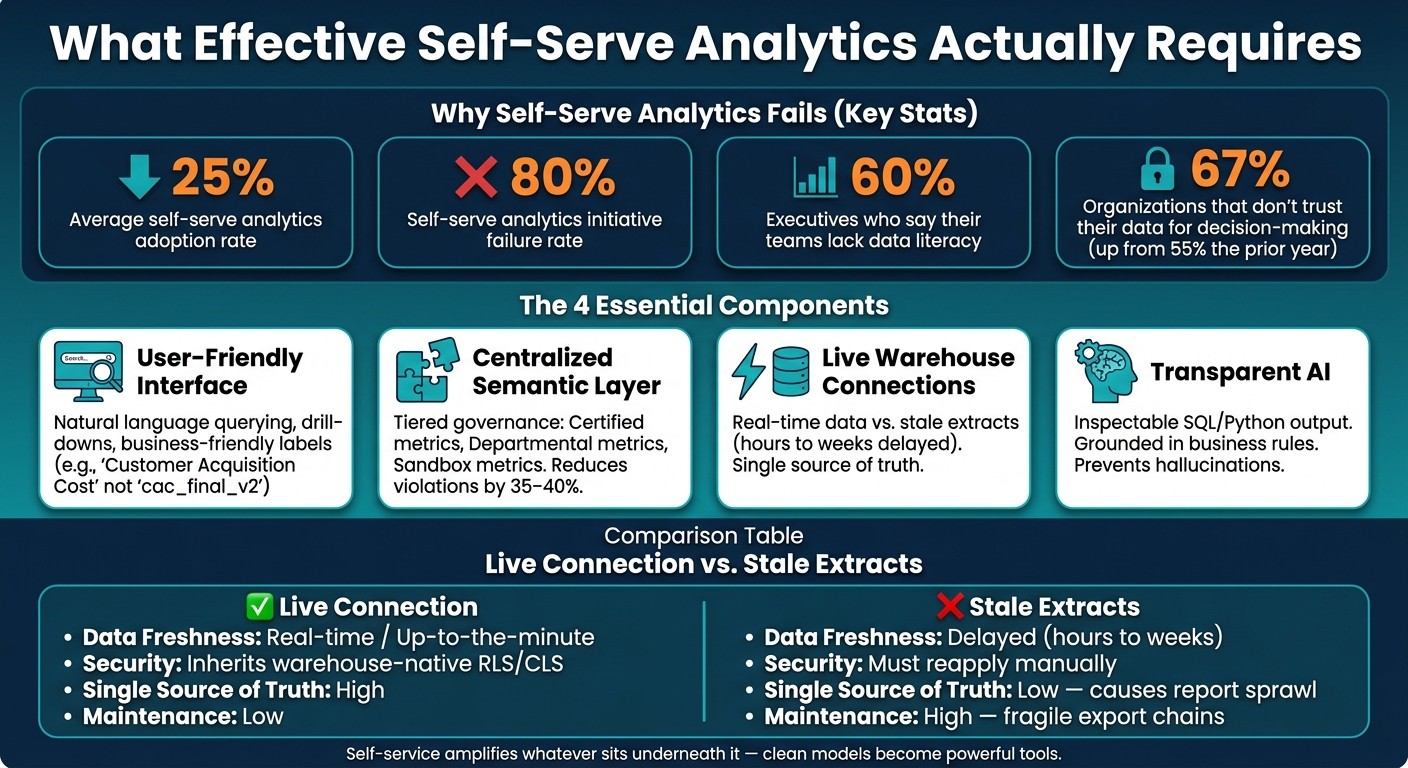
Self-serve analytics fails without a governed semantic layer, live warehouse connections, simple UIs, and transparent AI.
Self-serve analytics promises ease and independence in decision-making but often fails due to poor execution. Most tools overlook key elements, leading to low adoption rates (25%) and high failure rates (80%). Users abandon dashboards, mistrust data, and revert to manual processes.
Here’s why self-serve analytics struggles:
Complex tools overwhelm non-technical users.
Inconsistent metrics create confusion and mistrust.
Stale data undermines decision-making.
To succeed, self-serve analytics needs:
User-friendly interfaces tailored to business users.
Standardized metrics via a centralized semantic layer.
Live data connections for accuracy and trust.
Transparent AI grounded in clear business rules.
Without these, tools fail to deliver on their promise, leaving teams stuck in inefficiency.
The Inconvenient Truths of Self-Service Analytics - Tell Me Lies Tell Me Sweet Little Lies
Common Misconceptions About Self-Serve Analytics
Many organizations believe that implementing self-serve analytics is a simple task. However, misguided assumptions can derail these initiatives before they even begin. Let’s break down three common misconceptions that often undermine the success of self-serve analytics.
Self-Serve Is Not Just Drag-and-Drop Dashboards
A polished interface isn’t enough if it’s not backed by strong data practices. One of the biggest errors is viewing self-serve analytics as just a user interface issue: purchase a tool with a fancy drag-and-drop dashboard, give it to your team, and expect them to succeed. This approach mirrors the "Field of Dreams" fallacy: build it, and they will come.
The reality is that a functional self-serve system depends on three essential components beneath the surface:
A reliable data warehouse
Properly modeled and transformed data
A semantic layer that translates raw data into business-friendly terms like "revenue" or "active users"
Without these foundational elements, even the most intuitive tools will produce flawed results. Many vendors focus on selling the interface but leave the responsibility for these critical layers to the customer [2].
"The practitioner consensus is blunt: self-service analytics is a myth... the problem has never been the dashboard." - Definite [2]
More Dashboards Do Not Equal More Self-Service
Here’s a surprising truth: having too many dashboards can actually harm self-service efforts. Unchecked dashboard creation leads to report sprawl, which erodes trust. When multiple dashboards offer conflicting information, users struggle to find reliable answers. In many cases, it becomes easier to ask an analyst directly - defeating the entire purpose of self-serve analytics [1].
This overload also traps data teams in a "report factory" cycle, constantly creating new reports instead of focusing on deeper insights [6]. Ironically, investing in more dashboards often increases reliance on data teams rather than reducing it.
Similarly, relying solely on AI tools without proper governance only amplifies these issues.
AI Alone Cannot Replace Governance and Training
Adding AI to self-serve analytics might sound like a quick fix, but it’s far from it. When AI queries raw or unmodeled data, it often generates answers that sound convincing but are incorrect [1]. That’s because AI doesn’t understand your company’s specific rules - like excluding test accounts from revenue calculations or defining "active users" according to your unique criteria.
"Natural language interfaces translate questions into queries against a semantic layer - without it, AI generates plausible-sounding but incorrect answers." - Promethium [1]
On top of accuracy issues, there’s a bigger challenge: AI doesn’t teach analytical thinking. Without clear metrics and a foundation in data literacy, users might simply shift their doubts from dashboards to the AI’s responses. Research shows that 60% of AI initiatives fail - not because of the technology itself, but due to poor underlying data practices [4].
Self-serve analytics isn’t just about tools or technology; it’s about building a solid foundation, ensuring governance, and empowering users with the right skills. Without these, even the best tools will fall short.
Why Most Analytics Tools Fail at Self-Service
Many analytics tools promise self-service capabilities but fall short due to structural flaws. Instead of empowering business users, they often create more dependency on data teams. Let’s dive into three key reasons why these tools struggle to deliver true self-service analytics.
Interfaces That Are Too Complex for Business Users
One of the biggest hurdles is overly complicated interfaces. Many analytics tools are built with data professionals in mind, leaving business users - like marketing managers or sales leads - feeling lost. For anything beyond a basic, pre-built report, users often need SQL skills, which most lack. This creates a frustrating bottleneck.
Even tools that don’t require SQL can overwhelm users. The sheer complexity can feel like navigating a maze. In fact, 60% of executives admit their teams lack the data literacy to efficiently use these tools [7]. When users hit a dead end, they file tickets for analysts to create the needed reports. This cycle, often called "dashboard-serve", highlights how poor design shifts the burden back to data teams [5].
But even a user-friendly interface isn’t enough when inconsistent metrics and governance issues come into play.
Weak Governance and Inconsistent Metric Definitions
Another major issue is the lack of consistent metric definitions. Business users often encounter conflicting definitions for the same metric across different reports.
"Ask three people in any company what 'active customer' means and you will get four definitions." - Anton Melander, Ronja [3]
Without a centralized semantic layer to standardize metrics like "active users" or "monthly revenue", organizations end up with a chaotic mix of definitions. Over time, this inconsistency becomes a maintenance nightmare and a breeding ground for errors [9]. The result? Self-service analytics fails to deliver reliable insights, and 67% of organizations report they don’t trust their data for decision-making - a sharp increase from the previous year’s 55% [7].
"If your metrics aren't well-defined and modeled, more dashboards just mean more confusion." - Weld [8]
This lack of trust in data undermines the very purpose of self-service tools.
Reliance on Stale Data Extracts Instead of Live Warehouse Data
The third major flaw lies in how these tools handle data. Many don’t connect directly to live data warehouses. Instead, they rely on periodic snapshots or extracts - essentially static copies of the data. This means users might unknowingly base decisions on outdated information.
The problem becomes obvious when numbers don’t match. For example, a "current" figure in one report might differ from what a colleague sees in another. These inconsistencies erode trust in the tool. Once that trust is gone, users revert to spreadsheets and manual processes [1][11]. At that point, the tool is no longer seen as a reliable resource, and its promise of self-service analytics falls apart.
What Effective Self-Serve Analytics Actually Requires
Self-Serve Analytics: Live Connections vs. Stale Extracts vs. Key Failure Stats
To create a reliable self-serve analytics system, you need to align four essential components. If even one is overlooked, the system risks falling short.
Interfaces Built for Business Users
An intuitive self-serve interface should cater to users' needs and skill levels. Features like natural language querying, guided exploration with drill-down options, and clear, user-friendly labels are crucial. For instance, instead of displaying a field like cac_final_v2, a marketing manager should see "Customer Acquisition Cost." This reduces confusion and makes data easier to understand[13].
It's also important to recognize that users have varying needs. A CFO checking dashboards will require a different interface than a RevOps lead building them. Effective tools accommodate these differences, avoiding a one-size-fits-all approach. At the same time, a strong foundation for standardized and governed data is essential.
A Centralized Semantic Layer and Clear Governance
A centralized semantic layer ensures consistency across all analytics outputs. It standardizes metrics, so terms like "revenue" mean the same thing to everyone. Without this, trust in the data erodes.
Governance doesn’t have to be rigid. A tiered approach works well, with three levels:
Certified metrics: Board-ready and IT-reviewed.
Departmental metrics: Tailored to teams and reviewed by stewards.
Sandbox metrics: For personal exploration without formal oversight.
Organizations using this type of governance report a 35–40% drop in violations, highlighting its effectiveness[10].
Direct, Live Connections to Warehouse Data
Stale data extracts can undermine trust in analytics. By using live, direct connections to your data warehouse, you ensure data is always fresh and eliminate the risks associated with outdated extracts.
Here’s a quick comparison:
Feature | Live Connection | Stale Extracts |
|---|---|---|
Data Freshness | Real-time / Up-to-the-minute | Delayed (hours to weeks) |
Security | Inherits warehouse-native RLS/CLS | Must reapply security manually |
Single Source of Truth | High; data stays in the warehouse | Low; leads to report sprawl and inconsistencies |
Maintenance | Low; focus on modeling | High; requires fragile export chains |
Transparent, Inspectable AI
AI can simplify analytics, but only if users trust it. Transparency is key. Users need to understand how results are generated - what queries were run, which metrics were used, and how calculations were made. This is where a governed semantic layer plays a critical role, grounding AI in consistent business rules.
Without governance, AI tools may produce answers based on incomplete or incorrect assumptions, leading to costly inefficiencies. With AI agents capable of generating up to 20 queries for a single business question, an ungoverned system can quickly drive up data warehouse costs and deliver unreliable results[2][3].
"The best self-service environments do not remove the data team. They change its job from answering every question to building a system where good questions can be answered safely by many people." - Querio[14]
When these components work together, they form a dependable analytics environment that empowers users. A system missing even one of these elements cannot deliver a true self-service experience.
How Querio Addresses Self-Serve Analytics Problems
Querio is designed with four key capabilities - intuitive interfaces, a semantic layer, live warehouse access, and transparent AI - to tackle the common pitfalls of self-serve analytics. Each feature directly addresses a specific challenge, ensuring smoother and more reliable analytics experiences.
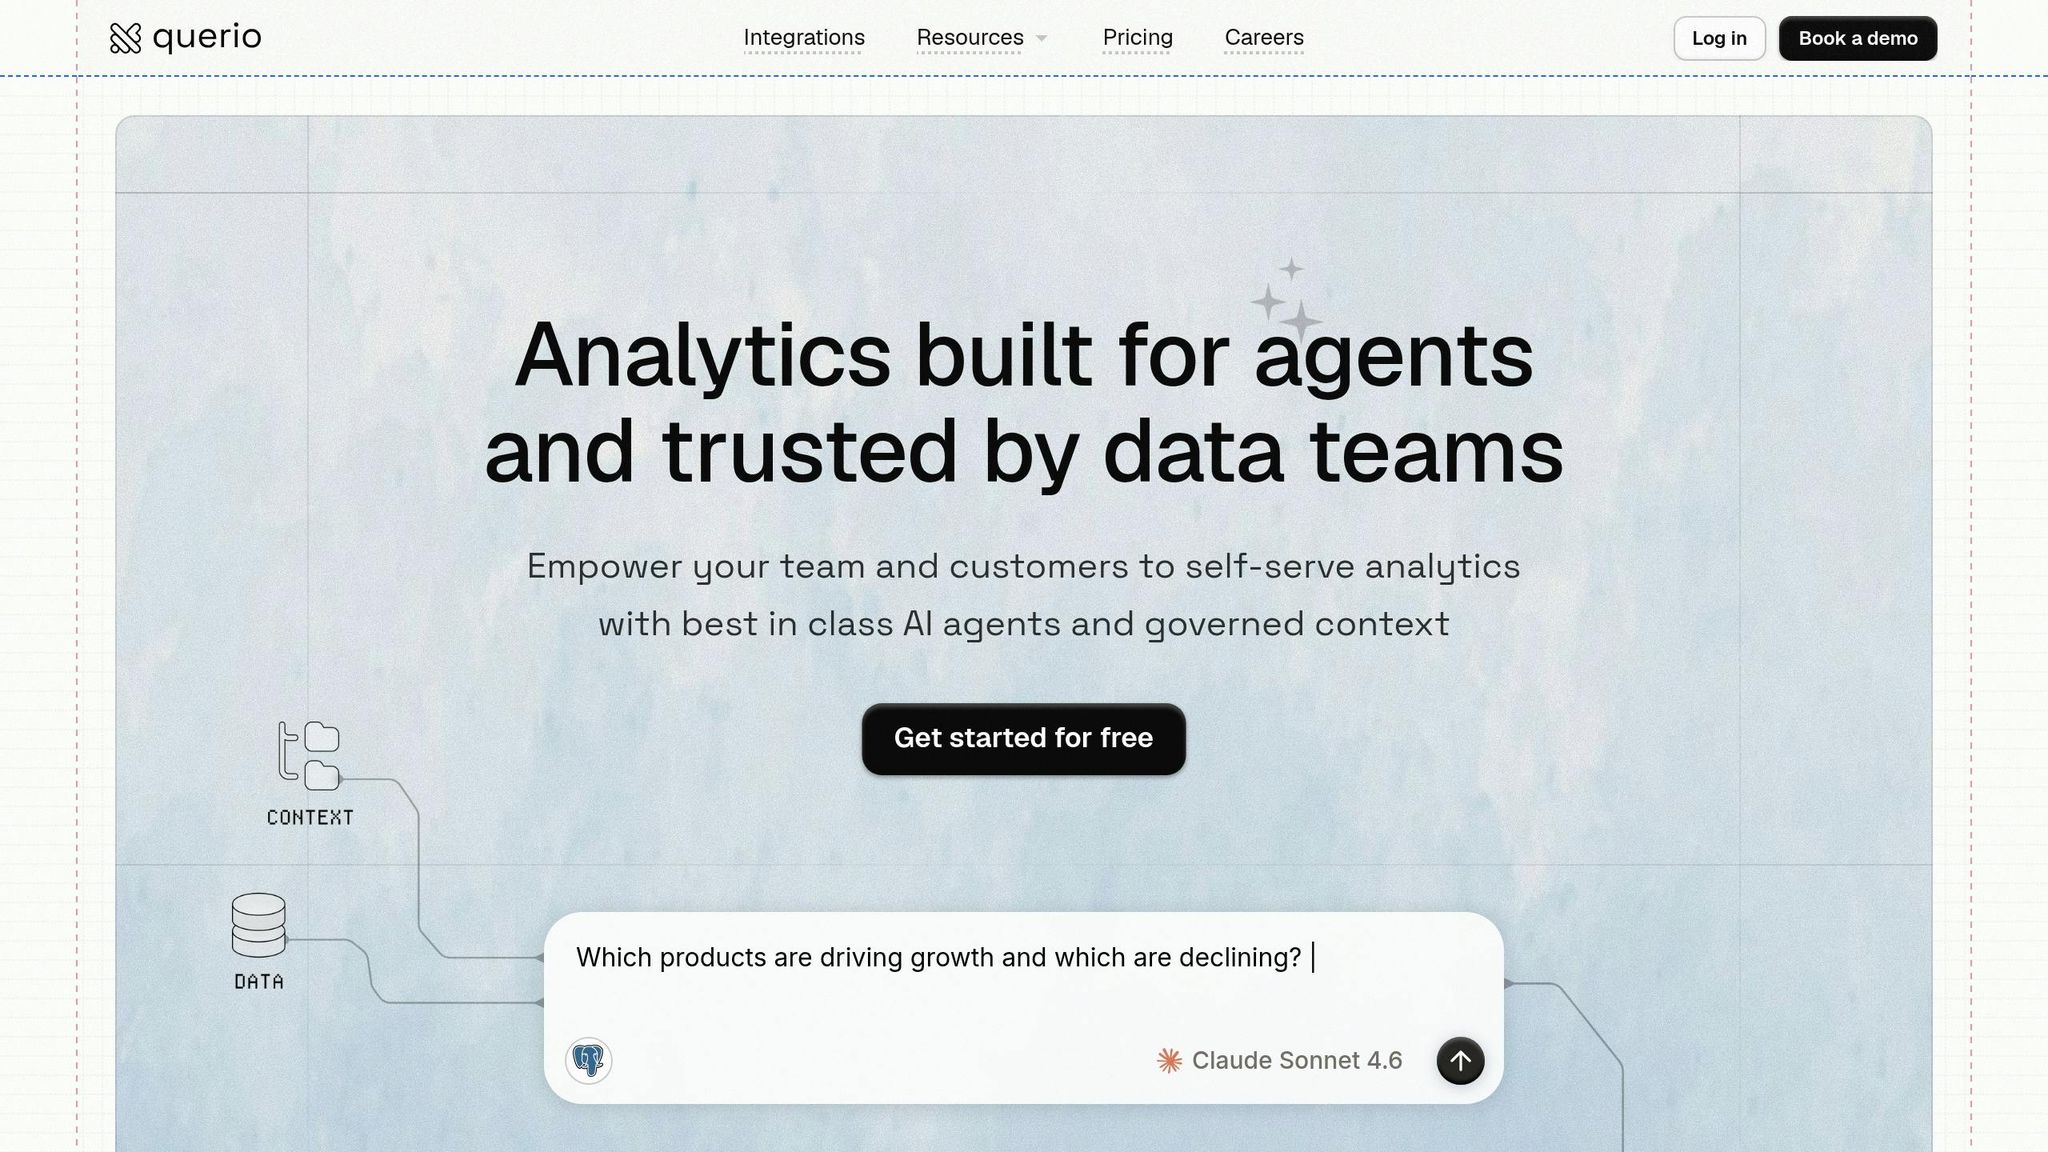
Turning Plain English Questions into Accurate Analytics
Querio uses AI agents to convert natural-language questions into precise SQL and Python queries. What's unique is that every answer includes fully inspectable SQL or Python code. This means users can easily check the query logic, see which metric definitions were applied, and understand how results were calculated.
Why does this matter? Many AI analytics tools act like black boxes, leaving users to trust results without explanation. For example, if a revenue operations manager asks, "What was our trial-to-paid conversion rate by acquisition channel last quarter?" they shouldn't have to accept an unexplained chart. Querio ensures transparency by showing the underlying query, allowing users to refine their questions and share results confidently - without needing help from the data team.
Feature | Basic Text-to-SQL | Querio (Context-Aware SQL) |
|---|---|---|
Logic Handling | Guesses joins based on raw schema | Uses predefined, verified business rules |
Consistency | Variable phrasing can alter results | Ensures identical results via semantic layer |
Accuracy | High risk of "hallucinations" | High accuracy via grounded business context |
Transparency | Often "black box" results | Full SQL/Python code is inspectable |
Keeping Metrics Consistent Through a Shared Semantic Layer
Querio's shared semantic layer is the backbone of its consistency. This layer houses all joins, metric definitions, and business logic, ensuring metrics are standardized right from the start. As a result, there are no delays caused by reconciliation or discrepancies. Whether users are running ad-hoc queries, creating dashboards, or generating AI-driven insights, the same definitions apply across the board. This makes Querio the central source of truth, eliminating reliance on individual reports or analysts.
But consistency isn’t enough without real-time data access.
Live, Read-Only Access to Your Data Warehouse
Querio connects directly to live data warehouses like Snowflake, BigQuery, Amazon Redshift, ClickHouse, and more, using encrypted, read-only credentials. [15] This setup ensures that your source systems remain untouched while delivering real-time, secure data. Whether a sales team needs to check same-day pipeline changes or an operations lead wants to monitor real-time fulfillment, Querio provides immediate insights without compromising data integrity.
Security and Access Controls Built for Growing Teams
Querio is built with security at its core. Its SOC 2 Type II compliant framework offers role-based access, row-level security, and SSO integrations. [15] This ensures that users only see data relevant to their roles. For instance, a regional sales rep can view data specific to their territory, while a finance lead can access company-wide figures - all without manual filtering or creating multiple report versions. SSO further simplifies the onboarding and offboarding process, making it easier to manage team access as businesses grow. These features together create a secure and scalable analytics solution tailored for modern teams.
Conclusion: What to Look for in a Self-Serve Analytics Tool
When it comes to self-serve analytics, the concept might sound straightforward, but the execution often proves tricky. Despite the self-service BI market growing at nearly 19% annually through 2026, only about one-third of companies report successful outcomes. Governance challenges often top the list of obstacles [14].
For self-serve analytics to work effectively, four key elements are essential:
User-friendly interface: Business users should be able to navigate the tool without needing formal training.
Centralized semantic layer: This ensures consistent metrics across the board.
Live warehouse connections: Stale data extracts simply won't cut it.
Transparent AI: Users need to see and understand how the AI reaches its conclusions.
"Self-service amplifies whatever sits underneath it. Clean models become powerful tools. Messy models become chaos with a friendly interface." - Querio [14]
Here's a practical way to test whether a tool meets these standards: Ask a non-technical manager to create a dashboard using live data within an hour, and without help from an analyst [12]. If they struggle to do so, the tool likely falls short of being genuinely self-serve.
Querio has been designed with these exact needs in mind. Its shared semantic layer, live warehouse connections, inspectable AI, and role-based access controls make it easier for teams to scale analytics while maintaining accuracy and trust. If your current tool is creating more confusion than clarity, it might be time to reassess your approach.
FAQs
What is a semantic layer?
A semantic layer acts as a bridge between complex technical data and business users. It simplifies technical jargon into business-friendly terms, standardizes metrics for consistency, and enforces governance. This allows non-technical users to access and analyze data confidently, without requiring advanced technical skills.
How do we standardize metrics across teams?
Standardizing metrics starts with establishing a centralized framework supported by clear data governance practices. This includes creating a shared business glossary to ensure everyone speaks the same language when it comes to key terms and concepts, as well as implementing role-based access controls to safeguard data accuracy and consistency.
A unified data architecture is also essential. By connecting real-time data sources, it eliminates discrepancies and ensures all teams are working with the same information. Add to this comprehensive documentation and team training, and you'll align everyone on how these metrics should be used and interpreted.
These steps not only streamline processes but also build trust across teams, enabling more reliable and consistent decision-making.
How can we prevent AI from giving wrong answers?
To minimize AI errors, focus on maintaining high-quality data, establishing clear and consistent definitions, and implementing strong governance practices. A centralized semantic layer and dependable data infrastructure can significantly enhance accuracy and reliability.
Additionally, align AI initiatives with a well-defined strategy, ensure scalable real-time connections, and set realistic expectations for outcomes. Regularly training users and treating AI as an assistive tool rather than a standalone solution can further reduce risks.
Ultimately, building a solid foundation and maintaining proactive oversight are essential steps to avoid inaccurate results and ensure AI delivers value effectively.
Related Blog Posts