Discover what is data literacy and why it powers modern teams
Discover what is data literacy and why it matters. Learn practical steps to build a data-driven culture that accelerates growth.
published
Outrank AI
data literacy, business intelligence, data driven culture, analytics for business, AI analytics
b7e7f086-867c-4d07-95ae-e0002e2aa962

Let's cut through the jargon. At its heart, data literacy is simply the ability to read, understand, question, and talk about data in a way that leads to better decisions.
Think of it like learning a new language—the language your business speaks. Instead of words, you use numbers, charts, and trends to tell a compelling story, moving from gut feelings to confident, evidence-based actions.
What Is Data Literacy in Simple Terms?

Being data-literate means recognizing that data isn’t just for analysts or engineers anymore. It’s a crucial skill for everyone, whether you’re in marketing, operations, finance, or the C-suite.
The old way of working—getting buried in messy spreadsheets or waiting days for a simple report—is over. A data-literate person can glance at a dashboard and see more than just numbers; they see the story behind the numbers. They know how to ask the right questions, poke holes in assumptions, and use data to build a rock-solid case for a new strategy.
More Than Just a Buzzword
Data literacy has become a popular term, but it’s not just talk. It’s a practical skill that solves real-world problems. It gives team members the power to find their own answers, spot emerging trends, and make the whole organization smarter and faster.
This shift is a must for any company that wants to stay competitive. In fact, one report from DataCamp found that 86% of business leaders see data literacy as essential for their teams' daily work.
Without it, you get stuck. When people can't access or make sense of data themselves, they lean on a small handful of specialists, creating bottlenecks that kill momentum and lead to missed opportunities.
Data literacy empowers your team to move at the speed of curiosity. It turns data from a guarded asset into a shared language everyone can speak to collaborate and build what's next.
To help break this down, data literacy can be viewed through four distinct pillars. Each one represents a core competency needed to truly "speak data."
The Four Pillars of Data Literacy
Pillar | Description | Key Question It Answers |
|---|---|---|
Understand | Recognizing what the data represents and where it comes from. This includes knowing basic concepts like metrics, dimensions, and sources. | What does this data actually mean? |
Read | Interpreting data visualizations like charts and graphs. This is about grasping the story the data is telling at a glance. | What trends or patterns are jumping out at me? |
Analyze | The ability to ask meaningful questions of the data, spot outliers, and form hypotheses based on the information presented. | Why is this happening, and what should we explore next? |
Communicate | Translating data insights into a clear, persuasive narrative for others, using visualizations and context to make a point. | How can I use this data to convince my team to act? |
Mastering these four areas is what separates a truly data-fluent team from one that just has access to dashboards.
The Foundation of a Data-Driven Culture
Ultimately, data literacy isn't just a skill; it's the bedrock of an informed business culture. It's about building an environment where asking "why" is encouraged and decisions are backed by proof, not just opinion.
This cultural shift doesn't happen overnight, but it doesn't always require hiring a whole new team. You can start by building these skills with the people you already have, a topic we dive into in our guide on building a data culture without hiring a data team.
The Four Core Skills of a Data Literate Professional

True data literacy isn’t some monolithic skill you either have or you don't. It’s actually a toolkit of four distinct but interconnected abilities. When you master them, you stop just looking at data and start using it as a strategic asset to drive real business outcomes.
Each skill builds on the last, creating a complete cycle of data-driven action. It's a journey from simply consuming information to actively using it to influence decisions. Let’s break down what that looks like.
Reading Data: The Ability to See the Story
First things first: you have to be able to read data. This is the foundational skill of looking at a chart, graph, or dashboard and immediately understanding what it’s telling you. It’s about translating visual information into concrete concepts.
Imagine a product manager staring at a line chart showing user engagement over the last 30 days. Someone who can read data doesn't just see a squiggly line. They see an upward trend hinting at growing adoption, a sudden nosedive that might signal a technical bug, or a plateau that suggests a feature has hit its peak audience. This initial interpretation is the gateway to any deeper analysis.
Without this, even the most beautifully designed dashboards are just colorful shapes on a screen.
Working with Data: The Skill of Asking Questions
Once you can read the data, the next logical step is working with it. This is all about interacting with the information to get closer to the answers you need. You don't need to be a coding wizard; it's about practical skills like filtering, sorting, and segmenting datasets to explore different angles.
Think about an operations manager looking at a report of late shipments. The top-level number shows an average delay of three days. By working with the data, they could:
Filter by a specific shipping carrier to see if one company is the main culprit.
Sort by destination to check for geographic bottlenecks.
Segment by product type to see if certain items are more prone to delays.
This hands-on exploration turns a broad metric into a focused investigation. It’s the ability to ask, "What if I look at it this way?" and having the tools to actually find out.
Data isn't static; it's a dynamic resource waiting to be explored. Working with data is the process of turning a passive report into an active conversation, where each question uncovers a new layer of insight.
Analyzing Data: The Search for "Why"
With the ability to read and work with data under your belt, you can move on to the third skill: analyzing data. This is where you connect the dots to find the trends, patterns, and anomalies—the "why" behind the "what." Analysis goes beyond simple observation to form hypotheses and draw initial conclusions.
For example, a marketing specialist might notice a recent campaign's click-through rate was 25% lower than projected. Analyzing the data could reveal that clicks from mobile devices were almost nonexistent. This insight leads to a hypothesis: the ad wasn't optimized for mobile viewing, creating a poor user experience.
This skill is what separates tactical reporting from strategic thinking. It’s the difference between saying "our sales are down" and saying "our sales are down in the Northeast for our premium product line, which probably has something to do with a competitor's recent price cut." For those looking to really hone their analytical skills, certified data analytics professional courses offer a structured way to master these techniques.
Communicating with Data: The Art of Persuasion
Finally, we arrive at the most crucial data literacy skill: communicating with data. Insights are completely useless if they stay locked away in a spreadsheet. This skill is the art of translating your findings into a clear, compelling story that persuades other people to take action.
This is so much more than just sharing a chart. It requires providing context, highlighting the key takeaway, and recommending a clear next step. A finance professional wouldn't just present a graph showing rising operational costs. They would frame the narrative: "Our cloud computing costs have jumped by 40% this quarter, mostly from unoptimized server usage. I recommend we implement a cost-monitoring protocol, which could save us an estimated $50,000 a year."
Effective communication turns data from an academic exercise into a catalyst for change. It’s a vital skill for anyone in a data-focused role; as our guide on what a data analyst does explains, storytelling with data is central to the entire profession.
How Data Literacy Becomes Your Competitive Advantage
Knowing the definition of data literacy is one thing, but seeing it drive real business results? That's where the magic happens. A data-literate workforce doesn't just make better-looking charts; it completely rewires how your company operates. Data stops being a dusty old resource and becomes your most powerful strategic asset.
This shift is what gives you a serious edge, letting you run circles around competitors who are still making decisions based on gut feelings and outdated assumptions.
The biggest win is faster, smarter decision-making. When your teams can confidently read, work with, and talk about data, the entire cycle from insight to action shrinks from weeks to hours. A product manager doesn't have to file a ticket and wait for an analyst; they can dig into a drop in user engagement and start sketching out a solution before lunch.
From Reactive Guesses to Proactive Strategy
Think about a typical company that isn’t data-literate. A manager sees sales are down and calls a meeting. The team spends the next hour debating theories based on hunches. "Maybe it's the new ad campaign," one person throws out. "I bet it's our competitor's latest discount," says another. They end the meeting by agreeing to "keep an eye on it," which really just means kicking the can down the road.
Now, imagine that same company after building a data-literate culture. The manager sees the same sales dip on their dashboard. In minutes, they drill down and see the drop is only happening with one product in a specific region. They pull in customer feedback data and instantly spot a spike in complaints about a new software bug.
Instead of a vague debate, the team has a data-backed hypothesis. The problem is identified, sent to the right engineers, and a fix is deployed. That’s the difference between reacting to problems and getting ahead of them.
A data-literate organization replaces "I think" with "the data shows." This simple change transforms conversations, eliminates ambiguity, and aligns the entire company around a single source of truth, building unstoppable momentum.
The Staggering Cost of Data Illiteracy
The flip side of this advantage is the massive risk of being left behind. Data illiteracy isn't just a skills gap—it's a huge financial liability. It slows everything down, leads to expensive mistakes, and opens the door for your nimbler competitors to steal market share.
The economic fallout is enormous. General low literacy costs the U.S. up to $2.2 trillion a year, and that number gets even scarier when you consider how data illiteracy cripples core functions like product, operations, and finance. It’s no wonder 79% of leaders are willing to pay more for data-savvy talent; they know exactly what's at stake. You can explore more of these findings on literacy's economic impact.
Ignoring the problem means you're bleeding money from hidden costs all over the business:
Wasted Hours: Teams burn countless hours wrestling with spreadsheets—pulling, cleaning, and formatting data—instead of doing high-value strategic work.
Missed Opportunities: Game-changing insights are left buried in databases simply because no one has the skills or the right tools to find them.
Poor Resource Allocation: Budgets get decided based on old habits and assumptions instead of real-time performance data, which means money gets wasted.
Ultimately, a lack of data literacy creates a culture of uncertainty where making a confident, forward-looking decision is nearly impossible.
Driving Innovation and Efficiency
Beyond just making better calls, data literacy is a powerful engine for innovation. It empowers every single person to become a scientist in their own role, constantly testing ideas and measuring what works.
A marketing team can run dozens of small A/B tests to fine-tune ad spend for maximum impact. An operations team can pinpoint and smooth out bottlenecks in the supply chain. And they can do it all without having to wait in line for the central data team.
When anyone in the organization can ask a question in plain English and get a trustworthy answer in seconds, you create a more curious, agile, and future-proof company. This frees up your expert analysts from routine reporting so they can tackle the truly complex, strategic challenges that move the needle.
Data Literacy in Action Across Your Business
Knowing the definition of data literacy is one thing, but seeing it work in the real world is where the magic happens. It’s not a uniform, cookie-cutter skill; it looks different depending on a team’s goals and daily grind. When people get it, data stops being an abstract concept and becomes a practical tool for solving real problems.
Let's look at how a solid data culture empowers four key areas of a business—executives, product, operations, and finance—and turns their everyday headaches into opportunities for smarter growth.
For Executives and Leadership Teams
An executive's job is to steer the ship, but you can't do that with last quarter's map. Leaders who lack data fluency often have to rely on stale, heavily filtered reports from their data teams. This forces them to be reactive. They might sense a shift in the market but lack the immediate data to confirm their gut feeling or pivot the strategy on a dime.
A data-literate CEO, on the other hand, can jump into a real-time dashboard and see what’s happening right now. They can track market trends, monitor KPIs, and drill down into regional sales figures—even in the middle of a board meeting. This empowers them to ask sharper, more incisive questions that get to the heart of the business's health.
Before: "Why are profits down this quarter? Someone get me a report by next week."
After: "I see our customer acquisition cost is up 15% in EMEA. Let's pull up the marketing spend breakdown for that segment right now."
This change is fundamental. It shifts leadership from making decisions based on old news to steering the company with up-to-the-minute insight.
For Product Managers and Teams
Product teams live and die by how well they understand their users. Without direct access to data, a product manager is basically flying blind. They might push a new feature live and then wait weeks for an analyst to pull an adoption report, all while precious time ticks by.
A data-literate PM takes charge. They can independently track how users are engaging with a feature, analyze funnels to spot where people are dropping off, and segment users to see how different groups behave. They can finally answer critical questions on their own, like, "Are new users from our latest campaign converting at a higher rate?"
When data literacy is embedded in the product function, you close the gap between launching features and understanding their impact. This creates a tight feedback loop that speeds up iteration and makes sure you're building what customers actually want.
This kind of autonomy is a game-changer. It gives teams the agility to make small, informed tweaks that lead to massive improvements in user experience and retention. To see more on this, check out our guide on empowering teams with self-service analytics.
For Operations and Logistics Teams
Operations is the backbone of any business, keeping things running smoothly, efficiently, and on budget. Traditionally, this involved a ton of manual spreadsheet work—tracking inventory, managing supply chains, and hunting for bottlenecks. It’s not just slow; it’s a recipe for human error.
When an operations team becomes data-literate, they graduate from manual tracking to automated monitoring. An ops manager can build a simple dashboard to watch shipping times in real-time or get an alert when a key component's inventory drops below a critical threshold.
Suddenly, they can ask proactive questions:
Which of our suppliers has the highest rate of delivery delays?
What time of day do fulfillment errors in the warehouse peak?
Is there a link between a specific shipping route and damaged goods?
This proactive stance helps them spot inefficiencies before they become expensive disasters, ultimately saving the company serious money.
For Finance and FP&A Teams
Finance is naturally a data-heavy department, but teams often get bogged down in the manual grind of closing the books, pulling numbers for board decks, and wrangling complex models in Excel. This leaves precious little time for the high-value strategic work that actually moves the business forward.
A data-literate finance team automates the mundane. By connecting directly to different data sources, they can create financial statements and forecast models that update themselves. This frees up the FP&A (Financial Planning & Analysis) team to dig into bigger, more strategic questions. Instead of just reporting what the numbers are, they can explore why.
For instance, a data-savvy financial analyst can quickly cross-reference sales data with marketing spend to calculate a precise ROI for each campaign. This transforms finance from a reactive reporting function into a strategic partner that helps the whole organization make smarter financial decisions.
Data Literacy Needs by Business Function
While everyone benefits from being data-literate, the specific skills and priorities differ from one department to the next. An executive needs a high-level overview, while a product manager needs to get into the weeds of user behavior.
Here’s a quick look at how data needs and tools adapt across different roles.
Team/Role | Primary Data Goal | Key Data Literacy Skill | Example Querio Use Case |
|---|---|---|---|
Executives | Monitor overall business health and strategic direction. | KPI interpretation and trend analysis. | Viewing a real-time executive dashboard to track revenue, growth, and market share. |
Product | Understand user behavior to improve the product. | Funnel analysis and user segmentation. | Asking, "Show me the conversion rate for users who engaged with our new feature." |
Finance/FP&A | Drive financial strategy and ensure accuracy. | Financial modeling and variance analysis. | Automating monthly P&L reports and forecasting revenue based on current sales data. |
Operations | Optimize processes and reduce costs. | Bottleneck identification and supply chain analysis. | Creating an alert for when inventory for a specific product drops below a set threshold. |
Ultimately, a truly data-literate organization isn't just one where analysts know SQL. It's one where every team is empowered to use data to answer its own questions, making the entire business faster, smarter, and more competitive.
A Practical Framework for Building a Data Literate Team
Turning your company into a place where data drives decisions doesn’t just happen. It takes a real plan—a framework that moves your team from good intentions to actual execution. This isn't about a one-off workshop; it’s about a deep cultural shift where data becomes the common language everyone speaks.
That shift has to start at the very top. Getting genuine buy-in from leadership is the first, non-negotiable step. When executives champion data literacy, they send a clear signal that it’s a priority and unlock the resources to make it happen. Effective leadership training to build high-performing teams is a great way to get the C-suite aligned and ready to lead the charge.
With your leaders on board, it's time to figure out where you’re starting from. You can't draw a map to your destination if you don't know where you are right now.
Assess Your Team's Current Skill Levels
Before you can build up new skills, you have to get an honest look at where your team is today. This isn't about putting individuals on the spot. It's about understanding the collective strengths and gaps across the entire organization. Can people read a simple bar chart? Do they know what follow-up questions to ask when they see a dashboard?
A simple survey or a few informal group discussions can be incredibly revealing. You might find that your sales team knows their pipeline reports inside and out but has no idea how that data connects to marketing campaigns. Or maybe the ops team has incredible domain expertise but no tools to analyze process bottlenecks on their own.
This assessment gives you a clear roadmap. It helps you tailor training to what people actually need, rather than rolling out a generic program that misses the mark.
This diagram shows how a solid data framework connects different parts of the business, from high-level executive strategy all the way down to day-to-day operations.
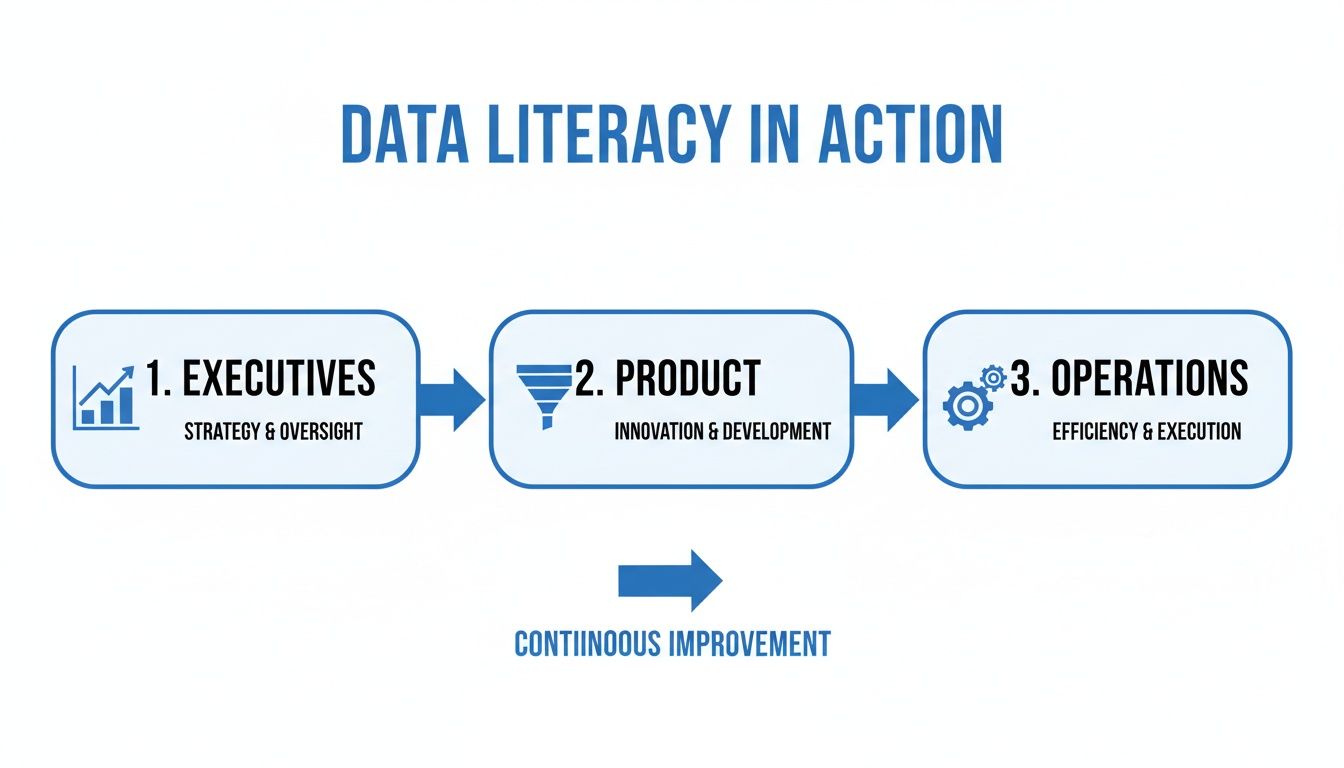
As you can see, a unified data strategy allows executives, product managers, and operations teams to work in a continuous feedback loop of insight and action.
Provide Accessible Tools and a Shared Vocabulary
Once you know where the skill gaps are, the next move is to make data easy to work with. If people have to write complex SQL or fight with clunky, old software just to get a simple answer, your data literacy program is dead on arrival. The goal is to make curiosity as frictionless as possible.
This is where modern self-serve analytics platforms are a game-changer. They let non-technical people ask questions in plain English and get reliable answers back in seconds. This kind of accessibility is the engine of a data-literate culture; it turns data from a protected asset into a company-wide utility.
Just as important as the tools is a shared data vocabulary. You need to create a single source of truth for your most important metrics.
What exactly do we mean by an "active user"?
How are we defining "customer churn"?
Is "revenue" calculated before or after we account for refunds?
When everyone agrees on the definitions, you get rid of the constant confusion and arguments that happen when different teams are using the same words to mean different things. This alignment builds trust and makes sure everyone is on the same page.
Foster Curiosity and Celebrate Early Wins
The final, and arguably most important, piece is the cultural one. You have to build an environment where asking questions with data isn't just okay—it's expected. A great way to do this is for leaders to constantly model the behavior, asking "What does the data say about this?" in every meeting.
This whole process is a marathon, not a sprint. To keep people engaged, you need to start small and celebrate the early wins.
Don't try to boil the ocean. Find a small, high-impact problem that a data-driven approach can solve quickly. When one team uses data to boost efficiency by 10% or uncovers a new sales opportunity, shout it from the rooftops. Success is contagious, and it creates the momentum you need to make the change stick.
How AI Is Fast-Tracking Data Literacy
Getting an entire team comfortable with data used to be a long, uphill battle. It meant heavy training investments and getting everyone up to speed on specialized tools. But now, artificial intelligence is completely changing the game. AI is acting as a powerful catalyst, flattening the learning curve and making sophisticated data analysis accessible to pretty much everyone.
Modern BI platforms powered by AI are demolishing the biggest historical roadblock to data access: the need to learn complex query languages like SQL. Instead of forcing people to think like a database, these tools let them ask questions in plain, conversational English.
This is a massive shift. When a product manager can just type, "What was our user retention rate last month for customers in North America?" and get an instant, reliable answer, everything changes. The friction that once existed between a good question and a clear insight simply melts away.
From Gatekeepers to Enablers
Not long ago, data teams were the gatekeepers. They were stuck managing a long line of report requests from every corner of the company, which created huge bottlenecks and slowed down decision-making. AI-powered, self-serve analytics tools flip this model on its head, turning data specialists from ticket-takers into strategic partners.
When business users can find their own answers, platforms like Querio free up analysts to tackle the deeper, more complex problems that really drive the business forward. This isn’t just about getting answers faster; it’s about teaching people how to think with data. Every question they ask and answer on their own builds their analytical muscle, creating a virtuous cycle of learning and discovery.
AI makes data exploration a company-wide activity, turning every employee into a capable analyst. It builds a culture of curiosity, where data is no longer a static report to be read but a living resource to be questioned and explored.
This hands-on, learn-by-doing approach is far more effective than any classroom training. It weaves data directly into a person's daily routine, making it a natural part of how they solve problems.
Embedded Analytics and the "Final Mile"
Another huge way AI is pushing data literacy forward is through embedded analytics. This is all about bringing data insights directly into the software and apps people use every day. Instead of forcing someone to log into a separate dashboard, the relevant charts and metrics show up right where decisions are actually being made.
A sales leader, for instance, can see real-time pipeline analytics right inside their CRM. An operations manager can monitor logistics KPIs without ever leaving their supply chain management software. This seamless integration makes data an ever-present, almost ambient guide.
This "final mile" approach delivers on several key goals:
Reduces Context Switching: Users get the insights they need without toggling between different applications, which keeps them focused and efficient.
Boosts Adoption: By putting data right where it’s most relevant, it naturally encourages people to use it and build data-driven habits.
Ensures Governance: Modern embedded platforms come with security and governance built-in, so users only see the data they're authorized to see, keeping everything compliant.
By knocking down the technical and workflow barriers, AI-driven tools are finally making the dream of a truly data-literate organization a practical reality for companies of any size.
Common Questions About Data Literacy
As teams start to get serious about data, a few key questions always seem to pop up. Let's tackle them head-on to clear up any confusion and map out a practical path forward for building a more data-savvy organization.
Does Everyone Need to Be a Data Scientist?
Not at all. This is probably the biggest misconception out there. The goal of data literacy isn’t to turn every employee into a PhD-level statistician.
It’s about giving people the confidence to read, question, and use data in their day-to-day roles. A product manager doesn't need to build a machine learning model; they just need to comfortably analyze a user funnel to figure out where people are dropping off. We're aiming for practical competence, not deep technical mastery.
Data Literacy vs. Data Science
What’s the real difference here? It helps to think about it like reading and writing.
Data Literacy is the ability to read data. It's about consuming and understanding information to make better decisions every day.
Data Science is the ability to write with data in complex ways. It's a deep, specialized field focused on building new models and algorithms to unlock insights from huge datasets.
Everyone in your company needs to be able to read, but only a small, specialized group needs to be professional authors.
The core difference comes down to scale and application. Data literacy is about applying data to your immediate work. Data science is about building the advanced tools and models that push the boundaries of what’s possible with that data.
How Do You Measure the ROI of a Data Literacy Program?
This is a great question. While you might not be able to draw a straight line from a training session to a specific revenue figure, the return on investment shows up clearly in your business performance.
You'll see it in a few key areas:
Faster, Smarter Decisions: How long does it take for a team to go from asking a question to taking action? When people can find their own answers, this cycle shortens dramatically.
Less Strain on Your Data Team: A huge win is a drop in the number of ad-hoc report requests flooding your analysts. This frees them up for more strategic work.
Better KPI Performance: You can often connect training initiatives to direct improvements in team-specific metrics, whether that's higher conversion rates for marketing or better efficiency for operations.
What’s the First Step for a Small Business?
If you're a small business, don't try to boil the ocean. Forget about a massive, formal training program right out of the gate.
The best first step is to focus on access and impact. Pick one important business question that multiple people are asking. Then, give them an easy-to-use, self-serve tool to find the answer themselves. Start small, show the value, and build from there.
Empower your entire organization to move beyond guesswork. Querio gives every team the ability to ask questions in plain English and get trusted answers from your data in seconds. Explore Querio today and make data-driven decisions your new normal.

