Business Intelligence
How operations teams at SMEs use AI to replace manual weekly reporting
See how SMEs cut weekly reporting time, reduce errors, and gain predictive insights by automating reports with AI.
Small and medium-sized businesses (SMEs) are saving hours every week by automating reporting with AI. Instead of spending up to 15 hours compiling data manually, AI tools integrate with platforms like CRMs, finance systems, and project management apps to generate accurate, real-time reports. These reports not only save time but also reduce errors and provide actionable insights.
Key takeaways:
Time saved: AI eliminates manual data pulls, formatting, and narrative writing, cutting weekly reporting time to near zero.
Cost reduction: AI-driven reporting reduces errors, saving businesses thousands annually in remediation costs.
Better decisions: Real-time updates and predictive analytics help spot trends and prevent issues before they escalate.
For example, an e-commerce brand saved 27.5 hours weekly by automating reports across 12 data sources, while a retailer used AI to flag inventory issues that manual checks missed. Tools like Querio simplify this process by connecting directly to data warehouses and delivering polished reports on schedule.
If your team is stuck in spreadsheets every week, it's time to let AI handle the heavy lifting.
Data Sources That Feed AI-Driven Weekly Reports
The Systems That Power Weekly Reports
AI thrives on diverse data inputs to create meaningful reports. For small and medium-sized enterprise (SME) operations teams, this typically involves pulling information from various platforms across sales, marketing, finance, and operations - each often operating in its own silo.
System Category | Common SME Platforms | Key Data Points |
|---|---|---|
CRM | Win rates, deal velocity, pipeline stages, sales rep activity | |
Marketing | Ad spend, ROAS, email open rates, conversion attribution | |
Finance | Cash position, COGS, overheads, margin estimates | |
Operations | Shopify, 3PL dashboards, POS | Inventory levels, shipping times, refund rates, SKU velocity |
Project Management | Task completion, project milestones, team bottlenecks |
A great example of this in action comes from March 2026, when Alice Robert, founder of e-commerce brand The Littl, integrated 12 different data sources - including Shopify, Meta Ads, Xero, and Klaviyo - into a unified AI operating system. This setup automated daily revenue tracking against ad spend and fulfillment costs, saving 27.5 hours of manual reporting time each week and freeing up 10 hours of virtual assistant time previously spent on data entry tasks [6].
While connecting these systems is a vital first step, the real challenge lies in ensuring the data itself is accurate and ready for AI to process.
Getting Your Data Ready for AI Workflows
Hooking up your tools is only half the solution. A whopping 73% of SMEs wrestle with siloed data because they rely on five or more disconnected applications [8]. The problem? AI can't magically fix bad data - it simply amplifies any errors already present. For instance, if your CRM is riddled with duplicate records or your finance system uses mismatched naming conventions compared to your operations platform, those inconsistencies will bleed into every AI-generated report.
The first step to tackling this issue is a thorough data audit. With 62% of companies reporting data quality challenges during initial AI implementation, it's clear that early action is crucial [1]. This audit should flag missing fields, inconsistent formats, and duplicate entries. Once cleaned and standardized, AI tools can take over the ongoing maintenance, cutting the time spent on manual data preparation by up to 40% [1].
"The gap between AI ambition and AI execution in European SMEs is not a technology problem. It is a data, skills, and strategy problem." - Done.lu [9]
One actionable tip: make sure your team agrees on how to define key metrics before automation begins. For example, terms like "qualified lead" or "pipeline stage" should mean the same thing to everyone across departments. Without this alignment, AI might produce reports that are interpreted differently by each team - undermining the entire effort [7].
How to Generate Weekly Business Insights Reports Using AI Agent
How AI Replaces Manual Reporting Step by Step
Manual vs AI-Powered Weekly Reporting: Time & Cost Savings for SMEs
How AI Generates Reports Automatically
Once your data is connected and cleaned, AI takes over and generates reports without any manual effort. By using APIs, AI pulls data directly from your systems, integrates it into reports on a set schedule, and eliminates the need to automate Excel reporting and manual exports entirely [2].
But AI doesn't stop at just collecting and presenting numbers. It calculates KPIs and provides narrative insights, explaining why metrics shifted instead of merely stating what changed. As Ibby Syed, Founder of Cotera, aptly says:
"Raw metrics without narrative lack actionable insight." [3]
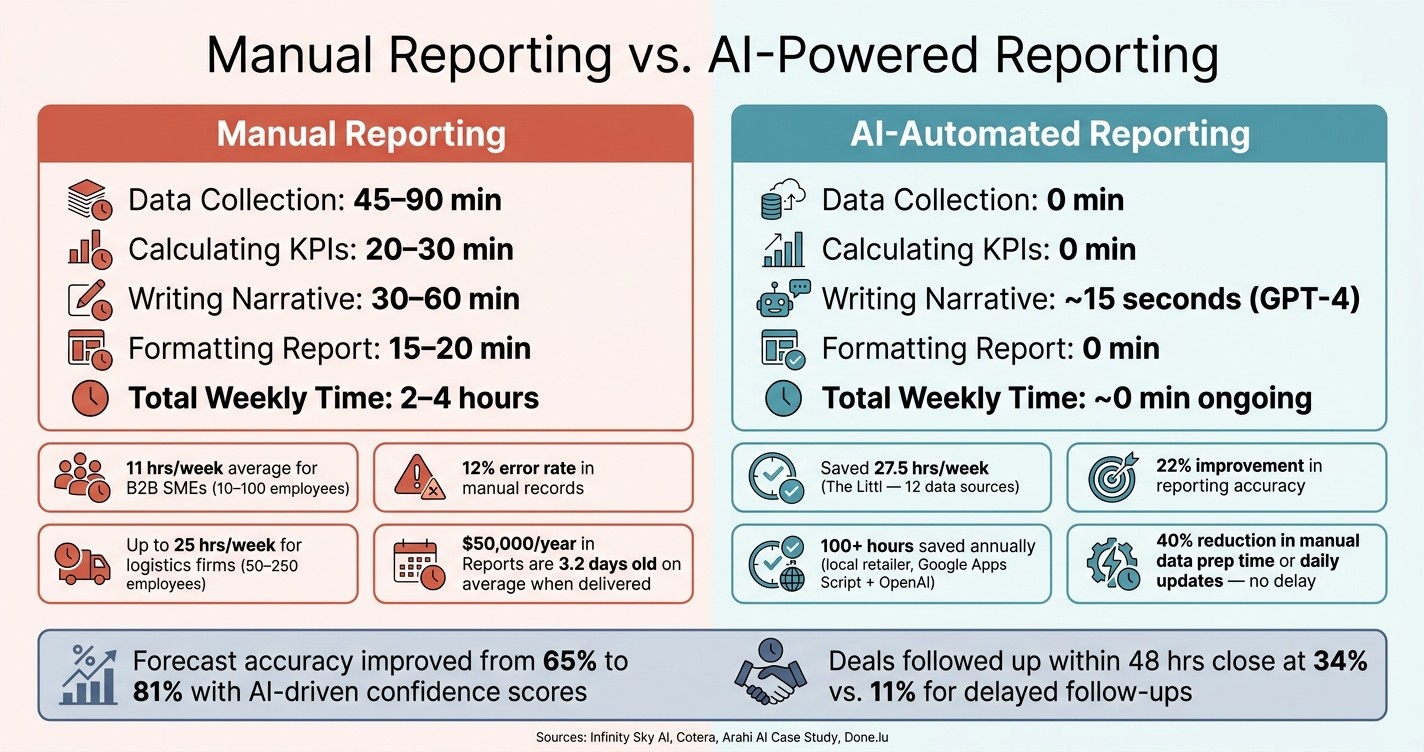
This transition - from raw data to meaningful insights - is where AI truly steps in to replace the analyst's role in routine reporting. To illustrate the efficiency gained, here's a comparison of manual versus AI-driven workflows:
Task | Manual Process | AI-Automated Process |
|---|---|---|
Data collection | 45–90 min | 0 min |
Calculating KPIs | 20–30 min | 0 min |
Writing narrative | 30–60 min | ~15 sec (GPT-4) |
Formatting report | 15–20 min | 0 min |
Total weekly time | 2–4 hours | ~0 min ongoing |
For consistent, accurate output, set the LLM temperature between 0.2 and 0.5 [10].
Next, let’s look at how AI ensures these reports are delivered to your team on time.
Scheduling and Sending Reports Without Manual Effort
AI doesn’t just simplify report creation - it also ensures they’re delivered exactly when needed. By using automated scheduling, reports can be set to run at specific times or triggered by specific conditions, like inventory levels dropping below a threshold. This eliminates the need for manual follow-ups [2][5].
Here’s a real-world example: In early 2026, a local retailer automated its weekly inventory report using Google Apps Script and the OpenAI API. Every Monday at 8:00 AM, the system pulled data from a Google Sheet updated daily by cashiers, generated a concise summary, and created an email draft for the store owner. The entire process reduced review time to just 90 seconds, saving more than 100 hours annually [5]. Alex Wu, Founder of Anythoughts.ai, highlighted the impact:
"The AI consistently flagged SKUs with declining week-over-week velocity, something the owner admitted she'd eyeball but rarely acted on." [5]
For high-stakes reports, it’s wise to include a quick human review to ensure accuracy [5].
Using Predictive Analytics to Make Better Decisions
Predictive analytics takes automated reporting a step further by not just analyzing past data but also providing alerts and recommendations to address potential issues before they escalate. This approach transforms raw data into actionable decisions, effectively replacing manual reporting processes.
Spotting Trends and Anomalies in Your Data
While automated reports focus on detailing past performance, predictive analytics actively identifies patterns and suggests corrective actions. AI continuously examines historical data and compares it with current trends to uncover hidden insights that might otherwise go unnoticed. For example, overall sales volume might look strong, but AI could reveal that the average deal size is quietly declining - something a standard weekly summary might miss [3].
Here’s a compelling case: AI discovered that deals followed up within 48 hours of the negotiation stage had a closing rate of 34%, compared to just 11% for delayed follow-ups [3]. Companies leveraging AI for anomaly detection have also seen a 22% improvement in reporting accuracy [1]. This shift allows teams to move from manually combing through dashboards to receiving timely, actionable insights tailored to their needs.
Beyond spotting trends, predictive analytics helps teams anticipate and prepare for future outcomes.
Forecasting What the Next Week Looks Like
AI can analyze seasonal patterns, procurement cycles, and historical transitions between sales stages to deliver more precise forecasts than traditional methods. For instance, one sales team improved their forecast accuracy from 65% to 81% by using AI-driven confidence scores based on stage duration and recent activity [3]. Businesses that regularly update their AI models report a 30% increase in prediction accuracy over time [1].
The benefits aren't just theoretical - they translate into real-world impact. In March 2026, The Littl, a fashion e-commerce brand founded by Alice Robert, integrated 12 data sources like Shopify, Meta Ads, and Xero into an AI Operating System. Within just two days, the system flagged an ad set running at a negative margin. Previously, this issue would have gone undetected for five days under manual reconciliation, leading to unnecessary losses [6].
To fully leverage predictive analytics, set up real-time anomaly detection for critical thresholds - such as inventory shortages, unexpected ad spend increases, or stalled sales deals. Additionally, implementing safeguards like minimum sample size requirements ensures that AI-generated insights are based on statistically reliable data [3].
How Querio Handles Weekly Reporting for SMEs
Querio takes the hassle out of weekly reporting for small and medium-sized enterprises (SMEs) by combining AI-driven efficiency with features tailored specifically for their needs. By automating insight generation, Querio eliminates countless hours of manual data assembly, making operations smoother and more productive.
Direct Connections to Your Data Warehouse
Querio simplifies reporting by connecting directly to your data warehouse, ensuring live, error-free updates. It integrates seamlessly with cloud data platforms like Snowflake, Google BigQuery, Amazon Redshift, ClickHouse, and PostgreSQL. Using encrypted, read-only credentials, Querio pulls accurate, up-to-date information in real time.
Getting started is straightforward: set up a read-only user in your data warehouse, link Querio to the key schemas, and begin accessing live data. If your tools - like Shopify, NetSuite, or Zendesk - are already integrated into a central warehouse via services like Fivetran or Airbyte, Querio can start pulling insights immediately.
Pro tip: start small with high-impact tables. Focus on weekly orders, fulfillment, and support metrics first. Once those are running seamlessly, you can expand to other data sets.
User-Friendly Queries Backed by Governed Analytics
Once connected, Querio empowers your operations team to ask questions in plain English - no need for SQL expertise. For example, an ops manager could type: "Show me average order fulfillment time by warehouse for last week" and instantly receive a clear table or chart.
Querio’s governed semantic layer ensures consistent results by mapping plain-English queries to standardized metrics. Your data team defines these metrics - like "On-Time Shipment Rate" or "Average Resolution Time" - with precise calculations and filters. This eliminates the common issue of teams producing conflicting numbers from the same data.
"The tool itself is fluid, modern and so user-friendly. We were able to adopt Querio in a matter of days... replacing weeks of manual reporting." - Jill Van Beke
This intuitive query system lays the foundation for dependable, automated reporting.
Scheduled Reports You Can Trust
Once you’ve created a reporting view - such as a "Weekly Ops Summary" covering metrics like order volume, on-time shipment rate, return rate, and ticket backlog - you can schedule automatic delivery. Reports can be sent every Monday at 7:30 AM via email or Slack, with each report displaying the underlying queries for quick anomaly checks.
Jennifer Leidich, Co-Founder & CEO of Mercury, highlights the impact: "What used to be a week-long process now takes minutes."
For a U.S.-based e-commerce SME generating around $20 million in annual revenue, Querio has cut weekly report production time from 5–6 hours of manual spreadsheet work to under 1 hour. This allows analysts to shift their focus from data wrangling to solving meaningful business challenges.
What SMEs Gain by Switching to AI-Powered Reporting
AI-powered reporting doesn’t just streamline operations - it offers strategic and financial advantages that small and medium-sized enterprises (SMEs) can’t afford to ignore.
Time Saved and Analyst Hours Put to Better Use
Manual reporting can be a massive time drain for SMEs. Surveys reveal that B2B companies with 10–100 employees spend an average of 11 hours per week on manual reporting tasks [11]. For logistics firms with 50–250 employees, this figure can exceed 25 hours weekly - translating to as much as $15,000 annually per coordinator. That’s time and money that could be better spent on activities that drive growth [2][11][12].
By automating data collection, AI frees up teams to focus on analysis rather than assembly. Instead of spending hours compiling reports, teams can dedicate their energy to interpreting the data and making decisions. What used to be a multi-hour Monday ritual can shrink into a quick 15–20 minute discussion about actionable insights [2][3].
"That analyst spending four hours building reports? They could be analyzing trends, identifying problems, or finding growth opportunities instead." - Infinity Sky AI [2]
More Accurate and Consistent Reports
Manual reporting processes are prone to errors, especially when data is transferred between spreadsheets or when inconsistent filters and definitions are applied. Studies from manufacturing environments highlight a 12% error rate in manual records, leading to costly rework. In one case, these errors resulted in $50,000 in annual remediation costs [4].
AI eliminates these risks by directly pulling data from sources via APIs and applying consistent business logic every time. This ensures uniformity in how metrics are defined and reported, reducing misunderstandings and discrepancies [2][4].
"Consistent AI-powered processing eliminated the quality variance that came with different team members handling report generation differently." - Arahi AI Case Study [4]
With fewer errors, businesses can make faster, more confident decisions while avoiding expensive rework.
Faster Decisions Backed by Data
Manual reports are typically outdated by the time they’re delivered - on average, they’re 3.2 days old [11]. That delay can mean missing critical trends or reacting too late to emerging issues. AI-powered reporting changes the game by providing real-time or daily updates, ensuring that problems are flagged as they happen [11][3].
The benefits are clear. In October 2025, a mid-sized retail company automated its weekly sales and operations reports, reducing manual reporting time by 67% and identifying regional sales dips before they became bigger issues [1]. Similarly, in March 2026, Marcus, Cotera's VP of Sales, replaced a 2.5-hour Monday spreadsheet routine with an AI-driven pipeline health report. This shift uncovered a key insight: deals followed up on within 48 hours closed at a 34% success rate, compared to just 11% for those that waited longer. This correlation had gone unnoticed during 14 months of manual reporting [3].
AI-powered tools don’t just save time - they enable businesses to act faster by turning raw data into actionable business intelligence insights.
Conclusion: Moving SME Operations Forward with Querio
Relying on manual weekly reporting eats up valuable time, introduces errors, and slows down decision-making.
Switching to AI-powered reporting isn’t about replacing your team; it’s about giving them the freedom to focus on tasks that truly matter. This change not only speeds up the reporting process but also allows your team to prioritize strategic work - bringing to life the time savings and decision-making agility highlighted earlier. It paves the way for a smoother, automated reporting process.
Querio simplifies this transition by connecting directly to your data warehouse and letting your team query in plain English. It pulls live data automatically and applies consistent business rules - eliminating the need for manual exports, formula errors, or version mismatches.
Before fully automating, it’s wise to ensure the AI-generated reports meet your specific operational needs. Involve your team during the initial weeks to review AI-generated summaries against your business context. Once the outputs align with your team’s expectations, you can confidently let the system handle the workflow [5][3].
If your team is still spending Monday mornings piecing together reports instead of making impactful decisions, it’s time to consider AI-powered reporting with Querio.
FAQs
What data do I need before automating weekly reports?
To set up automated weekly reports, start by collecting key performance metrics, data from tools like CRMs or project management platforms, and historical data to analyze trends. Clearly identify your data sources - whether they're spreadsheets, databases, or specialized software - and verify that all information is accurate and current. Having a solid grasp of your metrics, data sources, and the status of ongoing projects is crucial when implementing AI-powered reporting automation.
How do I keep AI-generated reports accurate and consistent?
To keep AI-generated reports accurate and consistent, it's crucial to have validation and monitoring systems in place. Automated tools can help identify errors, spot unusual patterns, and enhance accuracy by leveraging continuous learning. Clear data governance practices are essential, along with feedback loops to fine-tune algorithms. Regularly reviewing AI outputs ensures they remain dependable and consistent over time.
When should humans review AI reports vs. fully automate?
When tasks involve complexity, nuance, or high-stakes decisions, it's crucial for humans to review AI-generated reports. This ensures that insights are properly understood and validated within their context. On the other hand, full automation works best for routine, repetitive, and straightforward reporting tasks that require little to no oversight.
Related Blog Posts