Business Intelligence
How to migrate from Power BI to an AI-native BI tool without losing your reports
Guide to move Power BI reports to an AI-native, warehouse-first BI platform while preserving metrics, calculations, and workflows.
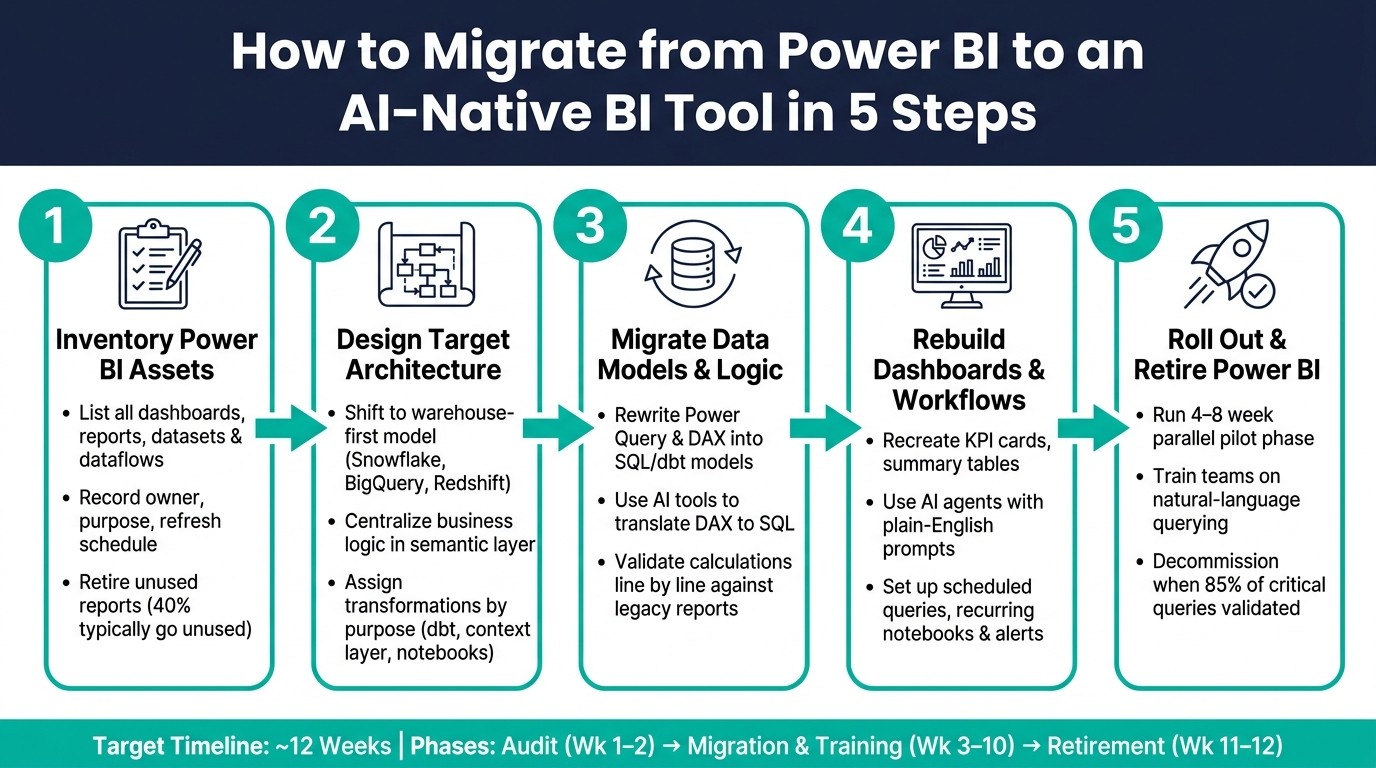
Migrating from Power BI to an AI-native BI tool like Querio can seem daunting, but it’s manageable with a clear plan. The process focuses on preserving report logic, ensuring data accuracy, and improving workflows by leveraging live data and centralized business metrics. Here’s how to approach it:
Inventory Power BI Assets: List all dashboards, reports, datasets, and dataflows. Prioritize those critical to business needs while retiring unused ones.
Design Querio Architecture: Shift to a live data model connected directly to your data warehouse (e.g., Snowflake, BigQuery). Centralize business logic in Querio's semantic layer for consistency.
Migrate Logic and Data Models: Rewrite Power Query and DAX logic into SQL or dbt models. Validate calculations and ensure alignment with legacy reports.
Rebuild Dashboards: Use Querio’s AI tools to recreate dashboards with live data and consistent metrics.
Roll Out and Retire Power BI: Start with a pilot phase, train users on natural-language querying, and gradually phase out Power BI.
This step-by-step migration ensures minimal disruptions while transitioning to a more efficient, real-time analytics platform.
Power BI to AI-Native BI Migration: 5-Step Process
Migrate from Power BI, Tableau & Qlik to AI-Ready Analytics
Step 1: Take Stock of Your Power BI Assets
Before diving into migration, take the time to inventory all your Power BI assets. Skipping this step often leads to overlooked dependencies and underestimating the project’s scope, which can bring everything to a standstill.
Build a Full Inventory of Your Power BI Environment
Your inventory should include every type of asset: dashboards, reports, datasets (semantic models), dataflows, and datamarts. For each asset, record key details such as the owner, business purpose, target audience, refresh schedule, and gateway configuration. To save time, leverage tools like Power BI Admin APIs and PowerShell cmdlets for automating data collection. This can help you avoid hours of manual spreadsheet work [5][6][7].
Compile all this information into a single master reference document - essentially your migration map. This document should include every workspace, semantic model, and permission set, providing a comprehensive guide for the rebuild phase.
"Every legacy report must be evaluated for its data sources, refresh model, semantic structure, and dependency chain. Any migration plan built without this architectural awareness will eventually run into bottlenecks." - Dossier Analysis [8]
Sort Reports by Complexity and Priority
Once your inventory is complete, the next step is to organize it. Not all reports are worth migrating. Begin by categorizing them based on how often they’re used and their complexity. For reports that haven’t been used in over a year, consider retiring them.
Here’s a helpful way to group the remaining reports:
Report Category | Complexity | Priority | Key Characteristics |
|---|---|---|---|
Executive Scorecards | Medium–High | Critical | |
Operational Dashboards | Medium | High | |
Financial Statements | High | High | Rigid hierarchies, complex formatting [2] |
Self-Service/Sandbox | Low–Medium | Medium | Ad-hoc exploration by analysts [2] |
Redundant/Legacy | Low | Low | Low usage, outdated sources [10] |
This tiered approach ensures you focus on the most important reports first, while also identifying opportunities to consolidate or eliminate unnecessary ones. As Melissa Coates, Data Platform MVP, explains: "A migration can provide an opportunity to deliver improvements... It can include consolidating multiple reports into one, or eliminating legacy items that haven't been used for some time." [4]
Document Data Sources and Transformations
For each report slated for migration, map out its entire data chain. This includes identifying:
Source systems: SQL Server, APIs, flat files, etc.
Connection modes: Import, DirectQuery, or Live Connection.
Power Query (M) transformations: Every transformation applied before the data reaches the semantic model [11][12].
Pay extra attention to DAX measures and calculated columns, as they represent critical business logic. Separate your calculation logic (e.g., defining metrics like Gross Margin %) from your presentation logic (e.g., formatting choices like bold text or red font). Calculation logic should reside in the semantic layer, while presentation logic belongs in the visual layer [2][11]. This distinction, made early on, can prevent significant rework later.
Additionally, flag any Row-Level Security configurations to ensure they’re validated during migration.
With your Power BI asset map complete, you’re ready to move on to designing Querio’s target architecture.
Step 2: Design Your Target Architecture in Querio
Now that you’ve got your Power BI asset inventory ready, it’s time to map out how everything will fit into Querio. The goal here is to create a cleaner, scalable structure that supports live data workflows. By building on your Power BI inventory, this step ensures a smooth transition to real-time analytics.
Move to a Warehouse-First Model
One of the key shifts in this migration is understanding how Querio handles data differently. Unlike Power BI, which relies on data imports or scheduled refreshes, Querio directly connects to your data warehouse - whether it’s Snowflake, BigQuery, Amazon Redshift, ClickHouse, or another platform. This approach eliminates the need for extracts, refreshes, or worrying about outdated data. Live connections mean your reports always reflect the most current insights, which is critical for real-time decision-making.
"The first failure mode in analytics is not bad visualization. It is dependency. Once every question needs a specialist, the company turns data into a bottleneck instead of an advantage." - Querio [13]
Rebuild the Semantic and Metrics Layer
Consistency across reports is crucial, and Querio achieves this by centralizing logic in a shared context layer. This is where you define joins, metrics, and business terms once, and those definitions apply everywhere - from dashboards to ad-hoc queries and even AI-generated answers. For example, renaming technical fields like TR_AMT to something clearer like Total Revenue not only improves readability but also helps AI tools interpret data more accurately using an AI BI engine.
If you’re dealing with complex DAX logic that can’t be expressed as simple metrics, move that logic into the warehouse using SQL models (via dbt) and link it to Querio. During the migration, run a pilot phase to validate Querio’s query results against your Power BI reports. Comparing figures line by line is the most reliable way to ensure calculations match before decommissioning old reports.
Decide Where Transformations Should Live
To keep your architecture streamlined, assign transformations based on their purpose:
Core transformations like joins, filters, and aggregations belong in the warehouse, ideally as dbt models.
Business metric definitions should live in Querio’s context layer.
Exploratory or ad-hoc logic fits best in Querio’s notebook environment.
Formatting for presentation stays in the visual or dashboard layer.
Transformation Type | Where It Should Live |
|---|---|
Joins, aggregations, filters | Warehouse SQL model (e.g., dbt) |
Business metric definitions | Querio context layer |
Ad-hoc or exploratory logic | Querio notebook |
Presentation formatting | Visual/dashboard layer |
This clear separation keeps your models clean and makes future updates faster. It’s the same principle you applied in Step 1: separating calculation logic from presentation logic, but now applied to the entire architecture.
"Calculate in the model, present in the report. When calculation and presentation remain separated, models stay cleaner and easier to evolve." - Inforiver [1]
With your architecture mapped out, the next step is to migrate your data models and reporting logic to Querio.
Step 3: Migrate Data Models and Report Logic
With the target architecture from Step 2 ready, it’s time to move your data models and report logic into Querio.
Repoint Data Sources to the Warehouse
Before diving into report logic updates, make sure your warehouse is fully prepared for the migration. This means ensuring core tables are clean, dbt models are properly configured, and your data is organized according to the plan from Step 2. Once everything checks out, connect Querio using encrypted, read-only credentials.
Next, revisit the Power BI inventory you created in Step 1. Map each Power BI dataset to the corresponding warehouse table or dbt model. To make deployment across environments smoother, parameterize your data sources.
Rewrite Power Query and DAX Logic
Start by converting core transformations into SQL or dbt models. Move business metric definitions into Querio's centralized semantic layer to maintain consistent metrics across your reports. Querio’s AI tools can help here - use them to translate DAX into SQL and verify the output with the "Explain SQL" feature before finalizing any changes.
Keep an eye on dependency chains during this process. Even a small error in base measures can cascade into larger issues. Audit these chains early and simplify wherever possible. Querio’s tools can reduce calculation errors by up to 90% [12], but that only works if the foundational logic is solid.
Once the logic is rewritten, validate the new models to ensure they align with your legacy reports.
Validate Data and Logic Accuracy
After migrating and rebuilding your logic, double-check that everything works as expected. Run identical reports in both systems, using the same date ranges and filters, and compare totals line by line. If discrepancies pop up, trace them back to their source - whether it’s a transformation mismatch, a metric definition issue, or an incorrectly applied filter.
Don’t stop at the numbers. Test interactive features like filters, drill-downs, and date slicers to confirm they behave correctly. Pay attention to load times too - most visuals should load data within 10 seconds. If they don’t, the problem is likely in the warehouse model, not Querio. Address it at the source.
Validation Aspect | Querio Method |
|---|---|
Logic verification | Inspectable SQL/Python + "Explain" command |
Metric consistency | Centralized semantic context layer |
Error correction | "Fix with AI" automated debugging |
Data accuracy | Live warehouse connection (real-time) |
Security validation |
Finally, update any external automation or API calls tied to Power BI report IDs to reflect the new Querio artifact IDs.
Step 4: Rebuild Dashboards and Workflows in Querio
Now that your data models are validated and your logic is successfully migrated, it’s time to rebuild the dashboards and workflows your team relies on daily.
Recreate Dashboards with Live Data
Start by focusing on high-priority dashboards. Map each Power BI visual to its equivalent in Querio - features like trend line charts, KPI cards, and summary tables have direct counterparts, reflecting the essential features of modern business intelligence tools. Querio uses inspectable SQL for all queries, meaning there’s no need for data extracts or scheduled refreshes. This ensures that dashboards always reflect the most up-to-date data.
The semantic context layer you set up in Step 2 comes into play here, automatically applying metrics and joins across dashboards. This eliminates the risk of inconsistent numbers across reports. Plus, automation tools in Querio can help speed up the rebuilding process.
Use AI Agents to Speed Up Migration
Querio's AI agents can make the dashboard reconstruction process faster and more accurate. Simply describe what you need in plain English, and the AI generates, verifies, and saves the SQL query for you. If you’re working on complex reports that previously used multi-step DAX calculations, the "Explain SQL" feature can help you confirm the logic before attaching queries to your dashboard. This way, you maintain the integrity of your report logic and data throughout the migration.
Set Up Scheduled and Recurring Workflows
Querio makes it easy to configure workflows that run on a regular schedule. You can set up scheduled queries and recurring notebooks to deliver results daily, weekly, or monthly to specific users or channels. For real-time monitoring, Querio supports dashboard alerts linked directly to live warehouse data, so stakeholders stay informed without additional effort.
Workflow Type | How to Replicate in Querio |
|---|---|
Scheduled report delivery | Schedule queries with direct notifications |
Recurring deep-dive analysis | Recurring notebooks with versioned SQL/Python logic |
Threshold-based alerts | Dashboard alerts tied to live warehouse metrics |
Automated data refresh | Live warehouse connection - no refresh needed |
Once your dashboards and workflows are in place, you’ll be ready to move on to the rollout phase and complete the transition from Power BI.
Step 5: Roll Out Querio and Retire Power BI
Once models and dashboards have been successfully migrated, the next step is to roll out Querio while phasing out Power BI. By approaching this transition in carefully planned stages, you can minimize disruptions to daily operations.
Start with a Pilot and Gather Feedback
Kick things off by running a pilot in one business area, such as finance, marketing, or operations. During this phase, operate Querio and Power BI side by side for 4–8 weeks. This overlap gives users time to compare results, ensuring key metrics align while also identifying any issues or edge cases before fully switching platforms.
Use this period to engage your internal champions - the power users who are responsible for most of the analytical activity. Their early involvement is crucial for refining the system and gaining broader team support. Once the pilot team verifies that Querio can handle at least 85% of critical queries[3] accurately, you can confidently move to a wider rollout. This initial phase sets the stage for a smooth transition across the organization.
Train Teams on AI-Native Workflows
Querio introduces a new way of working, moving from traditional pre-built reports to using plain English queries. To help teams adapt, structured training is key.
Focus on three main workflows during training:
Natural-language querying: Teach users how to ask questions directly in Querio.
Notebook-based analysis: Show how to create and share deeper analyses.
Governed self-serve access: Emphasize how the shared semantic context layer ensures consistent results.
Make sure to demonstrate how users can review the SQL behind their queries and save these for future use. Additionally, Querio allows for model-level instructions to guide the AI toward preferred visualizations and business rules, reducing repetitive clarifications during the adjustment period.
Once your teams are comfortable with these workflows, you can begin decommissioning Power BI assets.
Decommission Power BI Assets Safely
Before retiring Power BI, conduct an audit to understand which assets are actively used. Studies suggest that about 40% of Power BI dashboards go unused, making them safe to retire without affecting operations. Use Power BI Service metrics to identify the most-viewed dashboards and workspaces, focusing your efforts on decommissioning the rest.
"Old dashboards poison trust." - Querio [14]
For dashboards that are still critical, document key DAX measures and redirect URLs to avoid broken links. After confirming system stability, cancel Power BI Pro licenses and decommission Premium capacity.
Here’s an example timeline for a phased migration:
Phase | Weeks | Key Activities |
|---|---|---|
Audit & Scope | 1–2 | Identify top workspaces by usage; export DAX; map dataflows |
Migration, Rebuild & Training | 3–10 | Translate DAX to YAML; rebuild top reports; validate in parallel; train users; redirect URLs |
Retirement | 11–12 | Decommission Power BI licenses; archive final report versions |
To prevent dashboard sprawl, implement a formal retirement policy where outdated dashboards are removed on a set schedule. This approach helps maintain user trust and keeps your system clean and efficient[14].
Conclusion: Key Steps for a Smooth Migration
Migration isn’t just flipping a switch - it’s a carefully planned process. The five phases - auditing your existing assets, designing your target architecture, migrating data models, rebuilding dashboards, and rolling out to users - are designed to ensure accuracy and keep your teams running smoothly during the transition.
Phase | Key Activity | Goal |
|---|---|---|
Preparation | Audit Assets | Identify critical assets and business logic |
Integration | Connect warehouse (Snowflake/BigQuery) | Create live, read-only data streams |
Modeling | Build context layer | Define key metrics and relationships |
Recreation | Dashboard Parity Pack / AI Agents | Reproduce Power BI visuals in Querio |
Rollout | Pilot program & parallel testing | Validate accuracy and train users |
The migration process revolves around a warehouse-first approach, which connects directly to your data warehouse using secure, read-only credentials. This ensures live data flows seamlessly, keeping reports accurate during and after the migration.
Another critical element is the centralized semantic layer, which standardizes metrics like Gross Margin or MRR across all queries and dashboards, eliminating confusion and ensuring consistency.
"At scale, consistency is a design decision - not an outcome." - Inforiver [2]
Finally, a successful pilot program - able to handle most essential queries - signals readiness for a full rollout. By following these steps, your migration process can maintain continuity, accuracy, and efficiency from start to finish.
FAQs
How do I translate complex DAX measures into SQL without changing results?
To convert complex DAX measures into SQL while maintaining the same results, start by carefully examining the logic behind the DAX expressions. Then, replicate that logic using SQL's built-in functions and expressions. It's crucial to test the SQL queries thoroughly to confirm they produce identical outputs to the original DAX measures. You can also use migration tools to simplify and validate the process. These tools not only ensure precision but can also minimize runtime translation efforts and boost overall performance.
What should stay in the warehouse vs Querio’s semantic layer?
When deciding what belongs in the warehouse versus Querio’s semantic layer, it all comes down to how the data is utilized.
Warehouse: This is where raw data, live connections, and stable models reside. It ensures consistency and delivers strong performance for foundational data needs.
Semantic layer: Ideal for managing business logic, metrics, and KPIs. It helps maintain governance, minimizes duplication, and streamlines maintenance.
To put it simply: store raw data in the warehouse and handle business logic in Querio’s semantic layer for the best outcomes.
How can we validate parity between Power BI and Querio during the pilot?
To check for parity, focus on comparing data accuracy, report consistency, and performance between the tools. Start by running the same queries in both Querio and Power BI to confirm that their outputs align. Ensure dashboards display identical metrics and visualizations to avoid discrepancies. Test performance using live data connections, and double-check governance settings such as permissions and compliance protocols. These steps will help determine if Querio meets or surpasses Power BI in terms of data reliability and usability during the pilot phase.
Related Blog Posts


