Business Intelligence
Why Querio is the first BI tool that works for both your analyst and your CFO
One BI platform that unites analysts and CFOs with live warehouse data, governed metrics, and editable code.
Querio solves a common problem: the disconnect between analysts and CFOs. Analysts rely on technical tools like SQL and Python, while CFOs need clear, actionable insights. This gap often leads to inconsistent data, wasted time, and frustration for both roles.
Querio bridges this divide by offering a single platform that works for both groups. Analysts get full control over SQL and Python, while CFOs can ask plain-English questions and access live dashboards. With a shared semantic layer, metrics like ARR and CAC are consistent across the board, ensuring everyone works with the same numbers.
Key Benefits:
For Analysts: Editable AI-generated SQL/Python, version control, and a notebook environment for deep analysis.
For CFOs: Natural-language queries, real-time dashboards, and drill-down capabilities for detailed insights.
Shared Metrics: A unified semantic layer ensures consistent, reliable data for all users.
Querio eliminates data silos, manual processes, and inconsistent metrics, enabling faster collaboration and better decision-making. Whether you're analyzing trends or presenting to the board, Querio keeps everyone on the same page.
The Challenges Analysts and CFOs Face with Current BI Tools
The issues with business intelligence (BI) tools often have less to do with the technology itself and more to do with the disconnect between analysts' workflows and what CFOs actually need. Traditional tools tend to widen this gap, leading to fragmented processes and obstacles in both detailed analysis and strategic financial planning.
Fragmented Workflows and Data Silos
Analysts and finance teams often operate in completely different ecosystems. Analysts rely on tools like data warehouses, SQL editors, and notebooks, while finance teams stick to Excel, email, and slide decks. These systems rarely integrate seamlessly, resulting in inconsistent metric definitions and confusion. It’s not uncommon to see two versions of the same number - one pulled from a data warehouse and another tweaked in a locally saved spreadsheet.
This fragmentation becomes particularly problematic during high-pressure periods, like quarter-end reporting. CSV files are exported, emailed, edited locally, and saved without proper version control. This chaotic process often leads to multiple interpretations of key metrics like ARR or gross margin. By the time the CFO presents these figures to the board, there’s often uncertainty about whether the numbers accurately reflect the original data from the analyst.
Where Analysts Get Stuck
Basic dashboards can handle straightforward metrics like "revenue by month" or "customers by region." But when CFOs ask more nuanced questions, such as, "What caused gross margin to drop 3 percentage points last month - was it mix shift, discounts, or higher COGS?", these tools fall short. Analysts are forced to leave the platform, write and debug custom code, and then compile their findings, slowing down the decision-making process.
The core issue lies in the lack of transparency. Many BI tools obscure their underlying logic with click-based interfaces, making it hard for analysts to trace how metrics were calculated. Without access to raw queries or version control, resolving discrepancies becomes a time-consuming task. For instance, when one report shows $3.2M in revenue and another shows $3.1M, analysts often spend more time reconciling these numbers than performing meaningful analysis.
What CFOs Are Missing
CFOs face an entirely different set of challenges. They’re often presented with dashboards that are either too high-level to inform action or too technical to interpret without an analyst's help. Without clear visibility into how metrics are calculated - such as the filters, date ranges, or discount policies applied - they’re left with two unappealing options: trust numbers they can’t verify or wait several days for clarification.
This lack of confidence can have serious consequences. Budgeting decisions might rely on outdated data, and forecasts generated in one tool can conflict with assumptions made in Excel. When CFOs can’t independently answer detailed questions, analysts are frequently pulled away from strategic work to address repetitive requests. This dynamic underscores the need for a platform that bridges the gap between technical precision and strategic usability.
Challenge | Impact on Analyst | Impact on CFO |
|---|---|---|
Data silos | Hours spent on manual data prep | Decisions based on conflicting numbers |
Fragmented workflows | Stuck in repetitive ad hoc requests | Delayed insights; unable to act quickly |
Rigid tooling | Limited to static, one-off dashboards | Barriers to self-service business intelligence |
Inconsistent metrics | Wasted time reconciling numbers | Low confidence in reports |
How Querio Solves the Problem for Both Roles
Querio tackles the challenges faced by analysts and CFOs with three key features that align analysis and reporting seamlessly.
The issues of outdated exports, inconsistent metric definitions, and unclear AI outputs don’t have to be the norm. Querio addresses these problems head-on with features designed to provide a shared, reliable framework for decision-making.
Direct Connections to Live Data Warehouses
Querio integrates directly with your data warehouse - Snowflake, BigQuery, Amazon Redshift, ClickHouse, and PostgreSQL - using encrypted credentials. This eliminates the need for scheduled exports, internal data copies, or separate BI storage layers that can become outdated.
Every query runs in real time against live data. For instance, if a new contract closes on 03/31/2026, both the CFO's ARR dashboard and the analyst's cohort notebook update instantly. This avoids discrepancies like a $150,000 ARR mismatch caused by stale exports. Plus, Querio inherits your warehouse's permission settings, ensuring that role-based security, row-level security, and user groups are maintained without additional setup.
With real-time data integrity in place, Querio takes it a step further by standardizing metric definitions through a shared semantic layer.
A Shared Semantic Layer for Consistent Metrics
Even with live data, different teams often define metrics in conflicting ways. Querio solves this with a shared semantic layer - a centralized system where data teams define key business logic once, ensuring consistency across the platform.
Metrics like ARR, gross margin, and CAC are defined in one place, specifying source tables, filters (e.g., excluding one-time fees from ARR), and settings for currency and date ranges. These definitions power every dashboard, notebook, and AI output. For example, when the CFO filters ARR by customer segment and an analyst runs a Python trend analysis, both use the same underlying metric logic. Updates are tracked through version history and change logs, keeping everything transparent and minimizing surprises in production reports.
With metrics aligned, Querio also empowers analysts to work with AI-generated code that is fully transparent and editable.
AI-Generated SQL and Python You Can Inspect
Querio’s AI translates plain-English questions into real SQL and Python code, providing not just summaries but also detailed, inspectable code. Ask, "What caused the drop in gross margin last month?" and Querio delivers a narrative, a chart, and a "Show query" option that reveals the underlying code for review and edits.
Analysts can inspect every join and filter, tweaking the code to add window functions, adjust date granularity, or refine conditions. For deeper analyses, Querio generates Python code in an editable notebook environment. Once verified, these queries and notebooks can be saved as reusable components for dashboards or recurring reports. This ensures CFOs that every figure presented - whether in a board meeting or a report - has been thoroughly vetted and validated.
How Querio Works for Analysts
Analysts often find themselves bogged down with repetitive tasks like writing SQL, managing metric definitions, and tweaking queries. Querio is designed to simplify these processes, letting analysts focus on more complex and impactful work.
From Plain-English Questions to Editable Code
Imagine typing a question like, "Show me monthly recurring revenue by product line for the last 12 months in USD, excluding test accounts." Querio doesn’t just give you a summarized answer or an unexplained chart. Instead, it generates executable SQL or Python code that's fully visible, editable, and ready to use.
Querio leverages your warehouse schema and shared semantic layer to ensure it pulls the correct tables, joins, and metric definitions right out of the gate. For example, if you need to refine the query to include only customers with $1,000+ in MRR, you can simply edit the code directly. Every version of the query is automatically saved, so if something goes wrong, rolling back is quick and easy.
According to ThoughtSpot, organizations using natural language analytics experience 30–50% faster time-to-insight, enabling analysts to focus on advanced modeling rather than one-off report requests [1].
Querio serves as a starting point, ensuring analysts remain in full control of the logic behind their work.
A Notebook Environment Built for Iteration
Querio goes beyond code generation by providing a flexible notebook environment tailored for iterative analysis. In this workspace, SQL, Python, and commentary coexist seamlessly. For instance, a CAC payback analysis can be fully contained in one notebook: one cell pulls spend and acquisition data, another creates a cohort table, a Python cell calculates cumulative gross margin, and a chart visualizes payback curves by channel. Analysts can even add markdown notes to explain anomalies or nuances.
Reactive dependencies streamline the process further. If you change a date parameter from Q2 to Q3, every related cell recalculates automatically. Analysts can also expose parameters like date ranges or product groups as dropdowns, allowing stakeholders - like a CFO reviewing the notebook - to adjust views without touching the underlying code. With scheduled refreshes, the notebook stays up-to-date as new data is added to the warehouse, transforming one-time analyses into dynamic, reusable assets.
Analyst Control Over Metric Definitions
Querio gives analysts direct control over managing key metrics, turning the shared semantic layer into more than just a governance tool - it becomes something analysts actively shape. Updates to metric definitions are tracked with detailed version histories, ensuring consistency across teams. This means no one on the finance team can accidentally use a different formula in a presentation, as metrics are enforced at the platform level, not stored in spreadsheets.
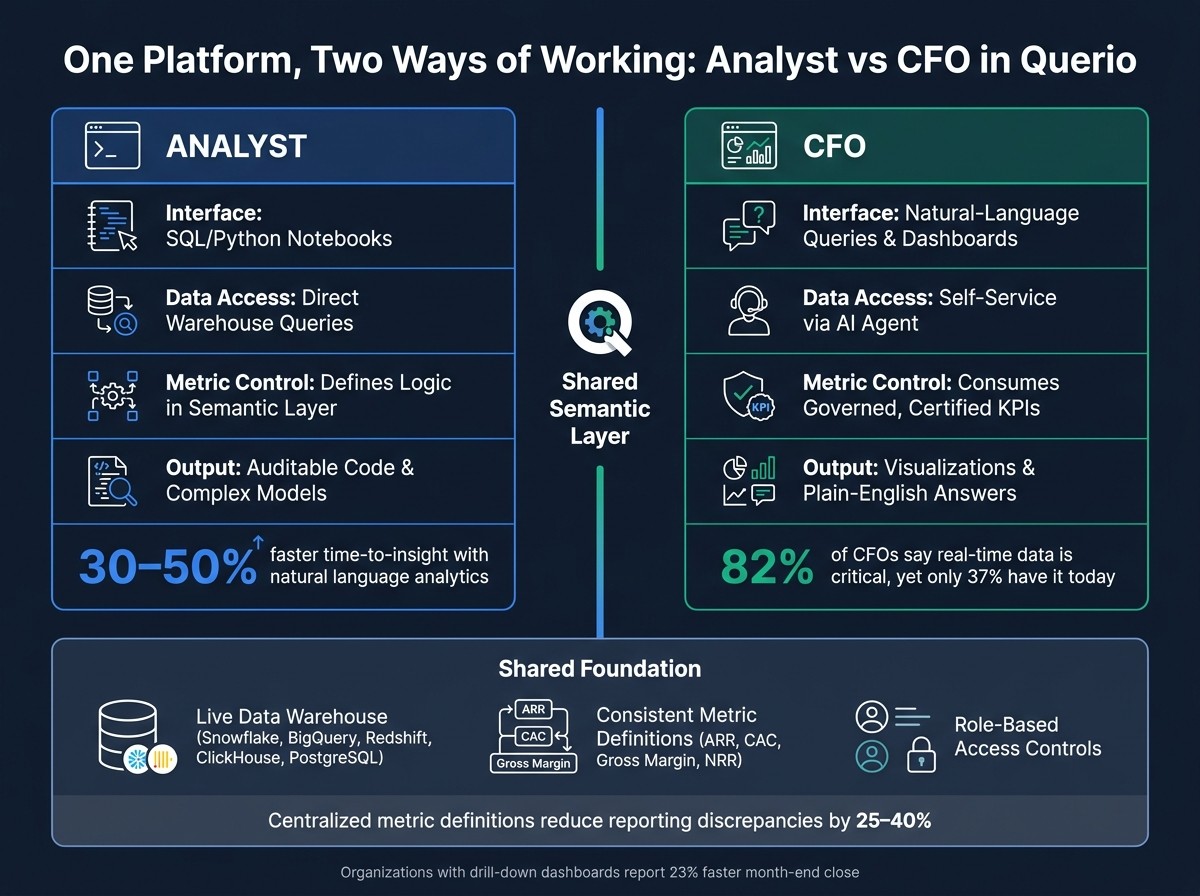
A 2024 Hightouch survey revealed that companies using centralized metric definitions reduced reporting discrepancies by 25–40% across teams [4].
Querio’s version history and change logs add another layer of reliability. Every update to a metric definition includes a clear record of who made the change and when. For analysts involved in financial reporting, this audit trail is as essential as the metrics themselves.
How Querio Works for CFOs
Querio is designed to simplify complex data, giving CFOs the clear financial insights they need to make strategic decisions. Instead of diving into technical details, CFOs can focus on getting fast, accurate, and presentation-ready answers.
Ask a Question, Get a Financial Answer
With Querio, CFOs can type straightforward, plain-language questions like, "Show me operating expenses by department for the last 6 months in USD, compared to budget." In seconds, Querio processes the query, taps into live data, and delivers a polished output. For example, it might generate a combined bar and line chart showing actual vs. budgeted operating expenses (Opex), formatted as $1,234,567.89, alongside a narrative summary. If Marketing overspent by 12.4% ($184,000) in March while other departments stayed within ±3%, Querio flags that discrepancy immediately - no need for an analyst to intervene.
This is a game-changer because 82% of CFOs say having access to real-time, high-quality data is critical for driving business value, yet only 37% feel they have it today [4]. Querio ensures answers are always based on the most current data, helping CFOs move from quick insights to more detailed exploration on interactive dashboards.
Live Dashboards with Drill-Down Capability
Querio’s dashboards provide CFOs with deeper insights built around critical metrics like ARR, MRR, gross margin, net revenue retention, cash burn, and runway. These dashboards use standard US formatting and allow for filtering by time range, region, product line, and segment.
What makes these dashboards stand out is their drill-down functionality. Let’s say a CFO notices a 20% increase in Sales & Marketing Opex last month. Instead of requesting help from the data team, they can click on the Opex tile, drill into Sales & Marketing, and then into Paid Media to discover that Google Ads spend doubled for a new campaign - down to the exact invoice (e.g., Invoice #INV-12345, dated 04/10/2026, $32,450.00). This level of detail is why organizations with drill-down dashboards report a 23% faster month-end close on average, as finance and data teams spend less time reconciling discrepancies [2].
Full Visibility Into Every Metric
One of the biggest hurdles for CFOs is trusting dashboards without fully understanding the numbers behind them. Querio eliminates this concern by offering complete transparency. Every KPI includes a "See how this is calculated" link, which provides a plain-English definition, the data sources used, applied filters, and the last refresh timestamp (e.g., "Last ETL run: 05/15/2026, 10:55 PM PT; Dashboard refreshed: 05/15/2026, 11:02 PM PT.").
Take Net Revenue Retention (NRR) as an example. Clicking into the metric panel reveals its definition ("Revenue from existing customers this period, including expansion and downgrades, divided by revenue from those same customers one year ago, excluding new customers"), a concrete scenario ("If customers worth $10M ARR a year ago are now worth $11.4M, NRR = 114%"), and the owner ("Defined by: Finance Analytics (Jane Smith). Last updated: 03/05/2026"). If there’s a pipeline failure, Querio flags it immediately with a warning message, ensuring CFOs never present outdated numbers to the board. This level of clarity addresses a key issue, as 67% of senior executives say they lack the transparency needed to trust their analytics tools [3].
How Analysts and CFOs Work Together in Querio
Analyst vs CFO: How Querio Serves Both Roles on One Platform
Most BI tools make you choose between depth and ease of use. Querio sidesteps this entirely by giving each role a customized interface, all while working off the same data foundation.
One Platform, Two Ways of Working
Querio caters to both analysts and CFOs by offering tools tailored to their needs. Analysts operate in a notebook environment where they can write and tweak SQL or Python, define metrics in the semantic layer, and publish certified KPIs. CFOs, on the other hand, access the same certified metrics through an intuitive natural-language interface and prebuilt dashboards - no coding required.
For example, if an analyst updates the definition of Customer Acquisition Cost (CAC) to include implementation fees, every CFO-facing dashboard using CAC updates instantly. This automatic syncing eliminates manual updates and prevents inconsistencies.
Layer | Analyst Experience | CFO Experience |
|---|---|---|
Interface | SQL/Python notebooks | Natural-language queries and dashboards |
Data Access | Direct warehouse queries | Self-service via an AI agent |
Metric Control | Defines logic in the semantic layer | Consumes governed, certified KPIs |
Output | Auditable code and complex models | Visualizations and plain-English answers |
This setup creates a seamless feedback loop between teams, making collaboration faster and more effective.
Faster Back-and-Forth Between Teams
Querio’s unified interface also speeds up communication during high-pressure times. Take a month-end close at a U.S.-based SaaS company as an example. The CFO opens a live "Financial Overview" dashboard in Querio, spots an unexpected 3% rise in enterprise churn for March, and leaves an in-context comment directly on the churn widget: "Why did enterprise churn spike in March?"
The analyst gets notified within Querio, pulls transaction-level data using auto-generated SQL, and discovers that a $250,000 ARR healthcare client churned due to a pricing change. They save their findings in a notebook, add a short explanation, and attach a drill-through view for deeper analysis. This eliminates the need for exporting CSVs or lengthy email chains.
By keeping everything - questions, code, context, and answers - in one place, Querio ensures that collaboration happens quickly and efficiently.
Consistent Numbers Across Every Use Case
Querio’s metric catalog doesn’t just support internal teams - it’s also the backbone for external reporting. The same metrics powering analyst notebooks and CFO dashboards are used for cross-functional reports and even embedded analytics for investors or board members. For instance, an investor logging into a read-only portal sees metrics like ARR, net dollar retention, and gross margin calculated exactly the same way the internal finance team does.
Role-based access controls ensure sensitive details, like customer-specific pricing, remain hidden while preserving the accuracy of aggregate figures. Tools like Google Sheets or PowerPoint can pull scheduled exports directly from the semantic layer, avoiding manual errors or "shadow definitions" in reports.
This governance model keeps reporting consistent during critical times, such as quarterly closes or audits, while still allowing analysts to stage and test updates before they’re certified. Meanwhile, CFOs can view and comment on metrics throughout the process, ensuring transparency without slowing down operations.
Conclusion: A BI Tool That Works for Your Whole Team
What Growing Data Teams Gain with Querio
For small but ambitious data teams, repetitive ad-hoc reporting can eat up a lot of valuable time. Questions like "What's our gross margin by product line over the last 90 days?" or "How does budget compare to actual revenue for Q2?" often require hours - or even days - of effort from analysts each month. With Querio, those questions can be answered on-demand by CFOs themselves, freeing analysts to tackle more impactful tasks like building forecasting models or running scenario analyses.
This self-serve business intelligence approach also speeds up decision-making. CFOs can test different questions and scenarios directly, without waiting on analysts. Fewer back-and-forths mean faster insights, quicker decisions, and less strain on resources - all without needing to expand the team.
Another key benefit? Confidence in your data. Querio ensures every metric is defined and validated in one place, eliminating the confusion caused by duplicate reports or inconsistent numbers. The endless debate over "which number is right?" simply disappears.
Built for Teams Where Analysts and Executives Share the Same Data
Querio creates a seamless connection between technical analysis and strategic decision-making. Analysts get the depth and tools they need for detailed work, while CFOs get straightforward, actionable insights. Both roles operate from a single, live data source with governed metrics, ensuring clarity and consistency.
This shared platform fosters collaboration, aligning technical expertise with strategic priorities. By uniting everyone under one transparent system, Querio enables faster, more precise financial decisions - without sacrificing accuracy or efficiency. When your team works from the same foundation, the entire finance operation becomes smoother and more reliable.
FAQs
How does Querio keep metrics consistent for everyone?
Querio connects directly to live data sources such as Snowflake and BigQuery, ensuring real-time access to your organization's data. It takes care of automating processes like data cleaning and standardization, eliminating the need for manual intervention. On top of that, Querio applies a governance layer that enforces shared business logic and definitions across the board.
This streamlined approach ensures everyone in your organization is working with accurate and consistent insights, fostering alignment and reducing discrepancies in data interpretation.
Can analysts fully review and edit the AI-generated SQL and Python?
Analysts have the ability to thoroughly review and edit AI-generated SQL and Python code. With Querio, the code is fully accessible and transparent, giving users the freedom to inspect, adjust, and tailor it to their specific needs. This ensures complete control over the final output.
How does Querio enforce warehouse permissions and row-level security?
Querio ensures strict warehouse permissions and row-level security by implementing user-specific access policies directly within the data warehouse. These policies limit data access at the row level, tailoring visibility based on user roles or attributes. This guarantees that users only access the data they are authorized to view, protecting sensitive information while maintaining accurate, role-based access control.
Related Blog Posts