Tableau vs Power BI: The Definitive 2026 Comparison
A deep dive into Tableau vs Power BI for startups and data teams. We compare pricing, TCO, performance, AI, and embedding to help you choose wisely.
https://www.youtube.com/watch?v=axgNfM55dw8
published
Outrank AI
tableau vs power bi, business intelligence, data visualization, startup analytics
05da8d15-091c-42aa-9684-93ae54dab6eb

Most tableau vs power bi advice is too shallow. It treats the choice like a shopping comparison between chart libraries, connectors, and price tiers. That’s not how this decision plays out inside a startup.
Your first BI platform becomes part of your operating model. It shapes who can answer questions, how often dashboards break, how much logic gets trapped inside reports, and whether your data team spends its week generating lasting value or acting as a ticket queue. That’s why the usual advice misses the hard part. The core question isn’t which tool has prettier visuals or cheaper entry pricing. The core question is which set of trade-offs your team can live with for the next few years.
A lot of teams learn that too late. One analysis argues that 73% of BI projects fail to deliver ROI in the first year, even though Power BI holds 20.06% market share and Tableau 16.37%. It also points out that long-term costs like training, slow adoption, and maintenance are often ignored, especially when startups already run thin data teams and end up turning them into a “human API” bottleneck (Querio’s analysis of Tableau vs Power BI ROI and adoption friction).
That’s the lens worth using. Not features first. Operations first.
Table of Contents
Why Your BI Tool Choice Is More Than Just Features
Founders often buy BI software the way they buy SaaS tools. They compare screenshots, ask which one integrates with the warehouse, and look at the monthly price. That works for lightweight software. It doesn’t work for analytics infrastructure.
A BI tool changes how work flows through the company. Sales asks one question. Finance asks another. Product wants a cohort view by feature usage. Marketing wants attribution cleaned up. If the platform can’t support self-service cleanly, those questions land on the data team. Then every dashboard request becomes a hand-built artifact with custom logic and support overhead.
That’s where tableau vs power bi gets interesting. Both tools can produce solid dashboards. Both can support serious reporting. Both can also create a maintenance burden if your team confuses “people can view dashboards” with “people can answer their own questions.”
The failure pattern usually isn’t that the dashboard looks bad. It’s that the business needs ten new cuts of the same metric and only two people know how to produce them safely.
The practical issue is operating friction:
Metric logic spreads fast: Teams create report-specific calculations, and the same KPI starts showing up with different definitions.
Adoption stalls: Users can click filters, but they still depend on analysts for anything slightly off the happy path.
Backlogs become structural: The BI tool promises self-service, but the model, permissions, refreshes, and calculations still need specialists.
Tool fit hardens early: Once dashboards are embedded into weekly reporting and board prep, switching costs rise fast.
A startup doesn’t need the “most powerful” BI platform in the abstract. It needs the platform that creates the least drag for its stage, team shape, and technical stack.
That usually means picking a compromise on purpose.
An Overview of Tableau and Power BI
Tableau and Power BI solve similar problems, but they come from different product philosophies.
Here’s the fastest way to frame tableau vs power bi before getting lost in feature grids:
Area | Tableau | Power BI |
|---|---|---|
Core identity | Visual analytics and exploration | Reporting and analytics within the Microsoft stack |
Typical strength | Flexible dashboard design and storytelling | Cost efficiency and Microsoft integration |
Best fit | Teams that need rich self-service exploration | Teams already standardized on Microsoft tools |
Main learning pain | Advanced calculations and dashboard craft | DAX and model design complexity |
Common scaling issue | Extract strategy and governance sprawl | Model tuning and performance under complexity |
Tableau in practice
Tableau is the tool I’d describe as analyst-first and presentation-conscious. It was built around the idea that users should be able to explore data visually, ask follow-up questions quickly, and shape dashboards with a high degree of freedom. That matters when your team cares about discovery, not just distribution.
It also tends to appeal to companies that want data stories to land well with executives, customers, or non-technical operators. The interface encourages visual thinking. That doesn’t mean it’s simple at every level. It means the product’s center of gravity is exploration.
For a broader framing of how BI platforms differ by operating model, this business intelligence tools overview is useful context.
Power BI in practice
Power BI is Microsoft’s analytics layer, and that’s both its advantage and its limitation. If your company already lives in Excel, Teams, Azure, and Microsoft identity, Power BI often fits quickly. It feels familiar to spreadsheet-heavy operators and tends to make sense to IT and finance teams that want reporting tied tightly to the rest of the Microsoft estate.
Its center of gravity is structured reporting and data modeling. That makes it strong for operational dashboards and standardized business reporting. It also means the tool often rewards teams that can model carefully and invest in semantic consistency.
Founder lens: Power BI usually wins faster inside a Microsoft-native company. Tableau usually wins faster when the team values visual flexibility and open-ended exploration.
The core philosophical split
The practical distinction is simple:
Tableau asks, “How can a user explore and present this data well?”
Power BI asks, “How can this fit into a governed reporting environment tied to Microsoft workflows?”
Neither philosophy is wrong. The mistake is ignoring which one matches your company.
If your team mostly consumes recurring dashboards, Power BI’s structure can be an asset. If your team constantly asks new questions and needs dashboards that feel less templated, Tableau tends to fit that motion better.
Deep Dive on Features and Functionality
The feature conversation still matters. It just matters as an extension of workflow, not as a checklist contest.
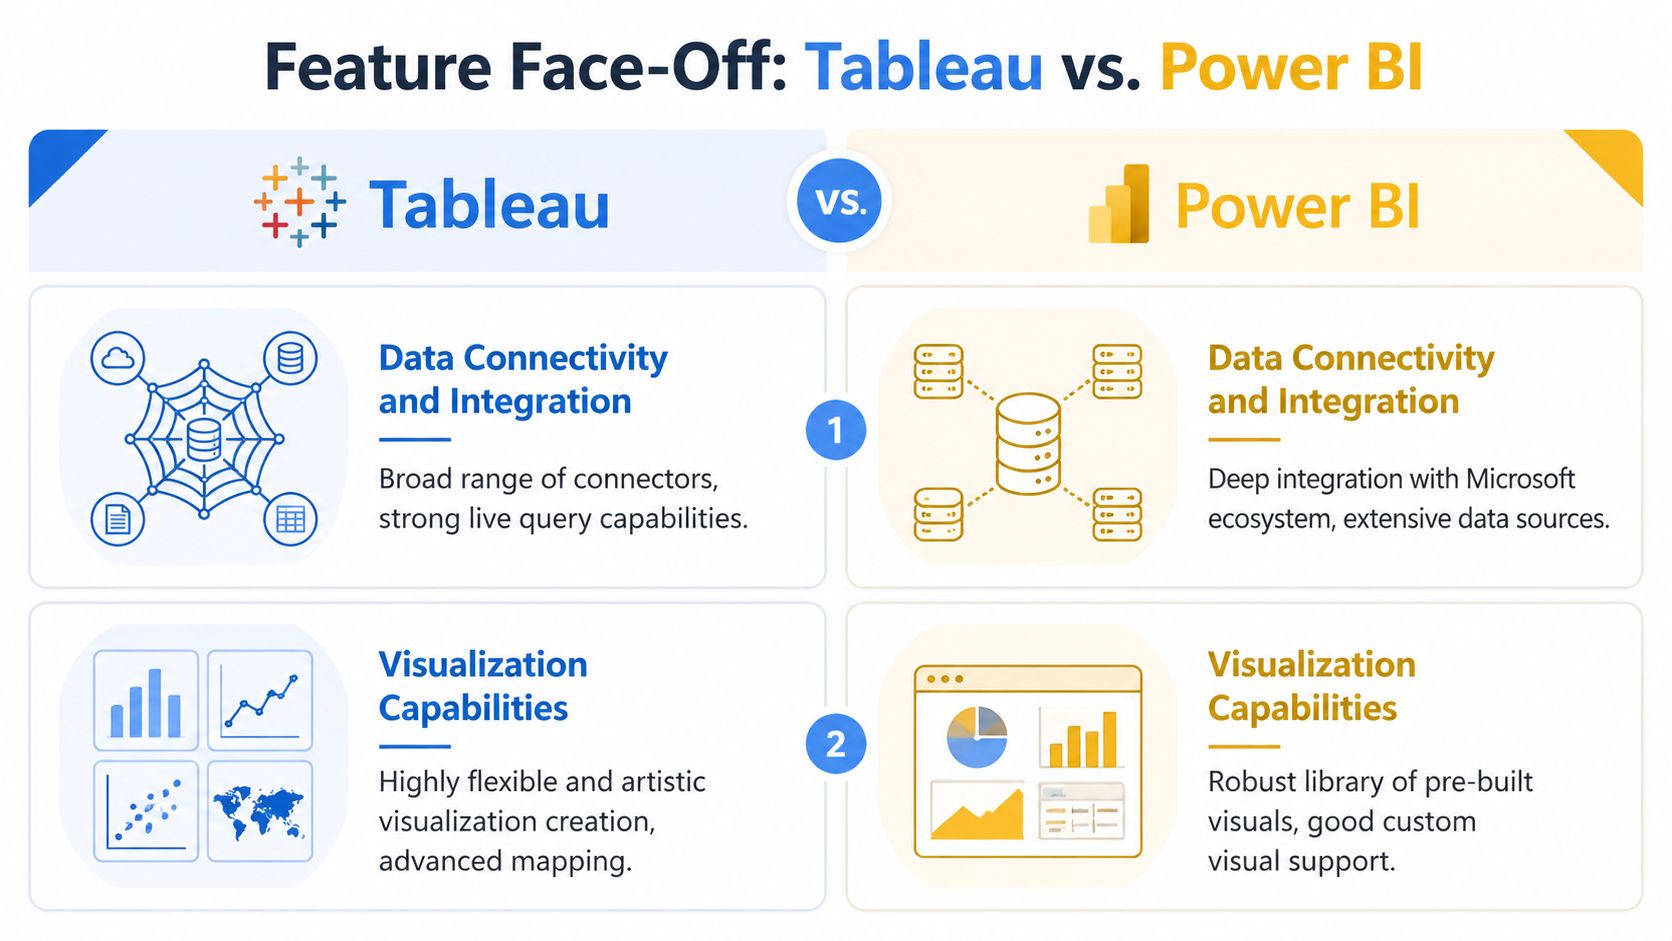
Data connectivity and integration
Both tools connect to the usual modern stack. The difference is less about whether they can connect and more about how naturally they fit your environment once connected.
Tableau is more platform-agnostic in spirit. It works well when your stack spans cloud systems, external warehouses, and mixed infrastructure. That flexibility matters for startups that have grown through tool sprawl and don’t want analytics architecture dictated by one vendor relationship.
Power BI is broad enough for many organizations, but its happiest path still runs through Microsoft. If your warehouse, identity, and collaboration stack already center on Azure and Microsoft 365, that’s an advantage. If they don’t, you can still use Power BI effectively, but the friction tends to show up later in administration and tuning.
A good evaluation rubric is whether the tool supports the capabilities your team will need over the next year, not just the integrations you need today. This guide to essential BI platform capabilities is a solid checklist for that.
If your data stack is mixed and likely to stay mixed, Tableau usually gives you more room. If your stack is intentionally consolidating around Microsoft, Power BI gets simpler.
Visualization capabilities
Tableau vs Power BI stops being a close match.
Tableau is stronger when the dashboard needs to persuade, guide, or reveal patterns through design. It offers more freedom in how a view is composed, how interactions feel, and how the final product tells a story. That matters for executive dashboards, board materials, customer-facing analytics, and any workflow where design quality changes adoption.
Power BI is capable and often perfectly adequate for standard reporting. It handles common business visuals well. It’s productive when you need repeatable dashboards for teams that care more about getting the KPI than admiring the craft.
The gap shows up when the request gets weird. Multi-layered interactions, unusual visual structures, polished exploratory experiences, and nuanced storytelling tend to be easier in Tableau.
Later in this section, this walkthrough adds another angle on how the tools feel in real use:
The strongest empirical case for Tableau in this area is user enablement. Customers adopting Tableau over Power BI reported a 33% increase in insights-driven decision-making, a 32% increase in business user productivity, and a 27% increase in IT systems agility and flexibility according to a Salesforce survey summarized by TechnologyAdvice’s Tableau vs Power BI analysis.
That doesn’t mean Tableau is magically easier in every context. It means the product’s design appears to support broader business usage when teams need non-technical users to work more independently.
Data modeling and calculation logic
Power BI often wins the technical argument and loses the staffing argument.
Power BI’s modeling stack is powerful. If you have people who can design models properly and write DAX well, you can build advanced business logic into the system. For finance-heavy reporting, recurring operational dashboards, and tightly controlled metric definitions, that’s valuable.
The problem is that DAX becomes a gate. Many teams underestimate how much of their long-term success depends on a small number of people who know how the model works and how calculations behave under filter context. Once that knowledge concentrates, self-service becomes conditional.
Tableau’s calculation model is less centered on one specialized language bottleneck. It still has complexity. Advanced Tableau work is not beginner work. But the path from question to answer is often more intuitive for analysts and business users who think visually rather than semantically.
A practical way to compare them:
Functional area | Tableau tends to work better when | Power BI tends to work better when |
|---|---|---|
Dashboard creation | You need custom, polished, exploratory views | You need standardized internal reporting |
User independence | Analysts and business users need faster iteration | A central team governs model logic tightly |
Calculation experience | Users prefer visual analysis with lighter coding expectations | The company can support DAX-heavy semantic modeling |
Ecosystem fit | Your tools span multiple platforms and clouds | You’re committed to Microsoft workflows |
Working rule: If your team says it wants self-service, ask who will maintain the calculation layer. If the honest answer is “one analytics engineer and one finance analyst,” Power BI can become fragile fast.
Analyzing Pricing and Total Cost of Ownership
The advertised price is rarely the actual cost driver in tableau vs power bi. Founders focus on license math because it’s visible. The expensive part is what the tool forces your people to do after purchase.
License cost is the smallest argument
Power BI usually enters the room as the cheaper option. In many startups, that’s true enough to matter. If you already pay Microsoft for adjacent tools, Power BI can look like the financially responsible choice.
But “cheaper” only holds if the implementation stays simple. Once the team needs stronger governance, heavier modeling, premium capacity decisions, or more support around DirectQuery and semantic tuning, the gap narrows in practice. Not always in invoice terms. Often in engineering and analyst time.
Tableau starts from a more premium posture. That’s visible earlier. Teams usually feel the cost upfront, which can indeed be healthy because it forces a more honest discussion about who the tool is for and how widely it needs to spread.
People cost is where teams get trapped
The hidden cost is specialization.
Power BI often requires deeper modeling discipline and stronger DAX competence as complexity grows. That can work well in a larger company with established BI staffing. In a startup, it often means a few people become critical infrastructure. If one leaves, the reporting layer gets brittle.
Tableau has its own talent cost. Strong Tableau developers aren’t just dashboard builders. The good ones understand interaction design, data shaping, calculations, and performance decisions. But the day-to-day path for non-technical users is often more forgiving, which can reduce dependence on a narrow expert bottleneck.
This is the part most budget models miss. The invoice may fit your budget while the operating burden does not.
For a more direct breakdown of these second-order costs, this piece on the hidden costs of traditional BI platforms is worth reading.
The wrong BI tool doesn’t just cost money. It costs focus. Your data team stops building systems and starts translating requests.
The hidden TCO checklist founders should use
Before signing, ask these questions in plain language:
Who builds the first version of the dashboard? If the answer is “our analyst,” that’s fine. If the same person also owns every revision, access policy, metric dispute, and refresh issue, the tool won’t scale socially.
Who owns metric definitions? If the metric logic lives mostly inside individual reports, your TCO will climb through rework and trust problems.
What happens when product, sales, and finance want the same KPI sliced differently? Some tools handle this with graceful reuse. Others push teams toward report sprawl.
How much training can your company realistically absorb? A platform with a steeper conceptual model creates hidden onboarding costs even if it looks cheap at procurement time.
Will this stay internal, or become customer-facing? Tools that work for internal reporting can become awkward once product wants embedded analytics.
The right founder mindset is simple. Buy the tool your team can operate consistently, not the one that wins a feature bake-off.
Comparing Deployment, Performance, and Scalability
A lot of startup teams don’t think hard enough about deployment and scale until the dashboards feel slow or the customer-facing use case shows up. By then, the architecture is already entrenched.
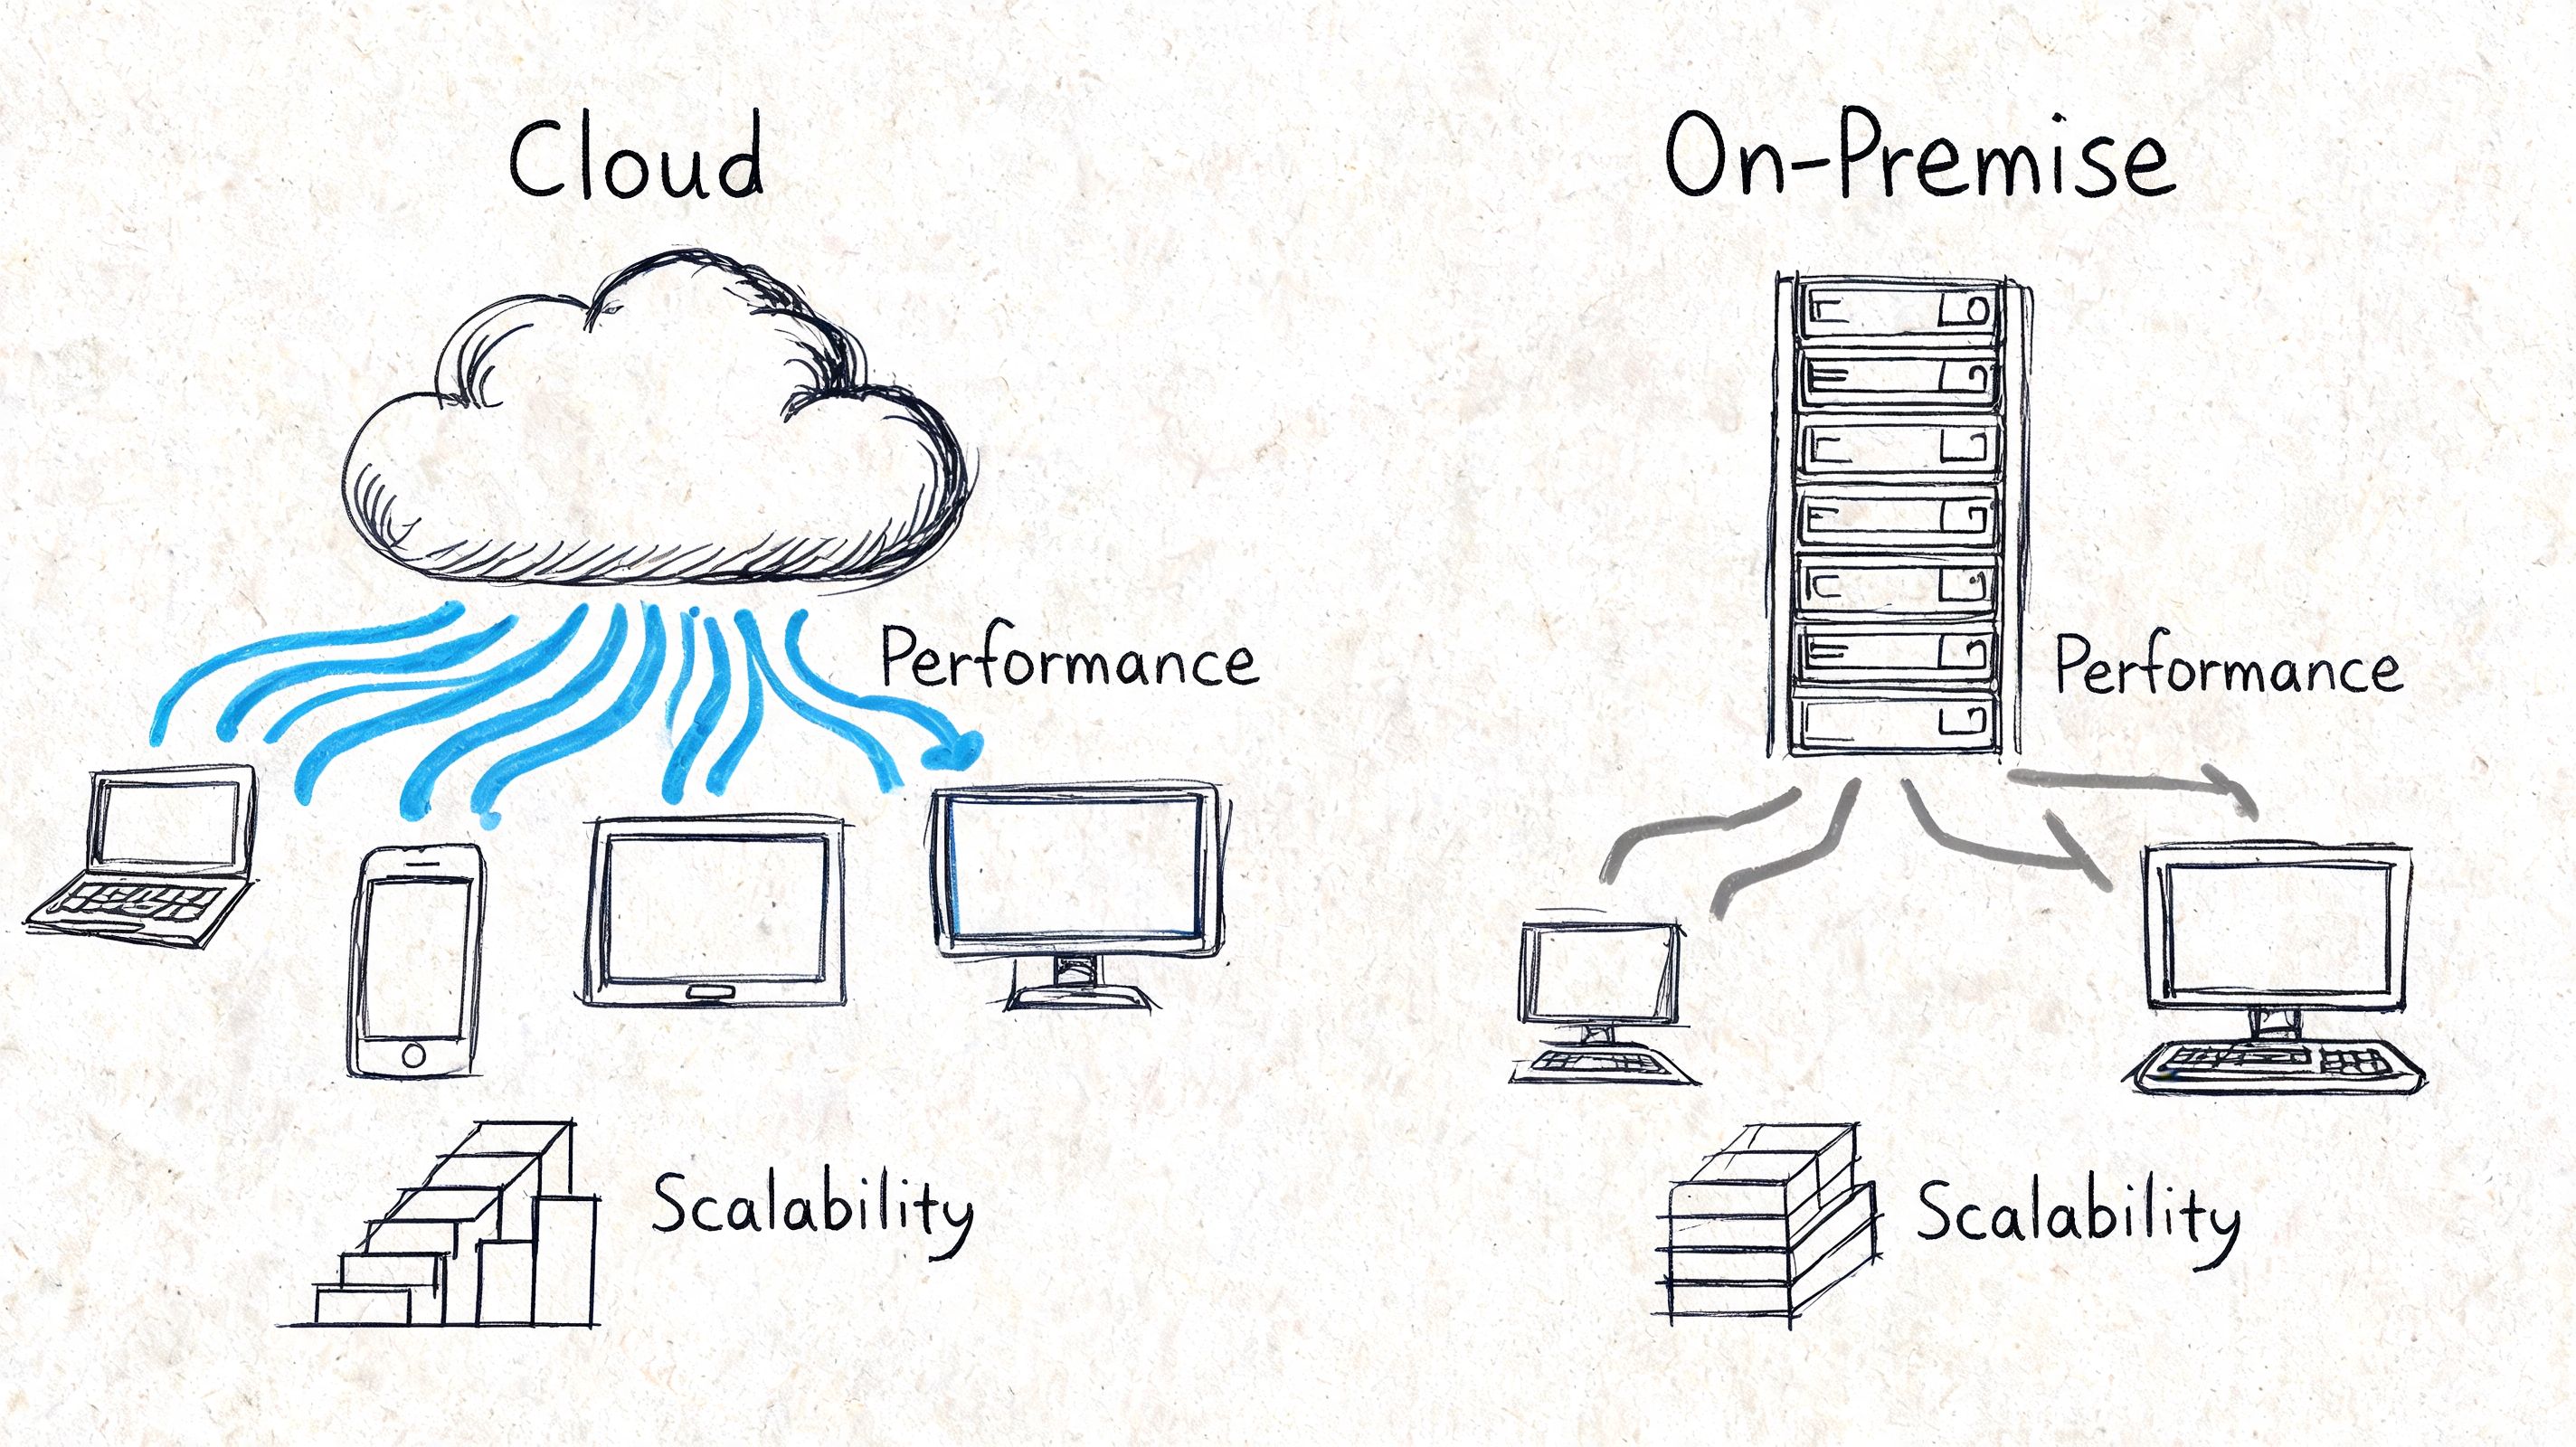
Deployment models
Tableau gives teams more flexibility in where and how they run the platform. It can fit organizations that need on-premise, private cloud, public cloud, or mixed deployment patterns. That matters less for an early startup with a clean cloud stack, and more for companies with enterprise customers, compliance requirements, or legacy infrastructure constraints.
Power BI is more naturally cloud-forward inside Microsoft’s world. For plenty of startups, that’s fine. In fact, it can simplify administration because the defaults align with where the rest of the company already works.
The trade-off is strategic flexibility. If your company wants to remain platform-neutral, Tableau tends to preserve more optionality. If you’ve already decided Microsoft is the operating layer, Power BI benefits from that commitment.
Performance at scale
This is one of the clearest practical differences.
In benchmark comparisons for large datasets, Tableau consistently outperforms Power BI due to its optimized SQL engine and extract-based architecture, while Power BI is responsive for smaller datasets but often requires DAX-heavy modeling and tuning in DirectQuery mode, which can create bottlenecks at enterprise scale, according to Supaboard’s Tableau vs Power BI performance analysis.
That aligns with what many teams discover operationally. Power BI often feels good early, then demands more engineering care as data complexity, concurrency, and real-time expectations rise. Tableau also forces trade-offs, especially around extracts versus live access, but it tends to hold up better when the workload becomes analytically heavy.
A practical summary:
Scenario | Tableau | Power BI |
|---|---|---|
Smaller internal reporting workloads | Usually solid | Usually solid and often efficient |
Large analytical datasets | Tends to perform better | Often needs more tuning |
Real-time access needs | Trade-offs between live and extract | Trade-offs between import and DirectQuery |
Mixed cloud warehouse environments | More flexible fit | Stronger when aligned to Microsoft stack |
If your dashboards are already slow in a simple environment, don’t assume premium licensing will solve a modeling problem.
Embedding and product use cases
Internal BI and embedded analytics are different businesses.
For internal reporting, both tools can work. For customer-facing analytics, the standard gets higher. Product teams need stronger control over experience, permissioning, performance behavior, and how analytics blends into the application.
Tableau often makes more sense when the goal is richer exploratory analytics inside a product or partner portal. Its visual flexibility helps when the analytics experience needs to feel intentional rather than bolted on.
Power BI can still be embedded effectively, especially in Microsoft-centric environments. But if the use case starts to resemble a data product rather than a reporting tab, its constraints show up faster. You start negotiating around the platform instead of just building.
The practical lesson is to decide early whether analytics is an internal function or part of the customer experience. That one distinction changes the whole tableau vs power bi decision.
Evaluating AI Capabilities and Data Governance
AI features get a lot of airtime in BI demos. Governance gets less. In practice, governance breaks your rollout faster than AI rescues it.
AI features are helpful but narrow
Both Tableau and Power BI now present AI-assisted capabilities. They can surface patterns, make question-asking easier, and help less technical users move from dashboard consumption toward analysis.
That’s useful, but it doesn’t remove the core constraint of either platform. These tools still work best when the underlying data is modeled, permissioned, and semantically coherent. AI can accelerate interaction with structured analytics. It doesn’t solve a messy metric layer or a confused warehouse.
For teams evaluating natural-language workflows more seriously, this comparison of natural language query in ThoughtSpot, Power BI, and Tableau is a better lens than vendor AI branding.
The key founder takeaway is blunt: if your team struggles with trusted definitions, AI won’t make the confusion disappear. It may just make bad queries easier to ask.
Governance matters earlier than founders expect
Startups often think governance is an enterprise concern. It isn’t. The moment sales, finance, product, and leadership depend on the same dashboard in different ways, governance becomes operational.
Power BI tends to appeal to teams that want a stronger central semantic model and more structured control. That’s a real advantage when finance and operations need consistency above all else. The downside is that the central model can also become the choke point that slows everyone down.
Tableau often enables faster local exploration, but that freedom has a cost if teams don’t actively manage source reuse, access rules, and dashboard sprawl. Without discipline, self-service becomes fragmentation.
A workable governance approach for either tool needs at least these pieces:
Certified core metrics: Revenue, active users, churn, and pipeline should not live as ad hoc report logic.
Clear workspace ownership: Someone must own what gets published, archived, and reused.
Access by role, not by request: Permission models get messy quickly when handled one-off.
A policy for dashboard retirement: Old dashboards poison trust.
Good governance doesn’t mean locking everything down. It means letting people move fast without redefining the business each time they open a workbook.
The Final Verdict Which Tool Is Right for You
Most articles end tableau vs power bi with “it depends.” That’s technically true and practically useless.
Here’s the sharper version. Pick based on your company’s operating model, not your demo reaction.
Choose Power BI if your company already runs on Microsoft
Power BI is the pragmatic choice for a startup or mid-market team that already lives in Microsoft. If your people work in Excel every day, collaborate in Teams, authenticate through Microsoft, and store data close to Azure, Power BI reduces friction.
It’s especially good when your main need is internal reporting. Weekly metrics, finance packs, sales dashboards, and standardized operational views fit it well. If your team can support disciplined modeling and someone can own DAX quality, it can be a very sensible investment.
Pick Power BI if these statements are true:
Your company is already standardized on Microsoft
Cost control matters more than design flexibility
Most users consume recurring dashboards rather than perform extensive data exploration
You can support a more technical semantic layer without overloading a tiny team
Choose Tableau if analytics is a product not just a report
Tableau is the better fit when visual communication, exploratory analysis, and platform flexibility matter more than lowest-cost reporting. If product managers, analysts, and executives constantly ask follow-up questions and need dashboards that support discovery, Tableau has the edge.
It also makes more sense when analytics is moving closer to the product experience. Richer storytelling, more flexible dashboard behavior, and better performance on large analytical workloads make it a stronger choice for companies building analytics into customer relationships, not just internal meetings.
Pick Tableau if these statements are true:
Your stack is mixed and you want platform flexibility
Dashboard quality affects stakeholder adoption
Your team values self-service exploration over rigid reporting workflows
You expect analytical complexity to grow faster than administrative simplicity
Choose neither if your core problem is self-service at scale
Some startups ask the wrong tool question. They compare Tableau and Power BI when the actual problem is that business users need to ask more questions without waiting on the data team.
If your team already feels like a service desk for dashboard changes, adding another classic BI platform may not fix the bottleneck. It may formalize it. In that situation, you may need a different model entirely, one that treats the warehouse as the product and supports self-service exploration without routing every request through report builders. One example is Querio, which deploys AI coding agents on the warehouse and uses a file-system approach with Python notebooks for both technical and non-technical users.
That matters even more as proprietary data becomes part of competitive strategy. This piece on the AI upgrade for market data moats is useful because it frames analytics not just as reporting, but as part of how companies build durable advantage.
My advice to founders is simple:
Choose Power BI if your environment is already Microsoft-first and your primary need is governed internal reporting.
Choose Tableau if your company needs richer analysis, stronger presentation quality, and more flexibility across systems.
Reconsider the category if your biggest pain is analyst bottlenecks rather than dashboard aesthetics or license cost.
The wrong purchase isn’t the more expensive one. It’s the one that teaches your company to wait for answers.
If your team is stuck between dashboard sprawl and analyst bottlenecks, Querio is worth a look. It’s designed for companies that want self-service analytics directly on the warehouse, with AI agents and notebook-style workflows that reduce the need to route every new question through the data team.

